

Using elastography-based multilayer perceptron model to evaluate renal fibrosis in chronic kidney disease
- PMID: 37073623
- PMCID: PMC10120461
- DOI: 10.1080/0886022X.2023.2202755
Using elastography-based multilayer perceptron model to evaluate renal fibrosis in chronic kidney disease
Abstract
Background: Given its progressive deterioration in the clinical course, noninvasive assessment and risk stratification for the severity of renal fibrosis in chronic kidney disease (CKD) are required. We aimed to develop and validate an end-to-end multilayer perceptron (MLP) model for assessing renal fibrosis in CKD patients based on real-time two-dimensional shear wave elastography (2D-SWE) and clinical variables.
Methods: From April 2019 to December 2021, a total of 162 patients with CKD who underwent a kidney biopsy and 2D-SWE examination were included in this single-center, cross-sectional, and prospective clinical study. 2D-SWE was performed to measure the right renal cortex stiffness, and the corresponding elastic values were recorded. Patients were categorized into two groups according to their histopathological results: mild and moderate-severe renal fibrosis. The patients were randomly divided into a training cohort (n = 114) or a test cohort (n = 48). The MLP classifier using a machine learning algorithm was used to construct a diagnostic model incorporating elastic values with clinical features. Discrimination, calibration, and clinical utility were used to appraise the performance of the established MLP model in the training and test sets, respectively.
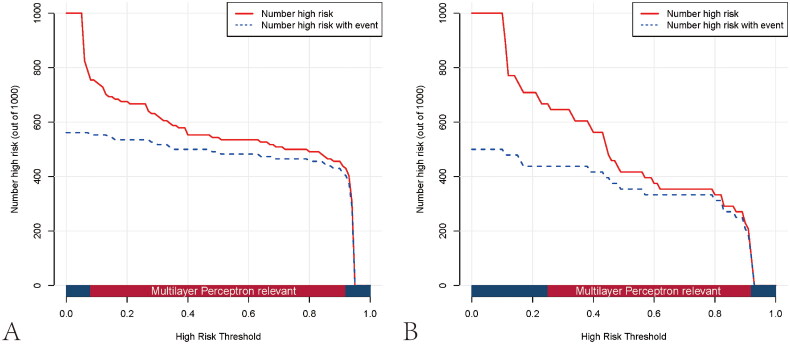
Results: The developed MLP model demonstrated good calibration and discrimination in both the training [area under the receiver operating characteristic curve (AUC) = 0.93; 95% confidence interval (CI) = 0.88 to 0.98] and test cohorts [AUC = 0.86; 95% CI = 0.75 to 0.97]. A decision curve analysis and a clinical impact curve also showed that the MLP model had a positive clinical impact and relatively few negative effects.
Conclusions: The proposed MLP model exhibited the satisfactory performance in identifying the individualized risk of moderate-severe renal fibrosis in patients with CKD, which is potentially helpful for clinical management and treatment decision-making.
Keywords: Chronic kidney disease; machine learning; multilayer perceptron; renal fibrosis; shear wave elastography.
Conflict of interest statement
All authors declare no conflict of interest.
Figures


Similar articles
-
Interpretable machine learning model integrating clinical and elastosonographic features to detect renal fibrosis in Asian patients with chronic kidney disease.J Nephrol. 2024 May;37(4):1027-1039. doi: 10.1007/s40620-023-01878-4. Epub 2024 Feb 5. J Nephrol. 2024. PMID: 38315278 Free PMC article.
-
Assessment of Renal Fibrosis in Patients With Chronic Kidney Disease Using Shear Wave Elastography and Clinical Features: A Random Forest Approach.Ultrasound Med Biol. 2023 Jul;49(7):1665-1671. doi: 10.1016/j.ultrasmedbio.2023.03.024. Epub 2023 Apr 25. Ultrasound Med Biol. 2023. PMID: 37105772
-
A nomogram based on shear wave elastography for assessment of renal fibrosis in patients with chronic kidney disease.J Nephrol. 2023 Apr;36(3):719-729. doi: 10.1007/s40620-022-01521-8. J Nephrol. 2023. PMID: 36396847 Clinical Trial.
-
Assessment of biopsy-proven liver fibrosis by two-dimensional shear wave elastography: An individual patient data-based meta-analysis.Hepatology. 2018 Jan;67(1):260-272. doi: 10.1002/hep.29179. Epub 2017 Nov 15. Hepatology. 2018. PMID: 28370257 Free PMC article. Review.
-
Shear wave elastography in chronic kidney disease - the physics and clinical application.Phys Eng Sci Med. 2024 Mar;47(1):17-29. doi: 10.1007/s13246-023-01358-w. Epub 2023 Dec 11. Phys Eng Sci Med. 2024. PMID: 38078996 Review.
Cited by
-
Combining Super-Resolution Imaging and Shear Wave Elastography for Enhanced Risk Assessment of Moderate-to-Severe Renal Fibrosis in Chronic Kidney Disease Patients.Int J Nephrol Renovasc Dis. 2025 Jun 30;18:187-199. doi: 10.2147/IJNRD.S528614. eCollection 2025. Int J Nephrol Renovasc Dis. 2025. PMID: 40620519 Free PMC article.
-
Advancements in the non-invasive diagnosis of renal fibrosis.Front Med (Lausanne). 2025 Jul 30;12:1646412. doi: 10.3389/fmed.2025.1646412. eCollection 2025. Front Med (Lausanne). 2025. PMID: 40809416 Free PMC article. Review.
-
The association between renal medullary and cortical fibrosis, stiffness, and concentrating capacity: an observational, single-center cross-sectional study.Clin Exp Nephrol. 2024 Dec;28(12):1290-1299. doi: 10.1007/s10157-024-02538-y. Epub 2024 Aug 5. Clin Exp Nephrol. 2024. PMID: 39098924
-
Interpretable machine learning model integrating clinical and elastosonographic features to detect renal fibrosis in Asian patients with chronic kidney disease.J Nephrol. 2024 May;37(4):1027-1039. doi: 10.1007/s40620-023-01878-4. Epub 2024 Feb 5. J Nephrol. 2024. PMID: 38315278 Free PMC article.
-
TGF-β1 induces ROS to activate ferroptosis via the ERK1/2-WISP1 pathway to promote the progression of renal tubular epithelial cell fibrosis.Cytotechnology. 2025 Apr;77(2):61. doi: 10.1007/s10616-025-00719-5. Epub 2025 Feb 14. Cytotechnology. 2025. PMID: 39959788
References
-
- Legrand K, Speyer E, Stengel B, et al. . Perceived health and quality of life in patients with CKD, including those with kidney failure: findings from national surveys in France. Am J Kidney Dis. 2020;75(6):868–878. - PubMed
-
- Romagnani P, Remuzzi G, Glassock R, et al. . Chronic kidney disease. Nat Rev Dis Primers. 2017;3:17088. - PubMed
Publication types
MeSH terms
LinkOut - more resources
Full Text Sources
Other Literature Sources
Medical
Miscellaneous