. 2023 Jun;27(11):1477-1492.
doi: 10.1111/jcmm.17748. Epub 2023 Apr 19.

M2-like macrophages polarized by Foxp3- Treg-of-B cells ameliorate imiquimod-induced psoriasis

Affiliations

M2-like macrophages polarized by Foxp3- Treg-of-B cells ameliorate imiquimod-induced psoriasis

Jing-Hui Huang et al. J Cell Mol Med. 2023 Jun.

Abstract

Our group have demonstrated that splenic B cells contributed to the CD4+ CD25- naive T cells conversion into CD4+ CD25+ Foxp3- regulatory T cells without adding appended cytokines, named Treg-of-B cells which were potent suppressors of adaptive immunity. We like to investigate whether Treg-of-B cells could promote alternatively activated macrophage (M2 macrophages) polarization and alleviate inflammatory disease, psoriasis. In this study, we co-cultured the bone marrow-derived macrophages (BMDMs) with Treg-of-B cells under LPS/IFN-γ stimulation and analyzed the M2-associated gene and protein using qPCR, western blotting, and immunofluorescence staining. We also examined the therapeutic effect of Treg-of-B cell-induced M2 macrophage for skin inflammation using imiquimod (IMQ)-induced psoriatic mouse model. Our results showed that BMDMs co-cultured with Treg-of-B cells upregulated typical M2-associated molecules, including Arg-1, IL-10, Pdcd1lg2, MGL-1, IL-4, YM1/2 and CD206. In an inflammatory environment, TNF-α and IL-6 production by macrophages co-cultured with Treg-of-B cells was decreased significantly. The molecular mechanism revealed that Treg-of-B cells promoted M2 macrophage polarization via STAT6 activation in a cell contact-dependent manner. Moreover, the treatment with Treg-of-B cell-induced M2 macrophages attenuated the clinical manifestations of psoriasis, such as scaling, erythema and thickening in the IMQ-induced psoriatic mouse model. T cell activation in draining lymph nodes was decreased in the Treg-of-B cell-induced M2 macrophage group after IMQ application. In conclusion, our findings suggested that Foxp3- Treg-of-B cells could induce alternatively activated M2 macrophages through STAT6 activation, providing a cell-based therapeutic strategy for psoriasis.

Keywords: M2 macrophage; STAT6; Treg-of-B cells; imiquimod; psoriasis.


Conflict of interest statement

The authors have declared no competing interests exist.

Figures
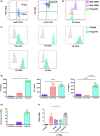
FIGURE 1
FIGURE 1
Characteristics of Treg‐of‐B cells. (A) Dot plot represents the expression of CD4 and CD25 in naïve CD4+ T cells, tTreg cells and Treg‐of‐B cells. CD4+ CD25+ cells were isolated as tTreg cells and CD4+ CD25 as responder T cells. (B) Expression of Foxp3 in Treg‐of‐B cells compared to CD4+ CD25+ and CD4+ CD25 T cells. (C) Flow cytometry analysis showed the expression of surface markers in Treg‐of‐B cells. (D) Cytokine production by Treg‐of‐B cells, CD4+ CD25+ and CD4+ CD25 T cells were measured by ELISA. (E) We measured the expression of Il10 mRNA in CD4+ CD25 T, CD4+ CD25+ and Treg‐of‐B cells. The mRNA levels were normalized by housekeeping gene Gapdh. (F) Suppressive effect of Treg‐of‐B cells was determined by examining T cell proliferation. The data are representative of two or three independent experiments. The values are expressed as mean ± SEM *p < 0.05, **p < 0.01 and ****p < 0.0001, by one‐way analysis of variance (anova) with Bonferroni's multiple comparison test.
FIGURE 2
FIGURE 2
Treg‐of‐B cell‐induced M2 macrophage polarization. (A–C) BMDMs were co‐cultured with Treg‐of‐B cells at 1:3 ratio under anti‐CD3/CD28 stimulation overnight. Subsequently, BMDMs were treated with LPS/IFN‐γ for 24 h. Gene expression levels in BMDMs were determined by RT‐PCR. The mRNA levels were normalized by housekeeping gene Gapdh. (D–E) After co‐culturing with Treg‐of‐B cells, the macrophages were subjected to immunofluorescence staining with DAPI (blue), Alexa 647‐F4/80 (green), PE‐PDL2 (red) and PE‐MGL‐1 (red) to visualize their expression (scale bar, 200 μm). (F) BMDMs were cultured together with Treg‐of‐B cells under anti‐CD3/CD28 activation. Next, the cultures were stimulated with IL‐4 for 24 h. The mRNA expression in BMDMs was analyzed by Q‐PCR. ‘‐’(control) group was BMDMs. The data are representative of two or three independent experiments. The values are expressed as mean ± SEM *p < 0.05, **p < 0.01 and ***p < 0.001, ****p < 0.0001, by one‐way analysis of variance (anova) with Bonferroni's multiple comparison test.
FIGURE 3
FIGURE 3
Treg‐of‐B cells promote M2 polarization in a cell contact‐dependent manner. (A–C) BMDMs were co‐cultured with Treg‐of‐B cells at a 1:3 ratio under anti‐CD3/CD28 stimulation overnight in the presence or absence of a Transwell system. The mRNA expression in BMDMs was analyzed after LPS/IFN‐γ or IL‐4 stimulation. (D) The production of Arg‐1 protein in BMDMs was detected by western blotting. (E) TNF‐α production by BMDMs co‐cultured with Treg‐of‐B cells in a Transwell system was measured by ELISA. ‘‐’(control) group was BMDMs. The data are representative of two or three independent experiments. The values are expressed as mean ± SEM *p < 0.05, **p < 0.01 and ***p < 0.001, ****p < 0.0001, by one‐way analysis of variance (anova) with Bonferroni's multiple comparison test.
FIGURE 4
FIGURE 4
Treg‐of‐B cells induced programming of M2 macrophages via STAT6 activation. (A) Phosphorylated STAT6 and total STAT6 in LPS/IFN‐γ‐stimulated BMDMs co‐cultured with anti‐CD3/CD28 stimulated Treg‐of‐B cells were detected by western blotting. The ratio of phosphorylated STAT6 to the total basal STAT6 protein was quantified by performing densitometry on the immunoblots and analyzed using Image J. (B) IL‐4 neutralizing antibodies were added to the Treg‐of‐B cell‐BMDMs co‐culture system. The mRNA expression in BMDMs was analyzed by Q‐PCR. (C) Inflammatory cytokine production was measured by ELISA. (D) Phosphorylated STAT6 and total STAT6 were detected in BMDMs co‐cultured with Treg‐of‐B cells in the presence or absence of a Transwell system. The ratio of phosphorylated STAT6 to the total basal STAT6 protein was quantified by performing densitometry on the immunoblots and analyzed using Image J. (E) The expression of downstream molecules of the STAT6 pathway in BMDMs co‐cultured with Treg‐of‐B cells was analyzed. The data are representative of two or three independent experiments. ‘‐’(control) group was BMDMs. The values are expressed as mean ± SEM *p < 0.05, **p < 0.01 and ****p < 0.0001; n.s. = not significant. The data were analyzed by one‐way analysis of variance (anova) with Bonferroni's multiple comparison test.
FIGURE 5
FIGURE 5
STAT6 played a role in M2 polarization by Treg‐of‐B cells, not in suppressing macrophage activation. (A, C) Wild‐type or STAT6−/− BMDMs were co‐cultured with Treg‐of‐B cells at a 1:3 ratio under anti‐CD3/CD28 stimulation overnight. Next, BMDMs were treated with LPS/IFN‐γ for 24 h. The mRNA expression in BMDMs was analyzed by Q‐PCR. (B) The protein level of Arg‐1 in BMDMs was detected by western blotting. (D) Cytokine production by Treg‐of‐B cell–BMDM co‐cultures were measured by ELISA. The data are representative of two or three independent experiments. The values are expressed as mean ± SEM *p < 0.05, **p < 0.01 and ****p < 0.0001; n.s. = not significant. The data were analyzed by one‐way analysis of variance (anova) with Bonferroni's multiple comparison test.
FIGURE 6
FIGURE 6
Treg‐of‐B cell‐induced M2 macrophages alleviate psoriasis. (A) IMQ cream was applied to the shaved back skin of mice for 4 consecutive days. Treg‐of‐B cell‐induced M2 macrophages were adoptively transferred to mice via intravenous injection on days 0, 1 and 3. (B) Phenotypical presentation of the back skin in the negative control, IMQ, Treg‐of‐B cell‐induced M2 and dexamethasone groups. (n = 3/NC group, n = 4/IMQ group, n = 4/Treg‐of‐B cell‐induced M2 group, n = 5/ dexamethasone groups). (C) The skin sections were stained with haematoxylin and eosin staining to examine the infiltration of immune cells and the thickness of epidermal tissue. (D) To quantify epidermal thickness in the skin section pictures with H and E staining. (E) Scaling and erythema were scored daily. The data are expressed as mean ± SEM *p < 0.05, ***p < 0.001 and ****p < 0.0001 vs Treg‐of‐B‐M2 group. # p < 0.05, ## p < 0.01, ### p < 0.001 and #### p < 0.0001 vs. Dexamethasone group. The data were analyzed by one‐way analysis of variance (anova) with Bonferroni's multiple comparison test. (F) Expression of inflammatory genes in skin tissue was analyzed by Q‐PCR. (G–I) Inflammatory cytokine production was measured in anti‐CD3/CD28 activated cells derived from the spleen, ILNs and ALNs. The data are expressed as mean ± SEM *p < 0.05, **p < 0.001, ***p < 0.001 and ****p < 0.0001, by one‐way analysis of variance (anova) with Bonferroni's multiple comparison test. (J) The skin sections from the psoriatic mouse model were stained with DAPI, Alexa 647‐F4/80 or Alexa 594‐TCR β to examine macrophage (orange) and T cell (red) infiltration in skin tissues (scale bar, 50 μm).
FIGURE 7
FIGURE 7
Treg‐of‐B cells alleviate psoriasis by inducing M2 macrophages. Treg‐of‐B cells induce M2 macrophage polarization via STAT6 activation in a cell contact‐dependent manner. Adoptive transfer of Treg‐of‐B cell‐induced M2 macrophages reduces skin and systemic inflammation, such as scaling and erythema in an animal model of psoriasis.

References

    1. Rőszer T. Understanding the mysterious M2 macrophage through activation markers and effector mechanisms. Mediators Inflamm. 2015;2015:1‐16. - PMC - PubMed
    1. Yao Y, Xu XH, Jin L. Macrophage polarization in physiological and pathological pregnancy. Front Immunol. 2019;10:792. - PMC - PubMed
    1. Olszewski MA, Jablonski KA, Amici SA, et al. Novel markers to delineate murine M1 and M2 macrophages. Plos One. 2015;10:e0145342. - PMC - PubMed
    1. Romano M, Fanelli G, Tan N, et al. Expanded regulatory T cells induce alternatively activated monocytes with a reduced capacity to expand T helper‐17 cells. Front Immunol. 2018;9:1625. - PMC - PubMed
    1. Dominguez‐Villar M, Hafler DA. Regulatory T cells in autoimmune disease. Nat Immunol. 2018;19:665‐673. - PMC - PubMed

Publication types