

Hemostatic profiles in dogs with sudden acquired retinal degeneration syndrome
- PMID: 37073895
- PMCID: PMC10229342
- DOI: 10.1111/jvim.16710
Hemostatic profiles in dogs with sudden acquired retinal degeneration syndrome
Abstract
Background: Sudden acquired retinal degeneration syndrome (SARDS) is a common cause of irreversible blindness in dogs. It bears clinical resemblance to hypercortisolism, which can be associated with hypercoagulability. The role of hypercoagulability in dogs with SARDS is unknown.
Objective: Determine hemostatic profiles in dogs with SARDS.
Animals: Prospective pilot study: Dogs with a history of SARDS (n = 12). Prospective case-control study: Dogs with recent onset of SARDS (n = 7) and age-, breed-, and sex-matched controls (n = 7).
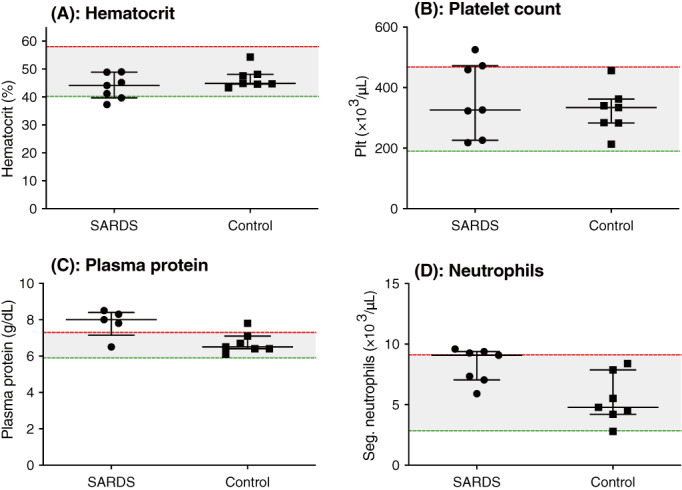
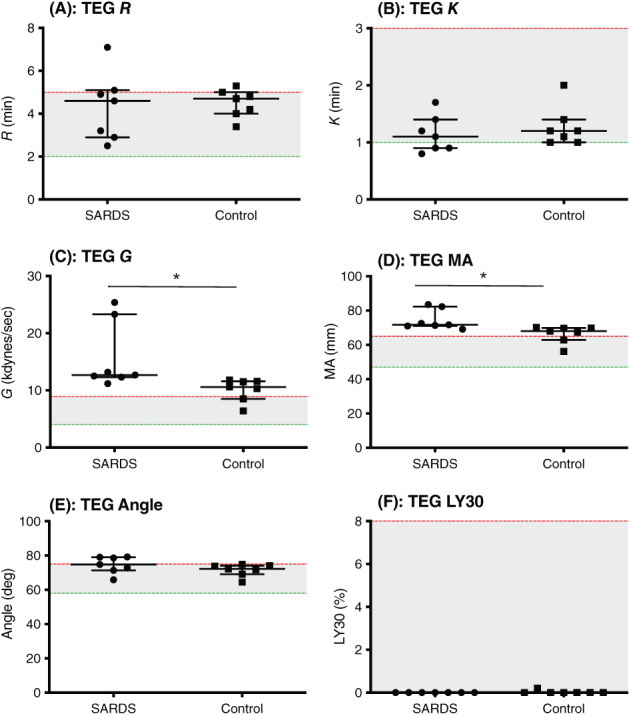
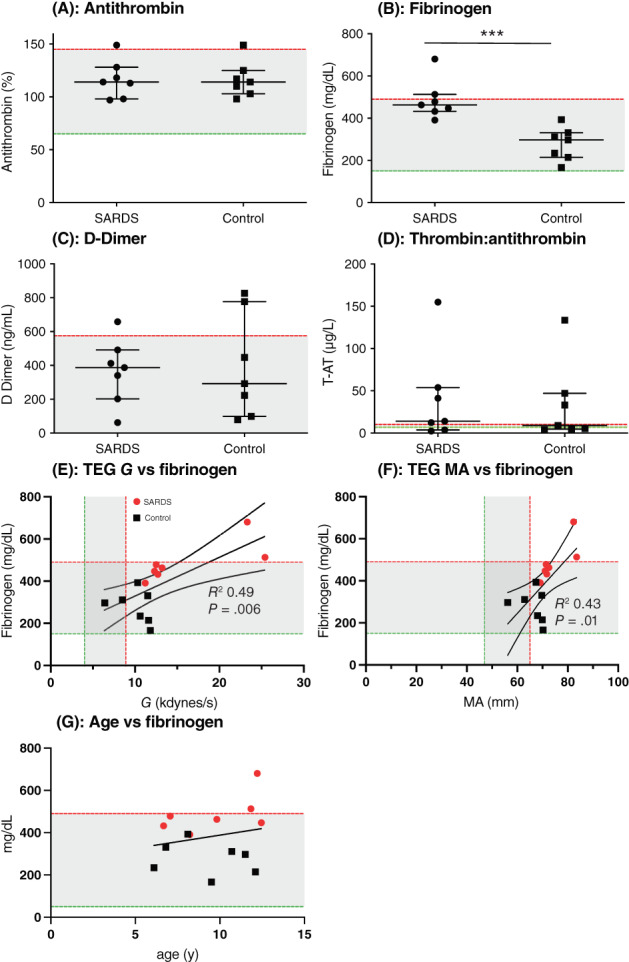
Methods: Prospective pilot study: We performed thromboelastography (TEG). Prospective case-control study: Dogs had CBC, serum biochemistry, urinalysis, TEG, fibrinogen concentration, antithrombin activity, D-dimers, thrombin-antithrombin complexes, and optical platelet aggregometry performed.
Results: Prospective pilot study: 9/12 dogs with a history of SARDS were hypercoagulable with increased TEG G value and 2/3 had hyperfibrinogenemia. Case-control study: All dogs with SARDS and 5/7 controls were hypercoagulable based on TEG G value. Dogs with SARDS had significantly higher G values (median, 12.7 kdynes/s; range, 11.2-25.4; P = .04) and plasma fibrinogen concentration (median, 463 mg/dL; range, 391-680; P < .001) compared to controls.
Conclusions and clinical importance: Hypercoagulability was common in both dogs with SARDS and controls, but dogs with SARDS were significantly more hypercoagulable on TEG. The role of hypercoagulability in the pathogenesis of SARDS remains to be determined.
Keywords: SARDS; coagulation; fibrinogen; hypercoagulability.
© 2023 The Authors. Journal of Veterinary Internal Medicine published by Wiley Periodicals LLC on behalf of American College of Veterinary Internal Medicine.
Conflict of interest statement
Authors declare no conflict of interest.
Figures
References
-
- Stuckey JA, Pearce JW, Giuliano EA, et al. Long‐term outcome of sudden acquired retinal degeneration syndrome in dogs. J Am Vet Med Assoc. 2013;243:1425‐1431. - PubMed
-
- Komaromy AM, Abrams KL, Heckenlively JR, et al. Sudden acquired retinal degeneration syndrome (SARDS) – a review and proposed strategies toward a better understanding of pathogenesis, early diagnosis, and therapy. Vet Ophthalmol. 2016;19:319‐331. - PubMed
-
- Heller AR, van der Woerdt A, Gaarder JE, et al. Sudden acquired retinal degeneration in dogs: breed distribution of 495 canines. Vet Ophthalmol. 2017;20:103‐106. - PubMed
-
- Mowat FM, Avelino J, Bowyer A, et al. Detection of circulating anti‐retinal antibodies in dogs with sudden acquired retinal degeneration syndrome using indirect immunofluorescence: a case‐control study. Exp Eye Res. 2020;193:107989. - PubMed
-
- Braus BK, Hauck SM, Amann B, et al. Neuron‐specific enolase antibodies in patients with sudden acquired retinal degeneration syndrome. Vet Immunol Immunopathol. 2008;124:177‐183. - PubMed
MeSH terms
Substances
Grants and funding
LinkOut - more resources
Full Text Sources
