. 2023 Jun 27;14(3):e0025023.
doi: 10.1128/mbio.00250-23. Epub 2023 Apr 19.

Generation and Functional Analysis of Defective Viral Genomes during SARS-CoV-2 Infection

Affiliations

Generation and Functional Analysis of Defective Viral Genomes during SARS-CoV-2 Infection

Terry Zhou et al. mBio. .

Abstract

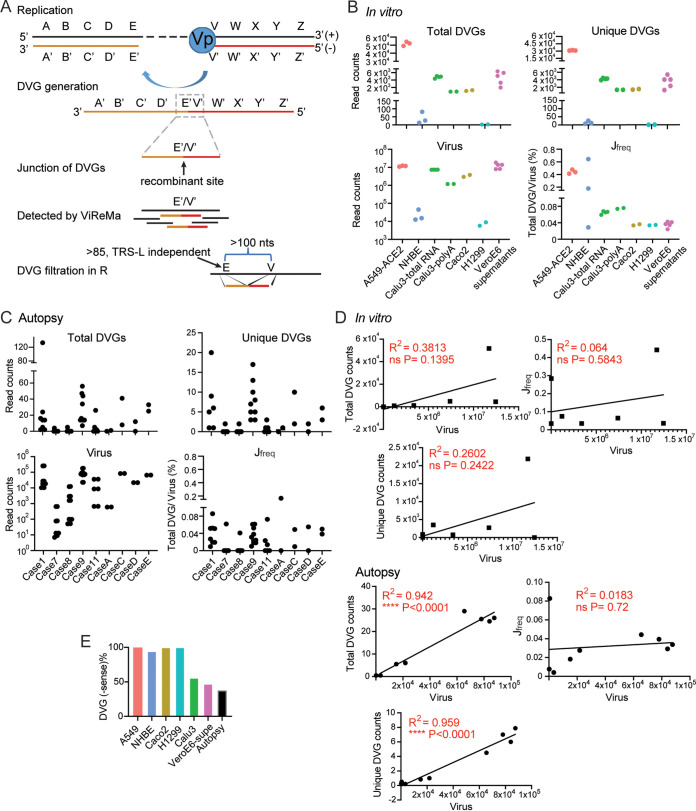
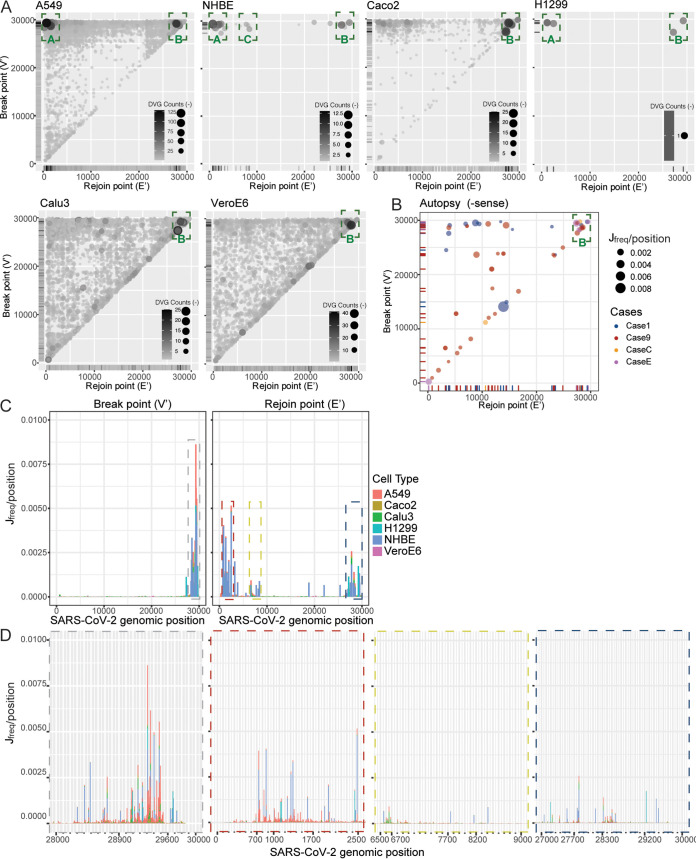
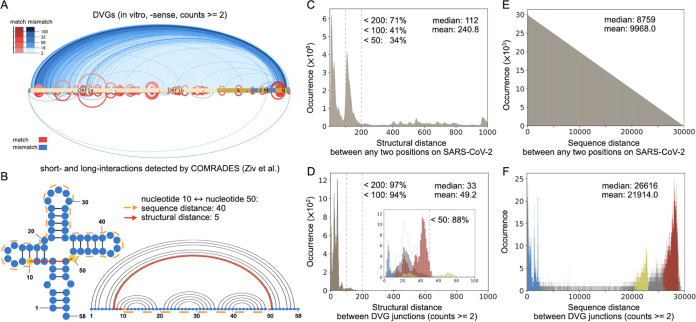
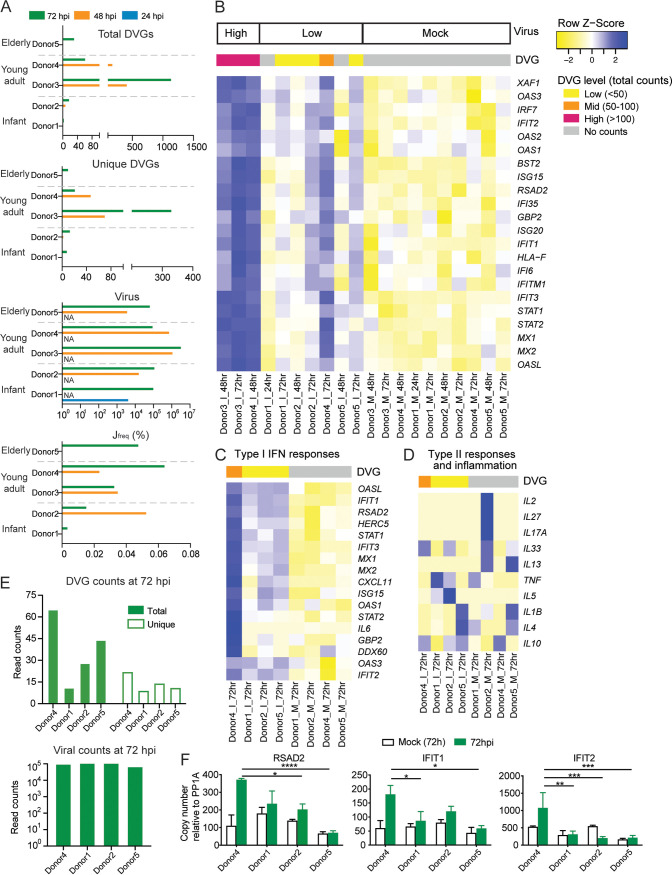
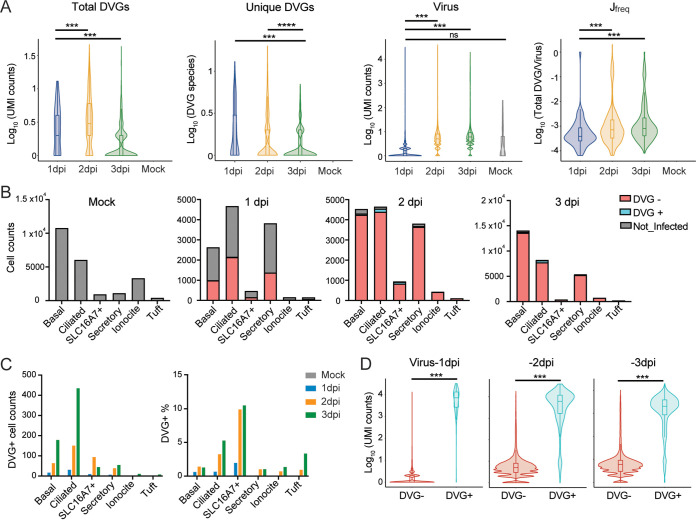
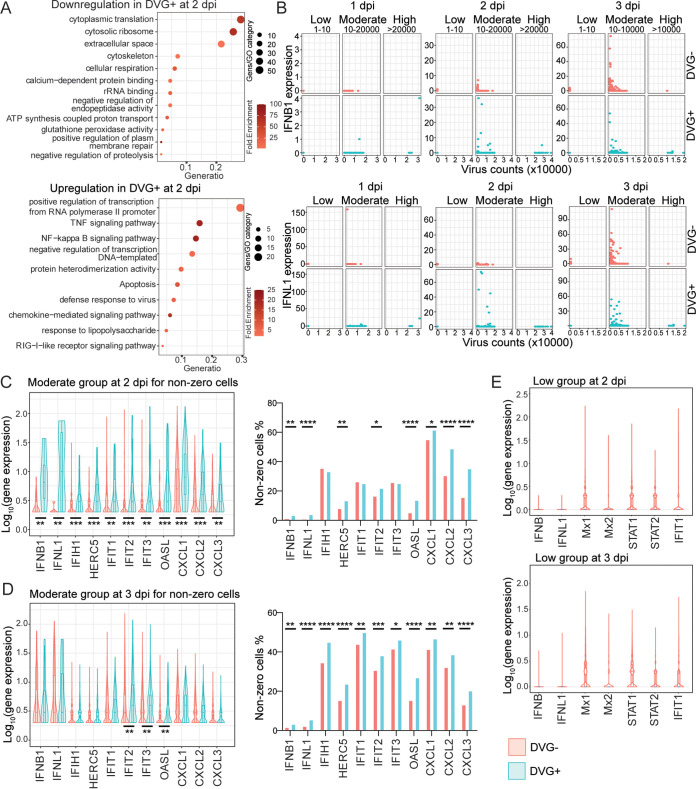
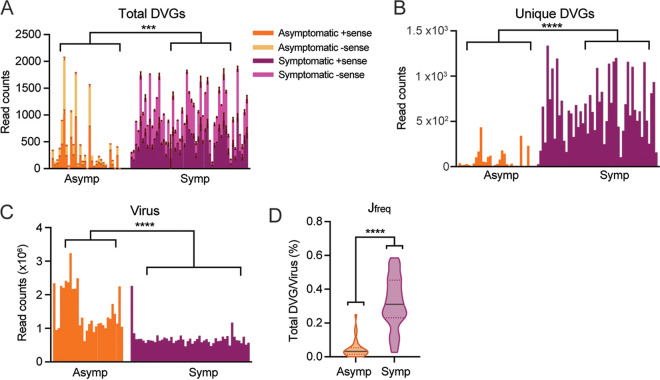
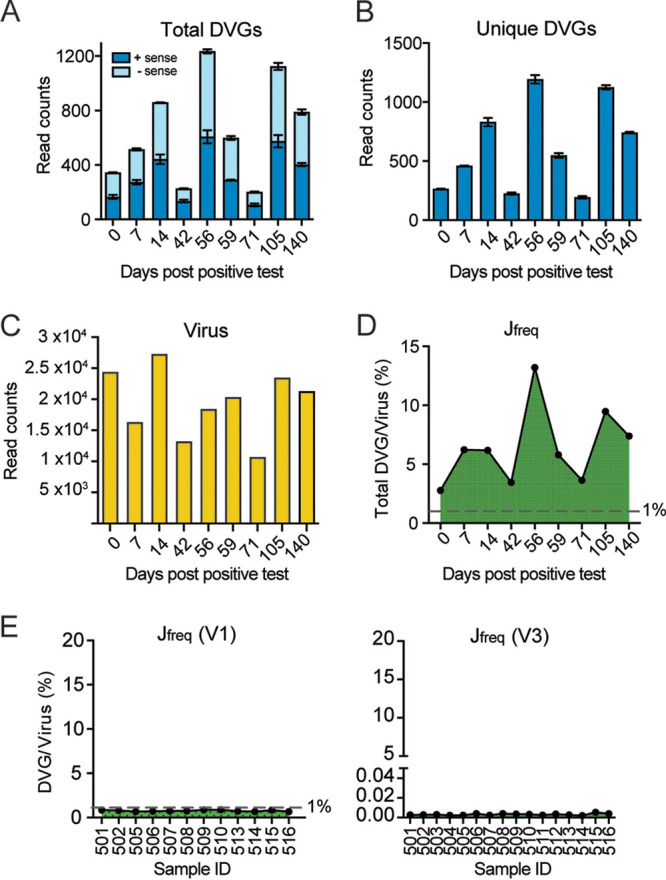
Defective viral genomes (DVGs) have been identified in many RNA viruses as a major factor influencing antiviral immune response and viral pathogenesis. However, the generation and function of DVGs in SARS-CoV-2 infection are less known. In this study, we elucidated DVG generation in SARS-CoV-2 and its relationship with host antiviral immune response. We observed DVGs ubiquitously from transcriptome sequencing (RNA-seq) data sets of in vitro infections and autopsy lung tissues of COVID-19 patients. Four genomic hot spots were identified for DVG recombination, and RNA secondary structures were suggested to mediate DVG formation. Functionally, bulk and single-cell RNA-seq analysis indicated the interferon (IFN) stimulation of SARS-CoV-2 DVGs. We further applied our criteria to the next-generation sequencing (NGS) data set from a published cohort study and observed a significantly higher amount and frequency of DVG in symptomatic patients than those in asymptomatic patients. Finally, we observed exceptionally diverse DVG populations in one immunosuppressive patient up to 140 days after the first positive test of COVID-19, suggesting for the first time an association between DVGs and persistent viral infections in SARS-CoV-2. Together, our findings strongly suggest a critical role of DVGs in modulating host IFN responses and symptom development, calling for further inquiry into the mechanisms of DVG generation and into how DVGs modulate host responses and infection outcome during SARS-CoV-2 infection. IMPORTANCE Defective viral genomes (DVGs) are generated ubiquitously in many RNA viruses, including SARS-CoV-2. Their interference activity to full-length viruses and IFN stimulation provide the potential for them to be used in novel antiviral therapies and vaccine development. SARS-CoV-2 DVGs are generated through the recombination of two discontinuous genomic fragments by viral polymerase complex, and this recombination is also one of the major mechanisms for the emergence of new coronaviruses. Focusing on the generation and function of SARS-CoV-2 DVGs, these studies identify new hot spots for nonhomologous recombination and strongly suggest that the secondary structures within viral genomes mediate the recombination. Furthermore, these studies provide the first evidence for IFN stimulation activity of de novo DVGs during natural SARS-CoV-2 infection. These findings set up the foundation for further mechanism studies of SARS-CoV-2 recombination and provide evidence to harness the immunostimulatory potential of DVGs in the development of a vaccine and antivirals for SARS-CoV-2.

Keywords: RNA secondary structure; SARS-CoV-2; defective viral genomes; human epithelial cells; recombination; secondary structure; type I/III IFN responses.


Conflict of interest statement

The authors declare no conflict of interest.

Figures

FIG 1
FIG 1
DVGs were generated ubiquitously in SARS-CoV-2 in vitro infections and autopsy tissues of COVID-19 patients. (A) Schematic representation of DVG generation from a positive-sense viral genome and the general principle of ViReMa identification of deletion DVGs. The V’ site represents the breakpoint and the E’ site represents the rejoin point of the viral polymerase in the formation of DVGs. The gray dashed box marks the recombinant site that distinguishes DVGs from full-length viral genomes, which are identified by ViReMa and further filtered using two criteria shown in the graph. (B) The respective total and unique DVG read counts, viral read counts, and Jfreq percentages were graphed for each of the in vitro samples, including the infected cells and supernatants. (C) The respective total and unique DVG read counts, viral read counts, and Jfreq percentages were graphed for autopsy lung tissues of 9 DVG+ COVID-19 patients. Each case represents one patient, and different dots represent RNA-seq from different locations of the same lung tissues. (D) The correlations between total DVG counts, unique DVG counts, Jfreq, and viral read counts were plotted for in vitro and autopsy samples. ****, P < 0.0001 by Pearson’s correlation. (E) The percentages of −sense DVGs among total DVGs in in vitro and autopsy samples were shown.
FIG 2
FIG 2
Four genomic hot spots were identified for DVG formation. Break point (V’) and rejoin point (E’) distributions for −sense DVGs from in vitro samples (A) and autopsy samples (B). Circle size and color intensity indicated the DVG counts for in vitro infection and Jfreq for autopsy samples. The green dashed boxes represented hot spots clustered with DVG junctions. (C) Breakpoint (V’) and rejoin point (E’) distributions by Jfreq per position for all in vitro samples. The dashed boxes indicated hot spots with high concentrations of break or rejoin points. The width of each bar represented 300 nt. (D) Detailed positions of 4 identified hot spots are clustered with DVG breakpoints and rejoin points. The color of the dashed outline around each graph indicated the corresponding hot spot with the same color in C. The width of each bar represented 10 nt.
FIG 3
FIG 3
The correlation between DVGs and secondary structures. (A) Comparison between DVG junction positions (top, in vitro, −sense DVGs) and chimeric reads from COMRADES (bottom) along the full-length SARS-CoV-2 genome (45). The red arches represented DVG positions that match COMRADES cross-links, and the blue arches represented positions that do not match cross-links. (B) Example that compared sequence distance and structural distance. The structural distance between nucleotides 10 to 50 is only 5 (red solid path that includes a connection across a base pair), while the sequence distance is 40 (orange dashed path). (C and D) The distribution of all structural distances between any two positions in SARS-CoV-2 (C) and between SARS-CoV-2 DVG junction positions (D). The percentages of distances less than 50, 100, and 200 were indicated. (E and F) As a negative control, the distribution of all sequence distances between any two positions in SARS-CoV-2 (E) and between SARS-CoV-2 DVG junction positions (F). The mean and median distances of all distributions were annotated in C to F. In D and F, the blue, yellow, and red bars corresponded to three hot spots annotated in Fig. 2C, while the gray bars were out of the range of these detected hot spots. The inset in D distinguished the structural distance distributions of three hot spots and the rest up to a structural distance of 100. The dashed contour in the inset represented the sum of all distributions for the same structural distance, and it was with the same shape as the major figure in D. In both C and E, the total occurrence of all distances equals the number of any two positions along SARS-CoV-2, and in D and F, the total occurrence of all distances is the same as the number of DVG data points (with counts 2 or above).
FIG 4
FIG 4
DVGs influence type I/III interferon responses in infected PHLE cells. PHLE cells of donors from different age groups were infected with SARS-CoV-2 at an MOI of 5. Samples were harvested at designated time points postinfection. (A) Viral read counts, total and unique DVG read counts, and Jfreq were graphed for all samples and grouped by donor age group and time points. NA indicated that the samples were not available for RNA-seq and thus no data were collected. (B) Differential expression levels of genes related to type I interferon responses were graphed as a heatmap for all infected samples. Samples were grouped by viral infection level. The following DVG levels of each sample were indicated by different color codes on top of the heatmap: low DVG level (<50 total read counts), mid (50 to 100), and high (>100). (C and D) Four infected samples at 72 hpi with a similar level of viral counts were selected to compare their IFN responses (C) and other gene expression unrelated to type I/III IFN responses (D). (E) Viral read counts and total and unique DVG read counts for the selected 4 infected samples at 72 hpi were graphed. (F) The expression level of RSAD2, IFIT1, and IFIT2 from those 4 selected samples at 72 hpi were further confirmed by qPCR. ****, P < 0.0001; ***, P < 0.001; **, P < 0.01; *, P < 0.05; by two-way analysis of variance (ANOVA) followed by Turkey’s multiple-comparison test.
FIG 5
FIG 5
DVG generation in infected PHLE cells from the single-cell level. (A) Violin plots of log-transformed viral UMI counts; total and unique DVG UMI counts; and Jfreq for 1 dpi, 2 dpi, 3 dpi, and mock samples. (B) Bar plots of cell counts of uninfected cells, DVG infected cells, and DVG+ cells within different cell types for mock, 1 dpi, 2 dpi, 3 dpi samples. Infected cells were cells with viral UMI over 1, and DVG+ cells were the ones with DVG UMI over 1. All DVG+ cells had at least 1 viral UMI. (C) Bar plots of DVG+ cell counts and DVG+ percentages per cell type for mock, 1 dpi, 2 dpi, and 3 dpi samples. (D) Violin plots of log-transformed viral counts for DVG+ and DVG virus-positive cells. ***, P < 0.01; ****, P < 0.001; by two-sided Wilcoxon signed-rank test.
FIG 6
FIG 6
DVG+ cells expressed primary IFNs earlier than DVG cells. (A) Gene Ontology analysis of genes that were downregulated (top) and upregulated (bottom) in DVG+ cells relative to DVG cells at 2 dpi. Circle size represented the number of genes in each pathway. Gene ratio represented the ratio of number of genes in that pathway to the number of genes in the entire cluster. (B) Gene expression of IFNB1 and IFNL1 (y axis) was correlated with viral UMI level (x axis) within each virus count group. Virus groups with their counts criteria were indicated on top of the graph. Each dot represented individual cells, and they were colored based on their presence of DVGs. (C and D) In the moderate virus group, the expression level of IFNB, IFNL1, selected ISGs, and chemokines for nonzero (gene counts, >0) cells and the percentage of nonzero cells within DVG+ and DVG groups were compared and graphed at 2 dpi (C) and 3 dpi (D). Two-sided Wilcoxon signed-rank test and Fisher’s exact test were used to compare the gene expression level and nonzero cell percentage between DVG and DVG+ groups, respectively; ****, P < 0.0001; ***, P < 0.001; **, P < 0.01; *, P < 0.05. (E) Expression level of IFNB, IFNL1, and selected ISGs for DVG cells within the low virus group at 2 dpi and 3 dpi were graphed as violin plots.
FIG 7
FIG 7
Symptomatic COVID-19 patients had a larger amount of and larger Jfreq of SARS-CoV-2 DVGs than asymptomatic patients. Samples of various collection methods, including nasopharyngeal (n = 42), anterior nasal (n = 35), and oropharyngeal (n = 5), were used from NGS data set PRJNA690577. Symptomatic samples (n = 51) were collected from patients presented at the hospital with symptoms consistent with COVID-19, while asymptomatic samples (n = 30) were collected from patients who did not have symptoms consistent with COVID-19 and were found through contact tracing and workforce screening. Total DVG read counts (A), unique DVG read counts (B), viral read counts (C), and Jfreq (D) percentages were calculated and graphed for all symptomatic and asymptomatic samples. ****, P < 0.0001; ***, P < 0.001; by two-sided Mann-Whitney U test.
FIG 8
FIG 8
High DVG Jfreq was observed in one SARS-CoV-2-persistent patient. Nasal samples were collected from one immunosuppressive patient with persistent viral infection at 9 different time points after the patient first tested positive for COVID-19. DVGs were identified from the NGS data set (ERP132087/PRJEB47786) of the nasal samples from this patient. Total DVG read counts (A), unique DVG read counts (B), viral read counts (C), and Jfreq (D) percentages were calculated and graphed for samples at each time point. (E) Jfreq of samples in another NGS data set (PRJNA707211) utilizing the same amplification and sequencing methods demonstrated a much smaller Jfreq than that of the SARS-CoV-2-persistent patient, which was comparable to Jfreq levels found SARS-CoV-2-infected in vitro and autopsy samples. As this NGS is paired end, R1 and R2 were treated as duplicates and error bars stand for mean ± SD.

Update of

Comment in

Similar articles

Cited by

References

    1. Lega S, Naviglio S, Volpi S, Tommasini A. 2020. Recent insight into SARS-CoV2 immunopathology and rationale for potential treatment and preventive strategies in COVID-19. Vaccines (Basel) 8:224. doi:10.3390/vaccines8020224. - DOI - PMC - PubMed
    1. Chiale C, Greene TT, Zuniga EI. 2022. Interferon induction, evasion, and paradoxical roles during SARS-CoV-2 infection. Immunol Rev 309:12–24. doi:10.1111/imr.13113. - DOI - PMC - PubMed
    1. Dadras O, Afsahi AM, Pashaei Z, Mojdeganlou H, Karimi A, Habibi P, Barzegary A, Fakhfouri A, Mirzapour P, Janfaza N, Dehghani S, Afroughi F, Dashti M, Khodaei S, Mehraeen E, Voltarelli F, Sabatier JM, SeyedAlinaghi S. 2022. The relationship between COVID-19 viral load and disease severity: a systematic review. Immun Inflamm Dis 10:e580. doi:10.1002/iid3.580. - DOI - PMC - PubMed
    1. Gozman L, Perry K, Nikogosov D, Klabukov I, Shevlyakov A, Baranova A. 2021. A role of variance in interferon genes to disease severity in COVID-19 patients. Front Genet 12:709388. doi:10.3389/fgene.2021.709388. - DOI - PMC - PubMed
    1. Janssen NAF, Grondman I, de Nooijer AH, Boahen CK, Koeken V, Matzaraki V, Kumar V, He X, Kox M, Koenen H, Smeets RL, Joosten I, Brüggemann RJM, Kouijzer IJE, van der Hoeven HG, Schouten JA, Frenzel T, Reijers MHE, Hoefsloot W, Dofferhoff ASM, van Apeldoorn MJ, Blaauw MJT, Veerman K, Maas C, Schoneveld AH, Hoefer IE, Derde LPG, van Deuren M, van der Meer JWM, van Crevel R, Giamarellos-Bourboulis EJ, Joosten LAB, van den Heuvel MM, Hoogerwerf J, de Mast Q, Pickkers P, Netea MG, van de Veerdonk FL. 2021. Dysregulated innate and adaptive immune responses discriminate disease severity in COVID-19. J Infect Dis 223:1322–1333. doi:10.1093/infdis/jiab065. - DOI - PMC - PubMed

Publication types