. 2023 Jan-Dec;15(1):2202593.
doi: 10.1080/19490976.2023.2202593.

Intestinal vitamin D receptor protects against extraintestinal breast cancer tumorigenesis

Affiliations

Intestinal vitamin D receptor protects against extraintestinal breast cancer tumorigenesis

Yong-Guo Zhang et al. Gut Microbes. 2023 Jan-Dec.

Abstract

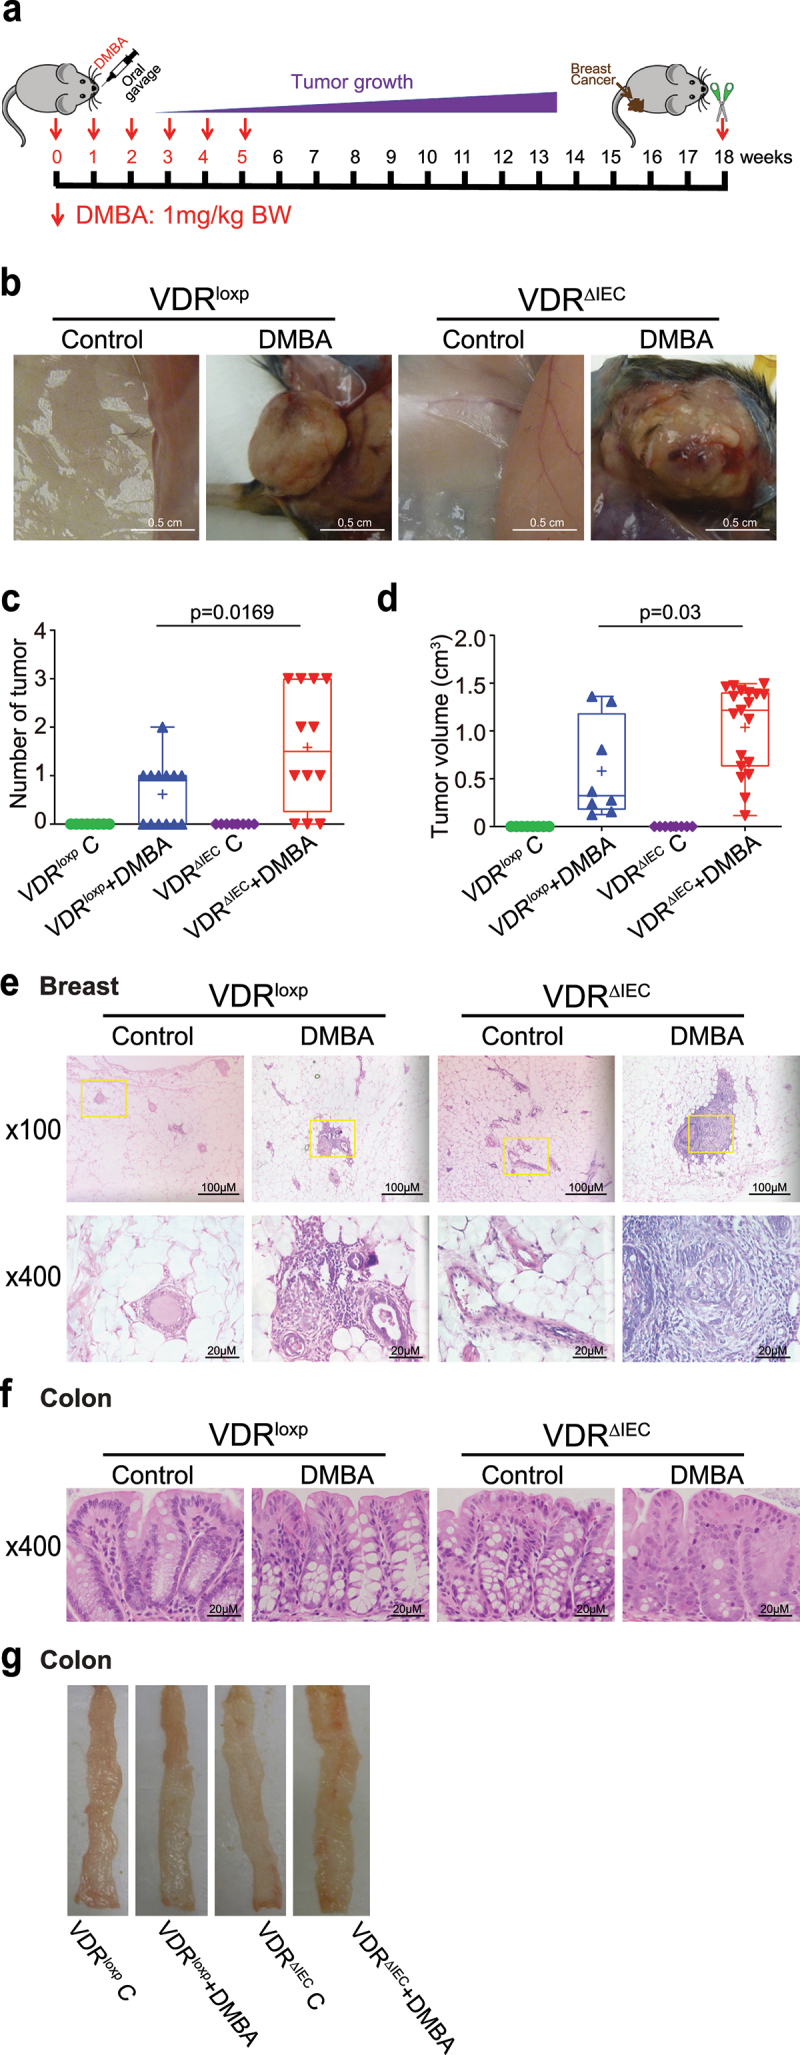
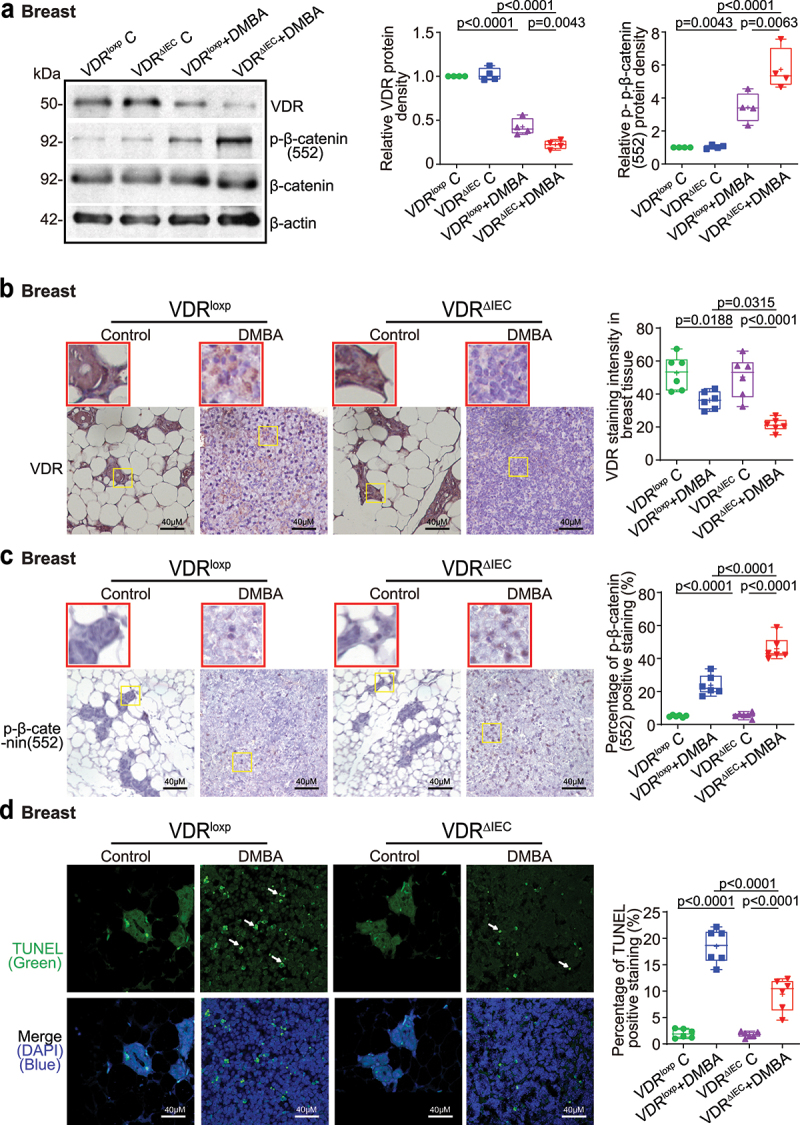
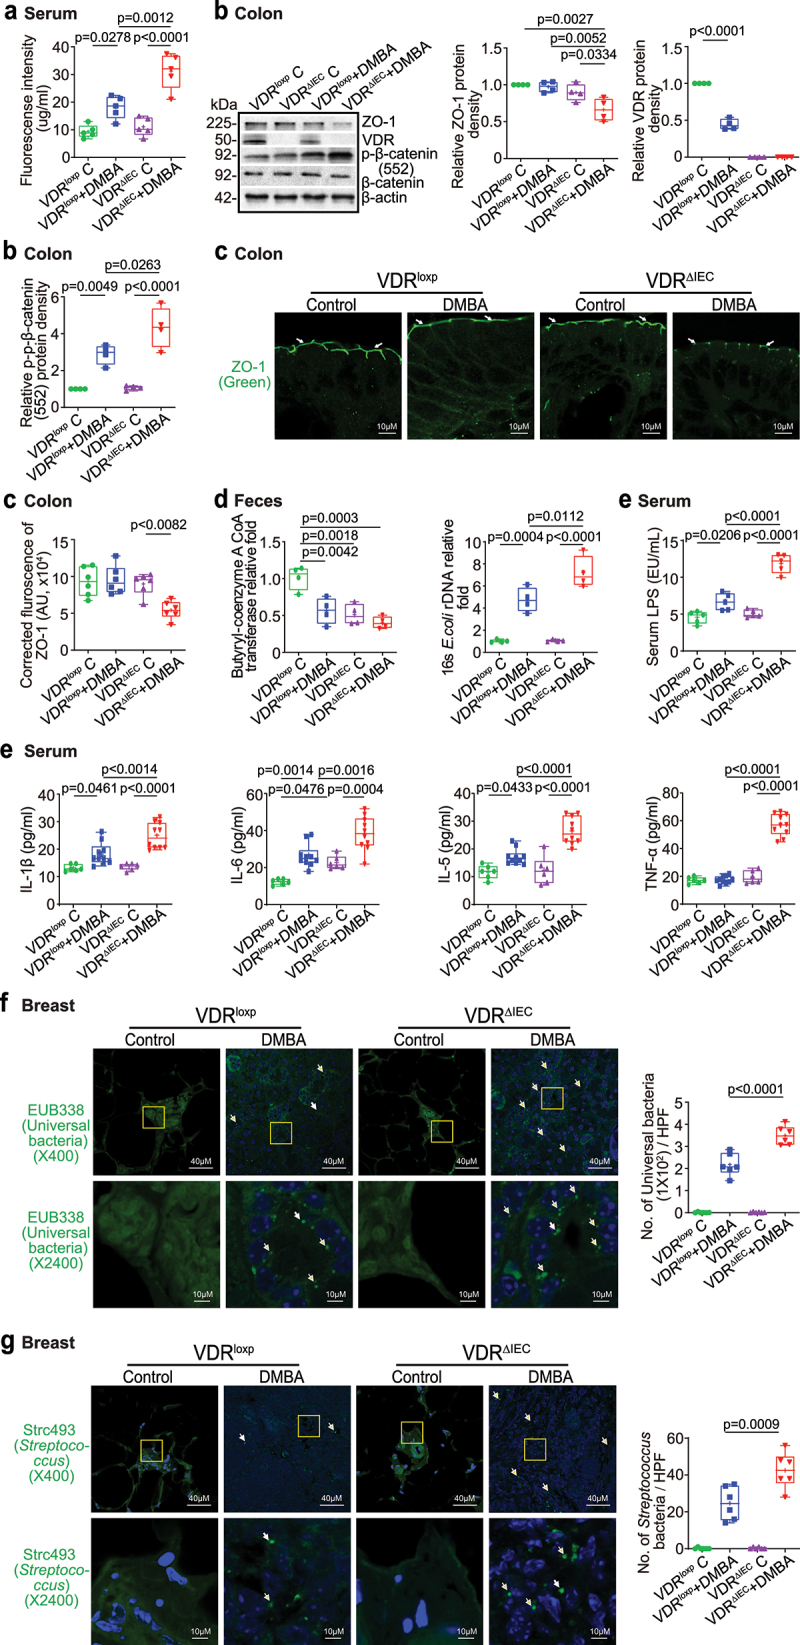
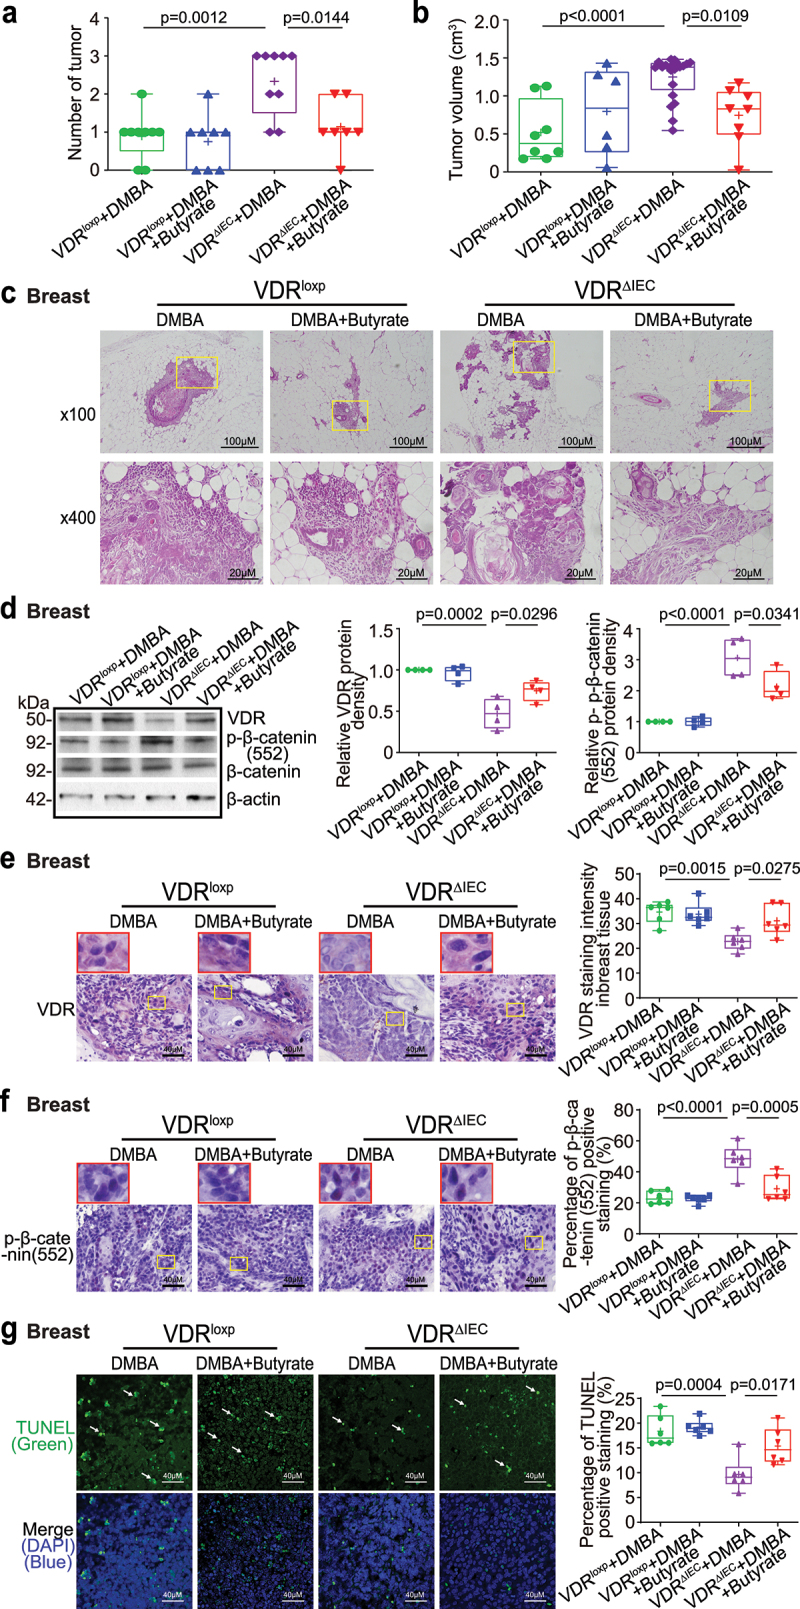
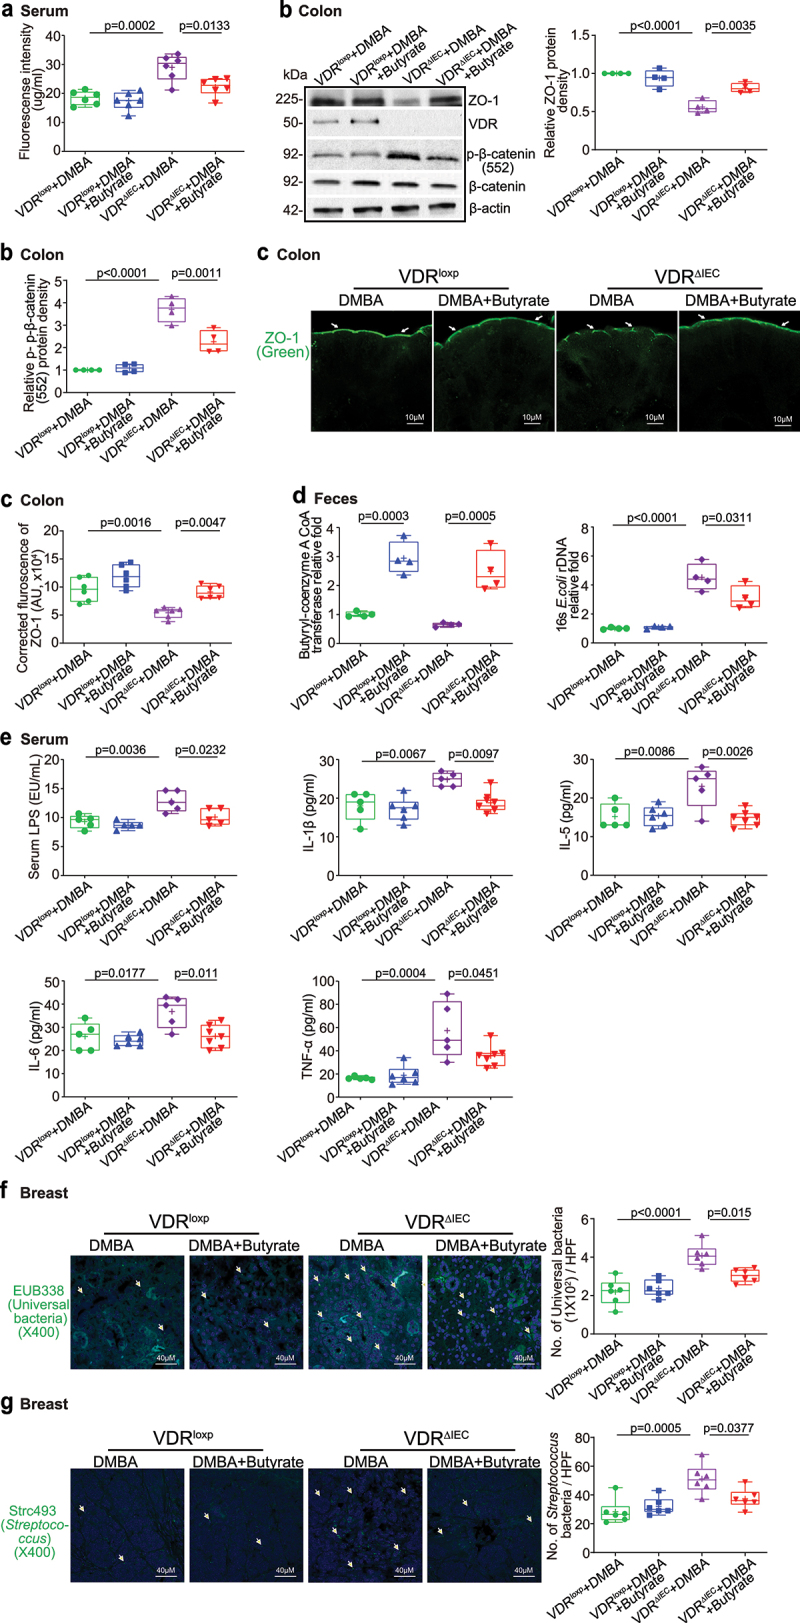
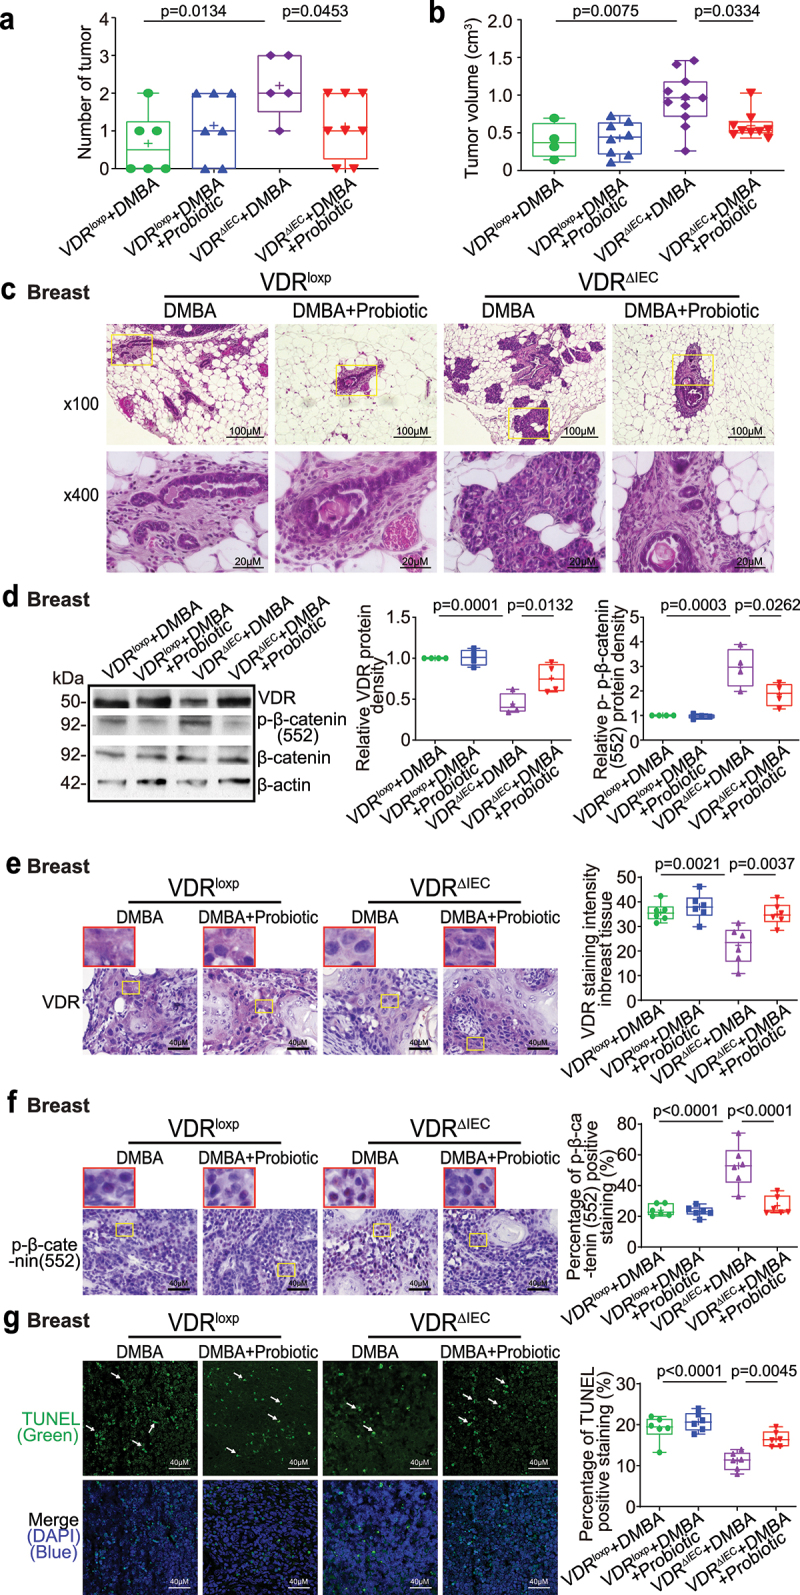
The microbiota plays critical roles in regulating the function and health of the intestine and extraintestinal organs. A fundamental question is whether an intestinal-microbiome-breast axis exists during the development of breast cancer. If so, what are the roles of host factors? Vitamin D receptor (VDR) involves host factors and the human microbiome. Vdr gene variation shapes the human microbiome, and VDR deficiency leads to dysbiosis. We hypothesized that intestinal VDR protects hosts against tumorigenesis in the breast. We examined a 7,12-dimethylbenzanthracene (DMBA)-induced breast cancer model in intestinal epithelial VDR knockout (VDRΔIEC) mice with dysbiosis. We reported that VDRΔIEC mice with dysbiosis are more susceptible to breast cancer induced by DMBA. Intestinal and breast microbiota analysis showed that VDR deficiency leads to a bacterial profile shift from normal to susceptible to carcinogenesis. We found enhanced bacterial staining within breast tumors. At the molecular and cellular levels, we identified the mechanisms by which intestinal epithelial VDR deficiency led to increased gut permeability, disrupted tight junctions, microbial translocation, and enhanced inflammation, thus increasing tumor size and number in the breast. Furthermore, treatment with the beneficial bacterial metabolite butyrate or the probiotic Lactobacillus plantarum reduced breast tumors, enhanced tight junctions, inhibited inflammation, increased butyryl-CoA transferase, and decreased levels of breast Streptococcus bacteria in VDRΔIEC mice. The gut microbiome contributes to the pathogenesis of diseases not only in the intestine but also in the breast. Our study provides insights into the mechanism by which intestinal VDR dysfunction and gut dysbiosis lead to a high risk of extraintestinal tumorigenesis. Gut-tumor-microbiome interactions represent a new target in the prevention and treatment of breast cancer.

Keywords: Dysbiosis; Lactobacillus plantarum; VDR; barrier function; breast cancer; butyrate; butyrate-producing bacteria; gut-breast-axis; inflammation; probiotics; tight junctions.


Conflict of interest statement

No potential conflict of interest was reported by the author(s).

Figures

Figure 1.
Figure 1.
Altered taxonomic community of intestinal bacteria in VDRΔIEC mice compared with VDRloxp mice. (a) Relative bacterial abundances at the species level are shown for the top 10 species, and less abundant species were grouped as “others”. Each bar represents an individual mouse, n = 10 per group. (b) the presentive bacterial species that were markedly altered after intestinal VDR conditional deletion. The values of the Y-axis are based on operational taxonomic unit (OTU) counts, representing the sequence reads. Data are expressed as the mean ± SD, Welch’s t test, n = 10 each group. (c) Differential analysis of functional genes in the feces of conditional VDR-knockout mice. The KEGG MODULE database consists of KEGG modules identified by M numbers, which are manually defined functional units of gene sets. The KEGG Module ortholog table is a useful tool to check the completeness and consistency of genome annotations. It shows currently annotated genes in individual genomes for a given set of K numbers. Items with q-values≤0.05 in pairwise comparisons or butyrate-related items were selected. The fold-change (log2FC), counts per million (log2CPM), and q-value were colored using the key as indicated on the right side of the figure, n = 10 each group. All p values are shown in the figures.
Figure 2.
Figure 2.
VDRΔIEC mice developed larger and more breast tumors. (a) Schematic overview of the DMBA-induced breast cancer model. Mice were given 1.0 mg of DMBA in 0.2 ml of corn oil by oral gavage once a week for 6 weeks. The samples were harvested at week 18. (b) Breast tumors in situ. Representative mammary glands from different groups. (c) the number of breast tumors significantly increased in VDRΔIEC mice compared with VDRloxp mice. Data are expressed as the mean ± SD. N = 8–13, one-way ANOVA. (d) the breast tumor volumes were significantly larger in VDRΔIEC mice than in VDRloxp mice. Data are expressed as the mean ± SD. n = 8–13, one-way ANOVA. (e) Representative H&E staining of mammary glands from the indicated groups. Images were from a single experiment and are representative of 8–13 mice per group. (f) Representative H&E staining of intestines from the indicated groups. The images were from a single experiment and are representative of 8–13 mice per group. All p values are shown in the figures. (g) Representative photographs of colons from the indicated groups.
Figure 3.
Figure 3.
Intestinal epithelial VDR deletion led to decreased VDR expression, increased proliferation, and decreased apoptosis in breast tumor tissues. (a) Decreased VDR protein expression and increased p-β-catenin (Ser552) expression in mammary gland tumors of VDRΔIEC mice compared with VDRloxp mice. Data are expressed as the mean ± SD. N = 4, one-way ANOVA. (b) VDR was decreased in breast tumors of VDRΔIEC mice compared with VDRloxp mice by IHC staining. Images are from a single experiment and are representative of 6 mice per group. Red boxes indicate the selected area at higher magnification. (c) p-β-catenin (Ser552) expression increased in breast tissues of VDRΔIEC mice compared with VDRloxp mice by IHC staining. Images are from a single experiment and are representative of 6 mice per group. Red boxes indicate the selected area at higher magnification. (d) Apoptosis-positive cells were decreased in the breast tissue of VDRΔIEC mice compared with VDRloxp mice by TUNEL staining. Images are from a single experiment and are representative of 6 mice per group. All p values are shown in the figures.
Figure 4.
Figure 4.
Increased intestinal permeability, decreased ZO-1 expression, chronic inflammation and increased universal bacteria in breast tumors of VDRΔIEC mice compared with VDRloxp mice. (a) Intestinal permeability increased in the DMBA-induced VDRΔIEC breast cancer model. Fluorescein dextran (molecular weight 4 kDa, diluted in HBSS) was gavaged (50 mg/kg mouse). Four hours later, mouse blood samples were collected for fluorescence intensity measurement. Data are expressed as the mean ± SD. N = 5, one-way ANOVA. (b) ZO-1 expression decreased in the intestine of VDRΔIEC mice after DMBA treatment compared with VDRloxp mice. The expression of p-β-catenin (552) increased in the colon of VDRΔIEC mice after DMBA treatment compared with VDRloxp mice. Data are expressed as the mean ± SD; n = 4, one-way ANOVA. (c) ZO-1 expression decreased in intestinal VDRΔIEC mice after DMBA treatment compared with VDRloxp mice by IF staining. Images are from a single experiment and are representative of 6 mice per group. Data are expressed as the mean ± SD. N = 6, one-way ANOVA. (d) Lack of intestinal VDR led to dysbiosis and a shift in the bacterial profile. Expression of butyryl-coenzyme a CoA transferase decreased in control tissue and in tumors in VDRΔIEC mice compared to VDRloxp mice. E. coli was enhanced in tumors in VDRΔIEC mice compared to VDRloxp mice. Data are expressed as the mean ± SD. N = 4, one-way ANOVA. (e) Serum LPS, IL-1β, IL-6, IL-5, and TNF-α were significantly higher in tumors in VDRΔIEC mice than in VDRloxp mice. Serum samples were collected from VDRloxp and VDRΔIEC mice with or without tumors, and cytokines were detected by a Luminex detection system. Data are expressed as the mean ± SD. N = 6–10, one-way ANOVA. (f) More universal bacteria in the breast tumor tissue of VDRΔIEC mice were found by fluorescence in situ hybridization. Images are from a single experiment and are representative of 6 mice per group. Data are expressed as the mean ± SD. N = 6, one-way ANOVA. All p values are shown in the figures. (g) More Streptococcus bacteria in the breast tumor tissue of VDRΔIEC mice were found by fluorescence in situ hybridization. Images are from a single experiment and are representative of 6 mice per group. Data are expressed as the mean ± SD. N = 6, one-way ANOVA. All p values are shown in the figures.
Figure 5.
Figure 5.
Butyrate-treated VDRΔIEC mice had fewer and smaller tumors, increased breast VDR expression, decreased breast p-β-catenin (552) expression, and increased cell apoptosis. (a) the number of breast tumors significantly decreased in VDRΔIECmice treated with butyrate. Data are expressed as the mean ± SD. N = 7–9, one-way ANOVA. (b) the breast tumor volumes were significantly smaller in VDRΔIECmice treated with butyrate. Data are expressed as the mean ± SD. N = 7–9, one-way ANOVA. (c) Representative H&E staining of mammary glands from the indicated groups. Images are from a single experiment and are representative of 7–9 mice per group. (d) VDR expression increased, while p-β-catenin (Ser552) expression decreased in breast tumor tissue in VDRΔIEC mice treated with butyrate. Data are expressed as the mean ± SD; N = 4, one-way ANOVA. (e) VDR was increased in breast tumor tissue in VDRΔIEC mice treated with butyrate, as shown by IHC staining. Images are from a single experiment and are representative of 6 mice per group. Red boxes indicate the selected area at higher magnification. Data are expressed as the mean ± SD. N = 6, one-way ANOVA. (f) P-β-catenin (Ser552) expression decreased in breast tumor tissue in VDRΔIEC mice treated with butyrate, as shown by IHC staining. Images are from a single experiment and are representative of 6 mice per group. Red boxes indicate the selected area at higher magnification. Data are expressed as the mean ± SD. N = 6, one-way ANOVA. (g) Apoptosis-positive cells were decreased in the breast tumor tissue of VDRΔIECmice treated with butyrate, as shown by TUNEL staining. Images are from a single experiment and are representative of 6 mice per group. Data are expressed as the mean ± SD. N = 6, one-way ANOVA. All p values are shown in the figures.
Figure 6.
Figure 6.
Butyrate treatment decreased intestinal permeability, increased intestinal ZO-1 expression, and decreased inflammation in VDRΔIEC mice. (a) Intestinal permeability decreased in VDRΔIEC mice treated with butyrate. Data are expressed as the mean ± SD. N = 6, one-way ANOVA. (b) ZO-1 expression increased and p-β-catenin (552) expression decreased in the intestine of VDRΔIEC mice treated with butyrate. Data are expressed as the mean ± SD. N = 4, one-way ANOVA. (c) ZO-1 expression increased in VDRΔIEC mice treated with butyrate, as determined by IF staining. Images are from a single experiment and are representative of 6 mice per group. Data are expressed as the mean ± SD. N = 6, one-way ANOVA. (d) Butyrate treatment increased butyryl-coenzyme a CoA transferase genes and decreased E. coli in the VDRΔIEC mice treated with butyrate. Data are expressed as the mean ± SD. N = 4, one-way ANOVA. (e) Butyrate treatment protected against increased inflammation in VDRΔIEC mice. Serum LPS, IL-1β, IL-5, IL-6, and TNF-α were significantly lower in VDRΔIEC mice treated with butyrate. Data are expressed as the mean ± SD. N = 5–7, one-way ANOVA. All p values are shown in the figures. (f) Less universal bacteria in breast tumor tissue of VDRΔIEC mice with butyrate treatment were found by fluorescence in situ hybridization. Images are from a single experiment and are representative of 6 mice per group. Data are expressed as the mean ± SD. N = 6, one-way ANOVA. All p values are shown in the figures. (g) Less Streptococcus bacteria in breast tumor tissue of VDRΔIEC mice with butyrate treatment were found by fluorescence in situ hybridization. Images are from a single experiment and are representative of 6 mice per group. Data are expressed as the mean ± SD. N = 6, one-way ANOVA. All p values are shown in the figures..
Figure 7.
Figure 7.
Probiotic-treated VDRΔIEC mice have fewer and smaller tumors, increased breast VDR expression, decreased expression of p-β-catenin (552), and increased cell apoptosis. (a) the number of breast tumors significantly decreased in the probiotic-treated VDRΔIEC mice. Data are expressed as the mean ± SD. N = 5–8, unpaired t test. (b) the volume of breast tumors was significantly smaller in the probiotic-treated VDRΔIEC mice. Data are expressed as the mean ± SD. N = 5–8, one-way ANOVA. (c) Representative H&E staining of mammary glands from the indicated groups. Images are from a single experiment and are representative of 6–8 mice per group. (d) VDR expression was increased, while p-β-catenin (552) expression was decreased in breast tumor tissue in the probiotic-treated VDRΔIEC mice. Data are expressed as the mean ± SD. N = 4, one-way ANOVA. (e) VDR was increased in breast tumor tissue in VDRΔIEC mice treated with probiotics, as shown by IHC staining. Images are from a single experiment and are representative of 6 mice per group. Red boxes indicate the selected area at higher magnification. Data are expressed as the mean ± SD. N = 6, one-way ANOVA. (f) P-β-catenin (552) expression decreased in breast tumor tissue in VDRΔIEC mice with probiotic treatment, as shown by IHC staining. Images are from a single experiment and are representative of 6 mice per group. Red boxes indicate the selected area at higher magnification. Data are expressed as the mean ± SD. N = 6, one-way ANOVA. (g) Apoptosis-positive cells were decreased in breast tumors of VDRΔIEC mice with probiotic treatment by TUNEL staining. Images are from a single experiment and are representative of 6 mice per group. Data are expressed as the mean ± SD. N = 6, one-way ANOVA. All p values are shown in the figures.
Figure 8.
Figure 8.
Probiotic-treated VDRΔIEC mice had decreased intestinal permeability, increased intestinal ZO-1 expression, and corrected dysbiosis and were protected against increased inflammation. (a) Intestinal permeability decreased in VDRΔIEC mice treated with probiotics. Data are expressed as the mean ± SD. N = 5, one-way ANOVA. (b) ZO-1 expression increased in the intestine of VDRΔIEC mice with probiotic treatment. Colonic p-β-catenin (552) expression decreased in the VDRΔIEC mice with probiotic treatment. Data are expressed as the mean ± SD. N = 4, one-way ANOVA. (c) ZO-1 expression increased in VDRΔIEC mice treated with probiotics, as shown by immunofluorescence staining. Images are from a single experiment and are representative of 6 mice per group. Data are expressed as the mean ± SD. N = 6, one-way ANOVA. (d) Probiotic treatment increased butyryl-CoA transferase genes and decreased E. coli in VDRΔIEC mice. Data are expressed as the mean ± SD. N = 4, one-way ANOVA. (e) Probiotic treatment protected against increased inflammation in VDRΔIEC mice. Serum LPS, IL-1β, IL-5, IL-6, and TNF-α were significantly lower in VDRΔIEC mice treated with probiotics. Data are expressed as the mean ± SD. N = 5–6, one-way ANOVA. All p values are shown in the figures. (f) Less universal bacteria in breast tumor tissue of VDRΔIEC mice with probiotic treatment were found by fluorescence in situ hybridization. Images are from a single experiment and are representative of 6 mice per group. Data are expressed as the mean ± SD. N = 6, one-way ANOVA. All p values are shown in the figures. (g) Less Streptococcus bacteria in breast tumor tissue of VDRΔIEC mice with probiotic treatment were found by fluorescence in situ hybridization. Images are from a single experiment and are representative of 6 mice per group. Data are expressed as the mean ± SD. N = 6, one-way ANOVA. All p values are shown in the figures.

Similar articles

Cited by

References

    1. Shang M, Sun J.. Vitamin D/VDR, Probiotics, and Gastrointestinal diseases. Curr Med Chem. 2017;24(9):876–23. doi:10.2174/0929867323666161202150008. - DOI - PMC - PubMed
    1. Sun J. Dietary vitamin D, vitamin D receptor, and microbiome. Current opinion in clinical nutrition and metabolic care. Curr Opin Clin Nutr Metab Care. 2018;21(6):471–474. doi:10.1097/MCO.0000000000000516. - DOI - PMC - PubMed
    1. Abreu MT, Kantorovich V, Vasiliauskas EA, Gruntmanis U, Matuk R, Daigle K, Chen S, Zehnder D, Lin YC, Yang H, et al. Measurement of vitamin D levels in inflammatory bowel disease patients reveals a subset of Crohn’s disease patients with elevated 1,25-dihydroxy vitamin D and low bone mineral density. Gut. 2004;53(8):1129–1136. doi:10.1136/gut.2003.036657. - DOI - PMC - PubMed
    1. Lim WC, Hanauer SB, Li YC. Mechanisms of disease: vitamin D and inflammatory bowel disease. Nat Clin Pract Gastroenterol Hepatol. 2005;2(7):308–315. doi:10.1038/ncpgasthep0215. - DOI - PubMed
    1. Sentongo TA, Semaeo EJ, Stettler N, Piccoli DA, Stallings VA, Zemel BS. Vitamin D status in children, adolescents, and young adults with Crohn disease. Am J Clin Nutr. 2002;76(5):1077–1081. doi:10.1093/ajcn/76.5.1077. - DOI - PubMed

Publication types

Substances