. 2023 Jun 27;14(3):e0010223.
doi: 10.1128/mbio.00102-23. Epub 2023 Apr 19.

Metabolic Consequences of Polyphosphate Synthesis and Imminent Phosphate Limitation

Affiliations

Metabolic Consequences of Polyphosphate Synthesis and Imminent Phosphate Limitation

Geun-Don Kim et al. mBio. .

Abstract

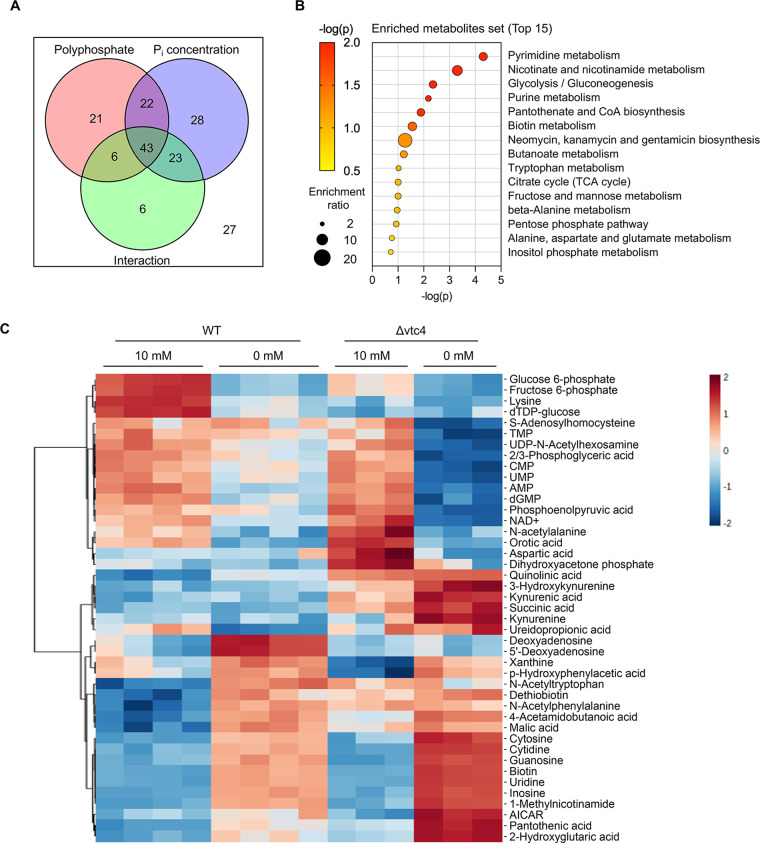
Cells stabilize intracellular inorganic phosphate (Pi) to compromise between large biosynthetic needs and detrimental bioenergetic effects of Pi. Pi homeostasis in eukaryotes uses Syg1/Pho81/Xpr1 (SPX) domains, which are receptors for inositol pyrophosphates. We explored how polymerization and storage of Pi in acidocalcisome-like vacuoles supports Saccharomyces cerevisiae metabolism and how these cells recognize Pi scarcity. Whereas Pi starvation affects numerous metabolic pathways, beginning Pi scarcity affects few metabolites. These include inositol pyrophosphates and ATP, a low-affinity substrate for inositol pyrophosphate-synthesizing kinases. Declining ATP and inositol pyrophosphates may thus be indicators of impending Pi limitation. Actual Pi starvation triggers accumulation of the purine synthesis intermediate 5-aminoimidazole-4-carboxamide ribonucleotide (AICAR), which activates Pi-dependent transcription factors. Cells lacking inorganic polyphosphate show Pi starvation features already under Pi-replete conditions, suggesting that vacuolar polyphosphate supplies Pi for metabolism even when Pi is abundant. However, polyphosphate deficiency also generates unique metabolic changes that are not observed in starving wild-type cells. Polyphosphate in acidocalcisome-like vacuoles may hence be more than a global phosphate reserve and channel Pi to preferred cellular processes. IMPORTANCE Cells must strike a delicate balance between the high demand of inorganic phosphate (Pi) for synthesizing nucleic acids and phospholipids and its detrimental bioenergetic effects by reducing the free energy of nucleotide hydrolysis. The latter may stall metabolism. Therefore, microorganisms manage the import and export of phosphate, its conversion into osmotically inactive inorganic polyphosphates, and their storage in dedicated organelles (acidocalcisomes). Here, we provide novel insights into metabolic changes that yeast cells may use to signal declining phosphate availability in the cytosol and differentiate it from actual phosphate starvation. We also analyze the role of acidocalcisome-like organelles in phosphate homeostasis. This study uncovers an unexpected role of the polyphosphate pool in these organelles under phosphate-rich conditions, indicating that its metabolic roles go beyond that of a phosphate reserve for surviving starvation.

Keywords: SPX domains; Saccharomyces cerevisiae; acidocalcisome; phosphate signalling; polyphosphate.


Conflict of interest statement

The authors declare no conflict of interest.

Figures

FIG 1
FIG 1
Response of S. cerevisiae under different Pi starving conditions. (A) Growth curves of yeast cells in synthetic complete medium supplemented with different concentrations of Pi from 10 mM to 0 mM. Cells were inoculated at an OD600 of 0.05 and cultured for 24 h. The means of triplicates are shown with standard deviation. (B) Acid phosphatase activities of yeast cells grown as in A. The means of triplicates are shown with standard deviation. (C) Concentrations of remaining Pi in the medium during cell growth. Pi concentration in the medium was monitored every 2 h for 8 h using the malachite green assay. The means of triplicates are shown with standard deviation; ***, P < 0.001; **, P < 0.01; *, P < 0.05; ns, not significant by Student’s t test; nd, not detected. (D) Fluorescence microscopy of live yeast cells producing Pho4 genomically tagged with GFP as the sole source of this protein. Cells were incubated for 8 h in 10 mM, 0.5 mM, and 0 mM Pi medium as in A before observation. (E and F) Relative gene expression levels of PHO5 (E) and PHO84 (F). Cells were grown in 10 mM, 0.5 mM, and 0 mM Pi medium for 8 h and harvested for RNA extraction and qRT-PCR. Fold change values were normalized with internal control TAF10. The means of three biological replicates are shown with standard deviation; ***, P < 0.001; **, P < 0.01; *, P < 0.05; ns, not significant by Student’s t test. (G) Polyphosphate levels in different Pi-containing medium. Cells were incubated for 8 h as in A and harvested for polyphosphate measurement. The means of triplicates are shown with standard deviation; ***, P < 0.001; **, P < 0.01; *, P < 0.05 by Student’s t test; a.u., arbitrary units.
FIG 2
FIG 2
Partial least-squares discriminant analysis (PLS-DA) of S. cerevisiae metabolites under different Pi conditions. (A) Score plot of PLS-DA. Red, green, and blue dots indicate the replicates of yeast metabolomic data incubated in 10 mM, 0.5 mM, and 0 mM Pi medium, respectively. The shaded regions represent the 95% confidence intervals. (B) Loading plot of PLS-DA. Red dots indicate Pi-containing metabolites. (C) Variable of importance in projection (VIP) scores of the top 20 metabolites generated from PLS-DA. The color code indicates the relative abundance of each metabolite under different Pi conditions.
FIG 3
FIG 3
Correlation analysis of S. cerevisiae metabolites under different Pi starving conditions. (A) Clustered correlation heatmap between metabolites under different Pi conditions. The correlation matrix was generated by Pearson correlation coefficients, which are represented by a color code. Red and blue indicate positive and negative correlations, respectively. Two representative metabolic groups showing strong correlations are marked as group 1 and group 2. (B and C) Relative abundance of metabolites included in group 1 (B) and group 2 (C) under different Pi conditions. The profiles of individual metabolites are shown in gray.
FIG 4
FIG 4
Metabolites differentially accumulated under Pi limitation or Pi starvation. Volcano plot analysis of changes after Pi limitation and Pi starvation. (A) Changes after Pi limitation (0.5 mM Pi). Red dots indicate differentially accumulated metabolites (fold change, |FC| > 1.5; P < 0.1). (B) Changes after Pi starvation (0 mM Pi). Red dots indicate differentially accumulated metabolites (fold change, |FC| > 2; P < 0.1). These metabolites are listed in Data Set S1. (C) Heatmap of Pi limitation. The list was selected by t test (P < 0.1), showing metabolites changing at least 1.5-fold under Pi limitation (0.5 mM Pi). (D) Heatmap of Pi starvation. Same as in C but shows metabolites changing at least 2-fold under Pi starvation (0 mM Pi). The relative abundance of metabolites is represented as log2 (fold change) through a color code.
FIG 5
FIG 5
Pathway analysis of differentially accumulated metabolites under different Pi starving conditions. (A and B) Pathway analysis of differentially accumulated metabolites after Pi limitation (0.5 mM Pi) (A) and Pi starvation (0 mM Pi) (B). The size and color of the circle indicate impact value and P value, respectively. The annotated metabolic pathways have higher statistical significance (−log [P] > 1.5).
FIG 6
FIG 6
Inositol pyrophosphate profiles under different Pi conditions. (A to D) Inositol pyrophosphate levels of yeast cells grown in 10 mM, 0.5 mM, and 0 mM Pi medium for 8 h. The data were normalized by the number of cells. The amount of each inositol pyrophosphate in 10 mM Pi medium was set to 1. The means of triplicates are shown with standard deviation; ***, P < 0.001; **, P < 0.01; *, P < 0.05 by Student’s t test; nd, not detected; a.u., arbitrary unit.
FIG 7
FIG 7
Multivariate statistical analysis of metabolite profiling data from wild-type and Δvtc4 cells under 10 mM and 0 mM Pi conditions. (A) Score plot of partial least-squares discriminant analysis (PLS-DA). Red, green, blue, and light blue indicate the replicates of metabolomic data from wild-type 10 mM Pi, wild-type 0 mM Pi, Δvtc4 10 mM Pi, and Δvtc4 0 mM Pi, respectively. The shaded regions represent the 95% confidence intervals. (B) Loading plot of PLS-DA. Red dots indicate Pi-containing metabolites.
FIG 8
FIG 8
Interrelated effect of polyphosphate and Pi starvation on metabolic pathways. (A) Summary of two-way ANOVA analysis (adjusted P value of <0.05). Red, blue, and green represent the metabolites affected by polyphosphate (wild type and Δvtc4), Pi concentration (10 mM and 0 mM Pi), and interaction between both (polyphosphate and Pi concentration), respectively. (B) Metabolite set enrichment analysis of 43 metabolites simultaneously affected by polyphosphate, Pi concentration, and their interaction. The top 15 metabolite sets were selected based on P value. (C) A heatmap was generated based on the list of 43 metabolites affected by Pi concentration, poly(P), and their interaction from a two-way ANOVA. Features were clustered by Euclidean distance using Ward’s clustering method. The color code indicates the normalized intensity of metabolic features.
FIG 9
FIG 9
Working hypothesis on the translation of cytosolic Pi concentration into changes of PP-IPs. The scheme illustrates the inhibitory (red) and stimulatory (green) influences of Pi on key enzymes of ATP and PP-IP production, which are postulated to result from the high Km and half-maximal inhibitory concentration (IC50) values of GAP-DH, F-ATPase, IP6 kinase, and PPIP5 kinase. Details are discussed in the main text.

Similar articles

Cited by

References

    1. Paz-Ares J, Puga MI, Rojas-Triana M, Martinez-Hevia I, Diaz S, Poza-Carrión C, Miñambres M, Leyva A. 2022. Plant adaptation to low phosphorus availability: core signaling, crosstalks and applied implications. Mol Plant 15:104–124. doi:10.1016/j.molp.2021.12.005. - DOI - PubMed
    1. Bhalla K, Qu X, Kretschmer M, Kronstad JW. 2021. The phosphate language of fungi. Trends Microbiol 30:338–349. doi:10.1016/j.tim.2021.08.002. - DOI - PMC - PubMed
    1. Fabiańska I, Bucher M, Häusler RE. 2019. Intracellular phosphate homeostasis—a short way from metabolism to signaling. Plant Sci 286:57–67. doi:10.1016/j.plantsci.2019.05.018. - DOI - PubMed
    1. Michigami T, Kawai M, Yamazaki M, Ozono K. 2018. Phosphate as a signaling molecule and its sensing mechanism. Physiol Rev 98:2317–2348. doi:10.1152/physrev.00022.2017. - DOI - PubMed
    1. Wild R, Gerasimaite R, Jung J-Y, Truffault V, Pavlovic I, Schmidt A, Saiardi A, Jessen HJ, Poirier Y, Hothorn M, Mayer A. 2016. Control of eukaryotic phosphate homeostasis by inositol polyphosphate sensor domains. Science 352:986–990. doi:10.1126/science.aad9858. - DOI - PubMed

Publication types

MeSH terms

LinkOut - more resources