. 2023 Apr 18;15(19):9896-9912.
doi: 10.18632/aging.204663. Epub 2023 Apr 18.

Metabolic switch in the aging astrocyte supported via integrative approach comprising network and transcriptome analyses

Affiliations

Metabolic switch in the aging astrocyte supported via integrative approach comprising network and transcriptome analyses

Alejandro Acevedo et al. Aging (Albany NY). .

Abstract

Dysregulated central-energy metabolism is a hallmark of brain aging. Supplying enough energy for neurotransmission relies on the neuron-astrocyte metabolic network. To identify genes contributing to age-associated brain functional decline, we formulated an approach to analyze the metabolic network by integrating flux, network structure and transcriptomic databases of neurotransmission and aging. Our findings support that during brain aging: (1) The astrocyte undergoes a metabolic switch from aerobic glycolysis to oxidative phosphorylation, decreasing lactate supply to the neuron, while the neuron suffers intrinsic energetic deficit by downregulation of Krebs cycle genes, including mdh1 and mdh2 (Malate-Aspartate Shuttle); (2) Branched-chain amino acid degradation genes were downregulated, identifying dld as a central regulator; (3) Ketone body synthesis increases in the neuron, while the astrocyte increases their utilization, in line with neuronal energy deficit in favor of astrocytes. We identified candidates for preclinical studies targeting energy metabolism to prevent age-associated cognitive decline.

Keywords: astrocyte; brain aging; flux balance analysis; network centrality; neuron.


Conflict of interest statement

CONFLICTS OF INTEREST: The authors declare no conflicts of interest related to this study.

Figures

Figure 1
Figure 1
Summary flowchart of network analyses depicting how optimal and central genes were identified, which merged together form the hub genes group. (A) A genome-scale metabolic model from Lewis et al., 2010 was used. This network was analyzed first using. (B) Flux Balance Analysis, from which Flux and Sensitive Nodes were identified. Merging these two node lists yielded Optimal Nodes, from which Optimal Genes were identified. Sensitive Nodes were then analyzed using. (C) Centrality Analysis, which allowed identifying Central Nodes, from which Central Genes were identified. Merging the list of Optimal and Central Genes produced the Hub Genes list. (D) See boxes in dashed lines for the explanation of each type of analysis.
Figure 2
Figure 2
Summary flowchart of integration of hub genes with transcriptomic data generated during neurotransmission and brain aging. (A) Transcriptomic data during neurotransmission (Hasel et al., 2017) and aging (Tabula Muris Consortium, 2020), reporting differentially expressed genes during each process in the neuron and/or astrocyte was obtained. This allowed us to obtain a list of differentially expressed (DE) genes in both cell types during. (B) neurotransmission and/or (C) brain aging. (D) Venn diagram showing common genes: (1) Between DE genes during neurotransmission and hub genes (pink and green sets); (2) Between DE genes during brain aging and hub genes (yellow and green sets), and (3) The intersection between all three gene groups (pink, yellow and green sets). (E) The differential hub genes (DHG) list is shown in (D) in the shaded area.
Figure 3
Figure 3
Identification of optimal nodes using flux balance analysis in the neuron-astrocyte metabolic network suggests division of labor between the neuron and astrocyte in response to neurotransmission workload. (AC) Reactions considered in the metabolic objective; here, metabolite names correspond to the same as in the model reported by Lewis et al. (2010). (A) Fluxes associated with the Astrocyte-Neuron Lactate Shuttle (ANLS); left side: Lactate efflux from astrocyte to the interstitial space (Lact-Ast); right side: Lactate from the interstitial space entering neurons (Lact-Neu). (B) Fluxes related to the Glutamate-Glutamine Cycle (GGC); left side: vesicle-exported glutamate from neuron (GluVe-Neu); right side: glutamine excretion from astrocyte (GlnEx-As). (C) Neuronal sodium efflux associated with its removal via sodium ATPase pump. (DG) Phenotypìc phase planes are shown as two-dimensional color maps. Here, the Flux Balance Analysis (FBA) solution is represented by the red-filled circle, while all fluxes shown correspond to micromolar per second (uM/s). A white piece-wise line depicts the specific contour level of the solution. (H) The neuron-astrocyte metabolic network is represented as a bipartite network; here, node shape (circle or square) denotes the partition where it belongs, i.e., reaction or metabolite. (I) left side, flux values distribution in each cell; right side: the bipartite network presented in (H) showing node size proportional to absolute flux. (J) left side, sensitivity values distribution in each cell; right side: the bipartite network presented in (H) showing node size proportional to absolute sensitivity. (K) Distribution of the Absolute Optimality values in neuron and astrocyte, the 90 percentile is highlighted by a red dashed line. This line depicts the cutoff over which a reaction was classified as an optimal metabolic reaction. (L) Optimal metabolic reactions (descending order) sorted by their Absolute Optimality and presented alongside their flux and sensitivity.
Figure 4
Figure 4
Centrality-based analysis of the neuron-astrocyte metabolic network further supports the division of labor between the neuron and astrocyte. (A) Distributions, separated by cell, of the contributions of each reaction to the centrality of the sensitivity set. (B) Unsupervised hierarchical clustering of the pairwise correlations between the contributions of each reaction to the centrality of the sensitivity set. The Absolute Centrality Contribution per reaction (ACC) is shown on the right-hand side of the heatmap. (C) Dimensionality reduction via Principal Component Analysis (PCA) of the pairwise correlations between the contributions of each reaction. (D) Distribution of ACC in the neuron (top) and astrocyte (bottom), here, the red dashed line by the 90% percentile indicates the cutoff over which reactions were considered central metabolic reactions. (E) ACC values for the central metabolic reaction separated by cell.
Figure 5
Figure 5
KEGG pathway enrichment of differential hub genes reveals that the aged neuron displays energetic deficit, dysfunctional neurotransmission, decreased branched-chain amino acid degradation and utilization of ketone bodies, and decreased one-carbon pool levels. KEGG pathway enrichment of differential hub genes was followed by manual curation of associated genes. The results are shown for neurotransmission (top panel) and aging (bottom panel). Oxidative phosphorylation (OxPhos, blue): high OxPhos levels during neurotransmission (A) but low OxPhos levels during aging (A’). Synaptic transmission: upregulated Na/K-ATPase pumps (orange) and glutamate synthesis (green) suggest active re-establishment of cation gradients (B) and high glutamate levels (C). The opposite was observed during aging (B’, C’). 3) Ketone body metabolism (yellow): decreased synthesis and increased degradation/utilization during neurotransmission (D), with the opposite observed during aging (D’). 4) Branched-chain amino acid (BCAA) degradation (purple): while differential hub genes involved in the degradation of BCAA were found downregulated during both neurotransmission (E) and aging (E’), dld, which encodes for a subunit of BCAA-decarboxylase, an early step in the degradation of all three BCAA was only downregulated during brain aging. 5) One carbon pool (pink): differential hub gene expression associated with one-carbon metabolism suggests high levels of one-carbon pool intermediates during neurotransmission (F) but low during aging (F’). Created with https://www.biorender.com/.
Figure 6
Figure 6
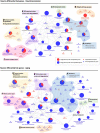
KEGG pathway enrichment analysis of astrocyte differential hub genes suggests a metabolic switch from aerobic glycolysis to oxidative phosphorylation during aging. (A and A’) Metabolic switch (blue): upregulation of ldha during neurotransmission but ldhb during aging. Ldha/b genes encode for subunits of lactate dehydrogenase, which catalyzes the interconversion of pyruvate into lactate. Ldha subunits favor lactate levels and were upregulated during neurotransmission, while ldhb favors pyruvate and is upregulated during aging. Also, the major glucose uptake transporter in the blood-brain barrier, encoded by slc2a1, was upregulated during neurotransmission only. Instead, during aging, mdh1/2 encode for enzymes of the malate-aspartate shuttle, which allows transport of NADH into the mitochondrial matrix to provide electrons for the ETC. Both genes were upregulated during aging, in agreement with a high OxPhos rate. (B and B’) Branched-chain amino acid (BCAA) degradation (purple): during neurotransmission, upregulation of slc7a5 was observed (amino acid transporter present in the cell surface and lysosome; participates in leucine uptake into the lysosome for degradation), while during aging, three enzymes involved in BCAA degradation, including dld, were downregulated. (C) Ketone body degradation/utilization (yellow): the enzyme encoded by bdh1 catalyzes the interconversion of acetoacetate and β-hydroxybutyrate, the two main ketone bodies, and was upregulated during aging only. (D) Synaptic transmission (green): abat encodes for an enzyme that breaks down GABA into glutamate and is downregulated during aging in the astrocyte. (E) One carbon pool (pink): differential hub gene expression associated with one-carbon metabolism suggests an increase in one-carbon pool during astrocyte aging. Created with https://www.biorender.com/.

References

    1. Mattson MP, Arumugam TV. Hallmarks of Brain Aging: Adaptive and Pathological Modification by Metabolic States. Cell Metab. 2018; 27:1176–99. 10.1016/j.cmet.2018.05.011 - DOI - PMC - PubMed
    1. Pellerin L, Magistretti PJ. Glutamate uptake into astrocytes stimulates aerobic glycolysis: a mechanism coupling neuronal activity to glucose utilization. Proc Natl Acad Sci U S A. 1994; 91:10625–9. 10.1073/pnas.91.22.10625 - DOI - PMC - PubMed
    1. Attwell D, Laughlin SB. An energy budget for signaling in the grey matter of the brain. J Cereb Blood Flow Metab. 2001; 21:1133–45. 10.1097/00004647-200110000-00001 - DOI - PubMed
    1. Bonvento G, Bolaños JP. Astrocyte-neuron metabolic cooperation shapes brain activity. Cell Metab. 2021; 33:1546–64. 10.1016/j.cmet.2021.07.006 - DOI - PubMed
    1. Harris JJ, Jolivet R, Attwell D. Synaptic energy use and supply. Neuron. 2012; 75:762–77. 10.1016/j.neuron.2012.08.019 - DOI - PubMed

Publication types