. 2023 May 30;42(5):112419.
doi: 10.1016/j.celrep.2023.112419. Epub 2023 Apr 18.

Time-dependent regulation of cytokine production by RNA binding proteins defines T cell effector function

Affiliations

Time-dependent regulation of cytokine production by RNA binding proteins defines T cell effector function

Branka Popović et al. Cell Rep. .

Abstract

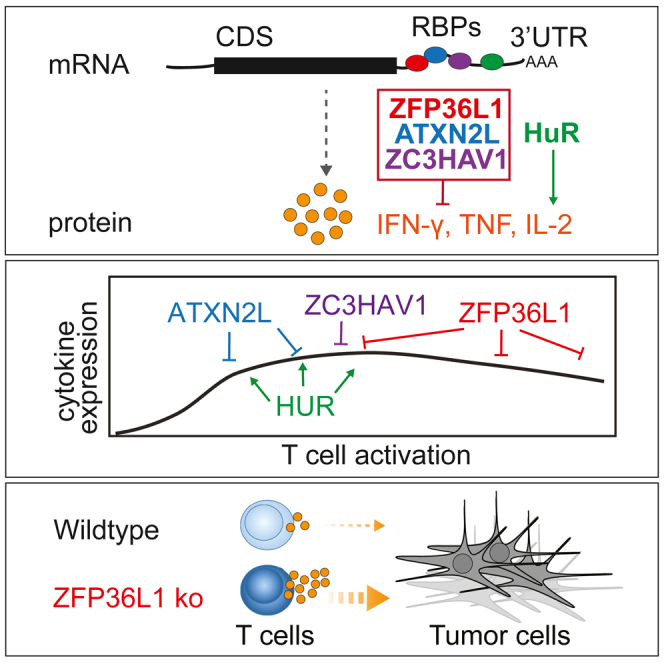
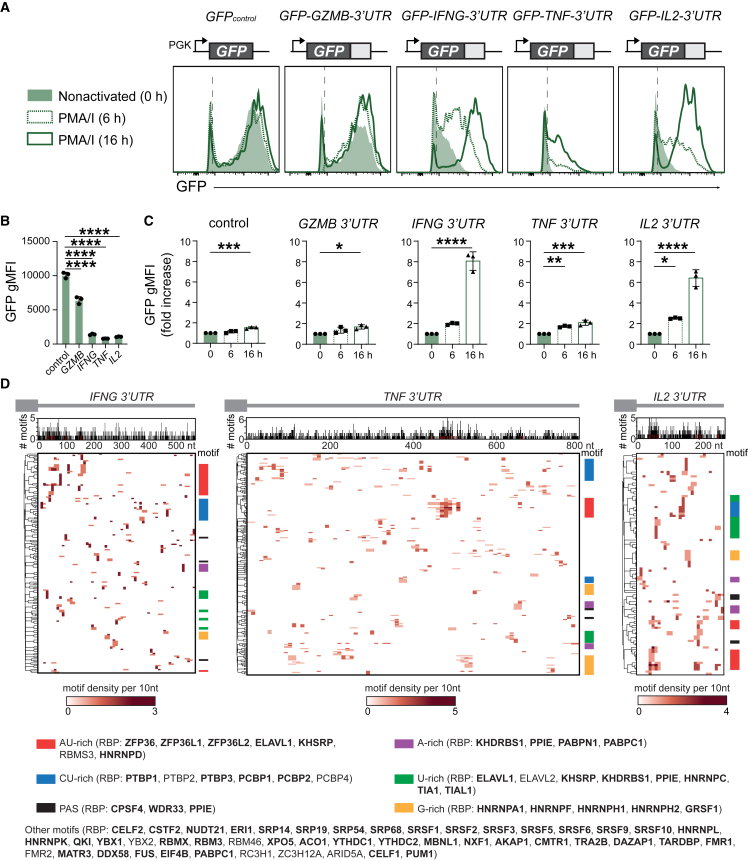
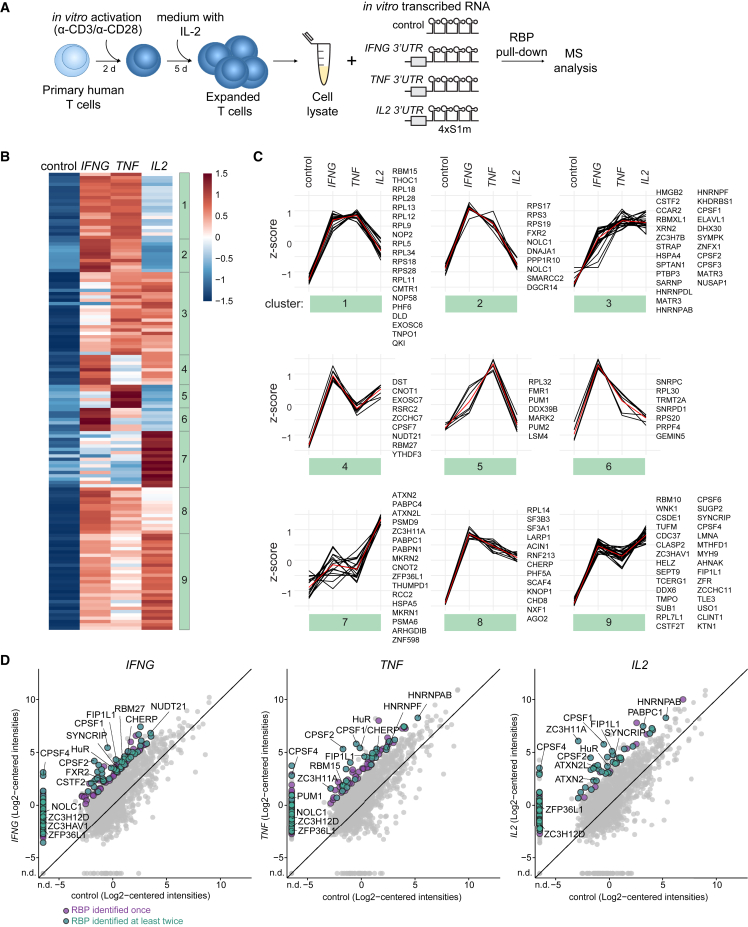
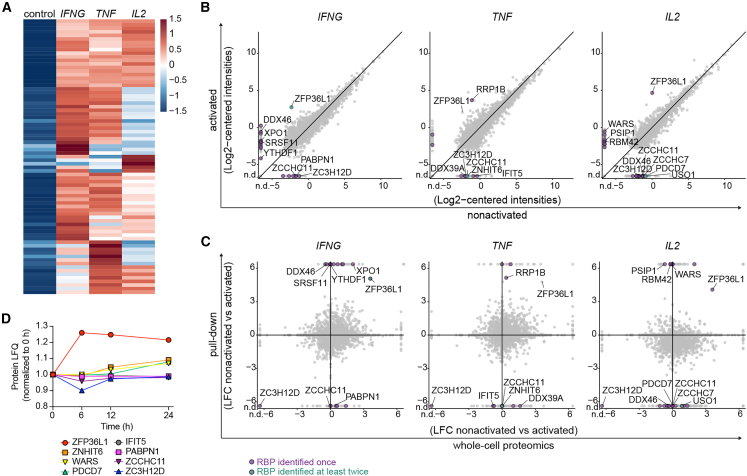
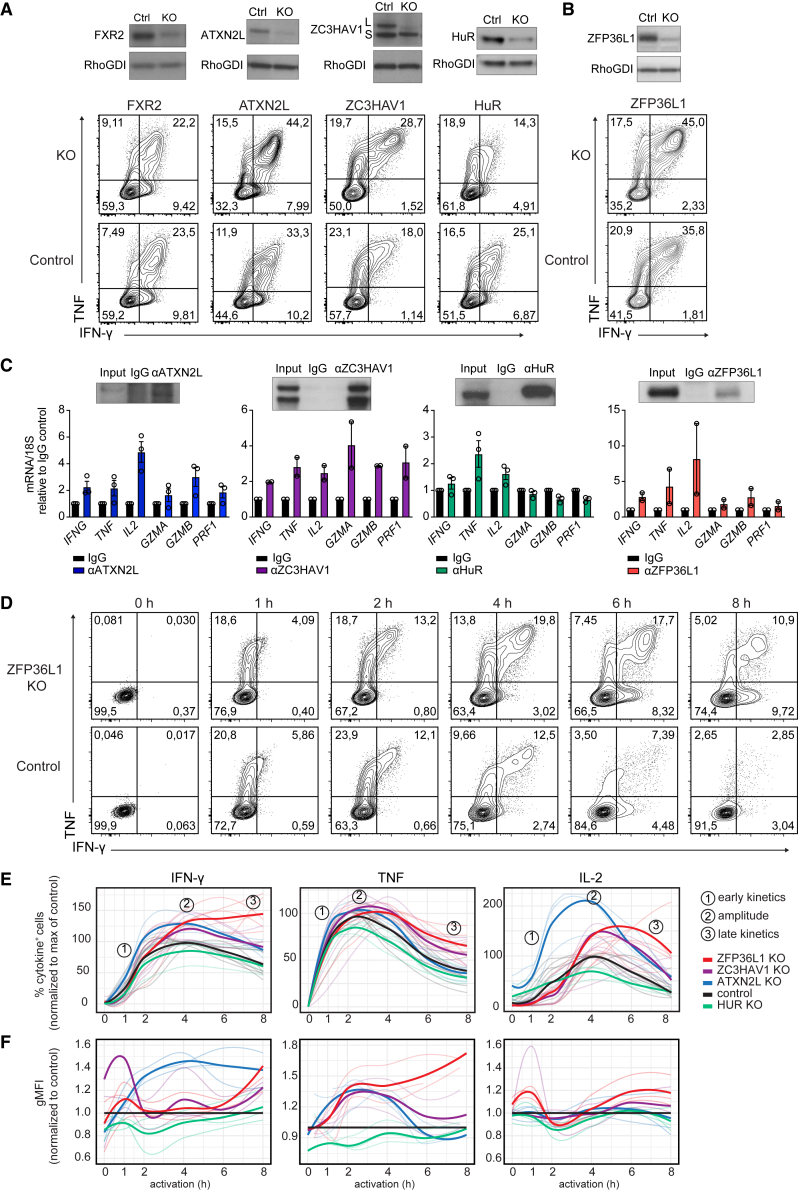
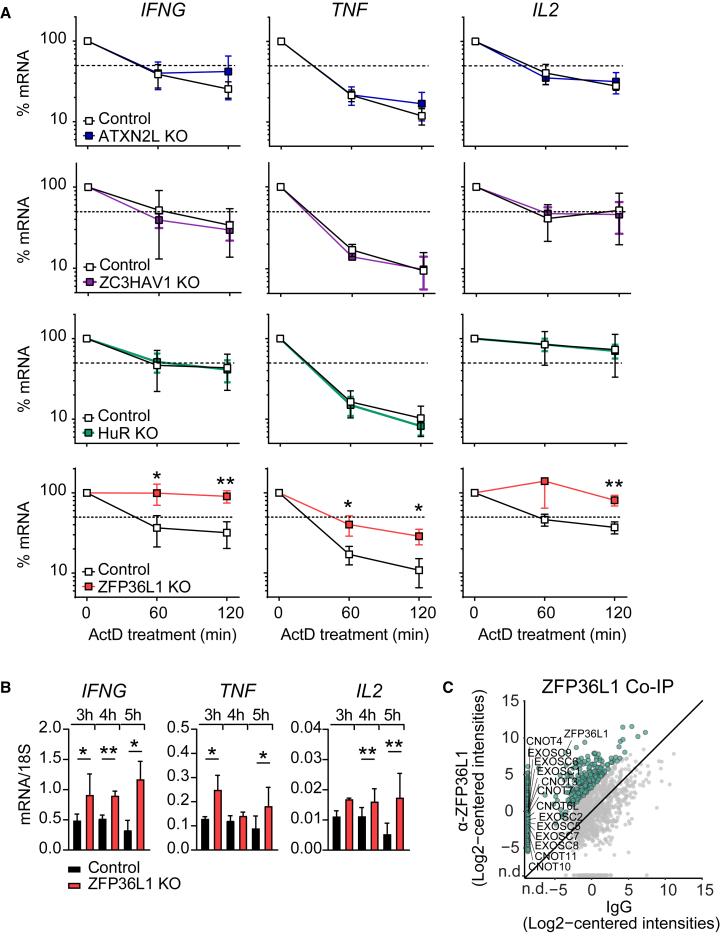
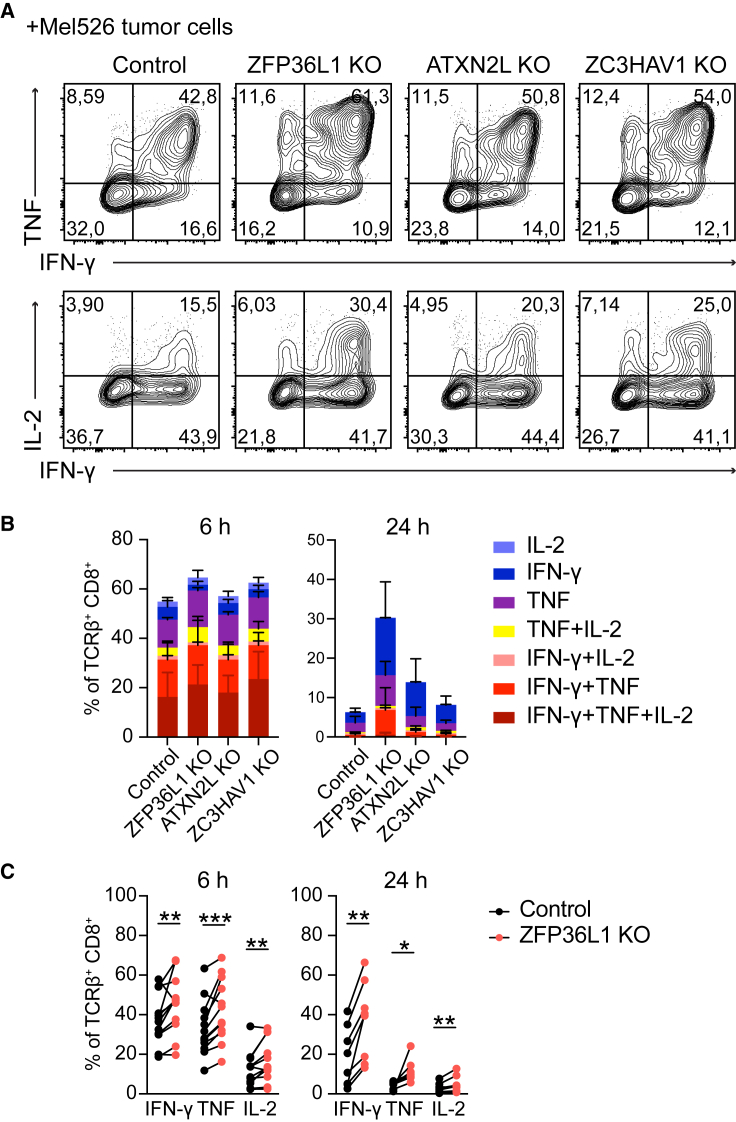
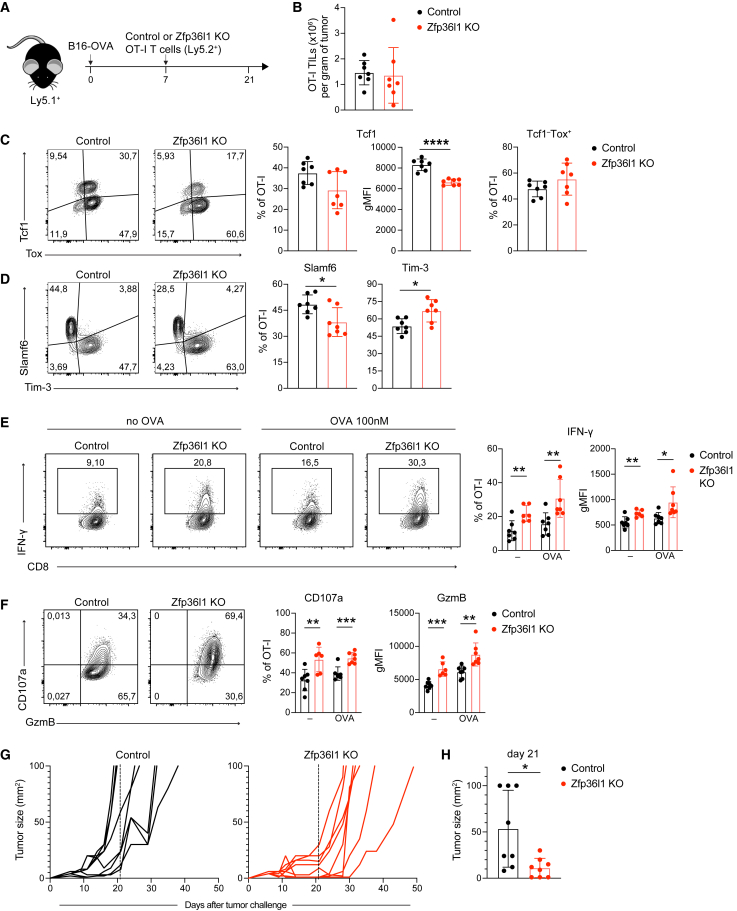
Potent T cell responses against infections and malignancies require a rapid yet tightly regulated production of toxic effector molecules. Their production level is defined by post-transcriptional events at 3' untranslated regions (3' UTRs). RNA binding proteins (RBPs) are key regulators in this process. With an RNA aptamer-based capture assay, we identify >130 RBPs interacting with IFNG, TNF, and IL2 3' UTRs in human T cells. RBP-RNA interactions show plasticity upon T cell activation. Furthermore, we uncover the intricate and time-dependent regulation of cytokine production by RBPs: whereas HuR supports early cytokine production, ZFP36L1, ATXN2L, and ZC3HAV1 dampen and shorten the production duration, each at different time points. Strikingly, even though ZFP36L1 deletion does not rescue the dysfunctional phenotype, tumor-infiltrating T cells produce more cytokines and cytotoxic molecules, resulting in superior anti-tumoral T cell responses. Our findings thus show that identifying RBP-RNA interactions reveals key modulators of T cell responses in health and disease.

Keywords: ATXN2L; CP: Immunology; HuR; RNA binding proteins; ZC3HAV1; ZFP36L1; cytokines; human T cells; post-transcriptional regulation; tumor-infiltrating T cells.


Conflict of interest statement

Declaration of interests The authors declare no competing interests.

Figures

None
Graphical abstract
Figure 1
Figure 1
Conserved regulation of protein production by cytokine 3′ UTRs (A) Representative histograms of human CD8+ T cells transduced with GFP reporter constructs containing indicated full-length 3′ UTRs or GFP empty control. T cells were resting (green histograms) or activated with PMA/ionomycin (PMA/I) for 6 h and 16 h (dashed and solid green lines, respectively). (B) GFP gMFI in resting human CD8+ T cells. Data depict mean ± SD of three donors, representative of at least two independently performed experiments. One-way ANOVA with Dunnett’s multiple comparison with the control (∗∗∗∗p < 0.0001). (C) Fold increase of GFP gMFI upon PMA/I activation compared with resting CD8+ T cells. Data depict mean ± SD of three donors, representative of two independently performed experiments. One-way ANOVA with Dunnett’s multiple comparison with the control (p < 0.05, ∗∗p < 0.01, ∗∗∗p < 0.001, ∗∗∗∗p < 0.0001). (D) RBP binding motifs in cytokine 3′ UTRs. Top graph: number of motifs per 3′ UTR sequence. Bottom heatmap: motif density per 3′ UTR sequence. Color coding refers to indicated motif sequences. Putative RBP interactors indicated in parentheses, with RBPs detected in whole-cell T cell proteomics (Table S5) indicated in bold.
Figure 2
Figure 2
Identification of RNA binding proteins that interact with IFNG, TNF, and IL2 3′ UTRs (A) Scheme of RBP pull-down assay. Lysates of in vitro activated and expanded T cells from 40 pooled donors were incubated with in vitro transcribed empty control or full-length cytokine 3′ UTR-containing 4xS1m RNA aptamers. Protein binding to 4xS1m RNA aptamers was identified by label-free MS analysis. (B) Heatmap of RBPs reproducibly enriched with 4xS1m RNA aptamers containing cytokine 3′ UTRs compared with control (n = 138, log2 fold change [LFC] > 4). Color scale represents Z-scored log2 median-centered averaged intensities. Numbers indicate clusters. (C) Cluster analysis of RBP interaction specificities from (B). Red line depicts the average expression. (D) Comparison of protein raw log2 median-centered intensities from the cytokine 3′ UTR pull-down versus control. Averaged expression levels of duplicates (IFNG) or triplicates (TNF and IL2). Purple dots: RBP identified in one pull-down experiment with LFC > 4 compared with control. Green dots: RBP reproducibly identified in at least two independently performed pull-down experiments. Gray dots: all proteins identified. n.d., not detected.
Figure 3
Figure 3
The RBP landscape of IFNG, TNF, and IL2 3′ UTR alters upon T cell activation (A) Heatmap of RBPs reproducibly enriched in pull-downs from PMA/I-activated T cells (2 h) with cytokine 3′ UTR-containing aptamers compared with control (n = 77; LFC > 4). Color scale represents Z-scored log2 median-centered averaged intensities. (B) Protein raw log2 median-centered intensities from cytokine 3′ UTR pull-downs of non-activated T cells compared with activated T cells. (C) Log2 fold change (LFC) of cytokine 3′ UTR pull-downs from non-activated to activated T cells correlated with the LFC of protein log2 intensities of the whole-cell proteome of non-activated versus activated T cells. In (B) and (C), expression levels of triplicates were averaged. Green and purple dots show proteins with enrichment LFC > 4 compared with control and LFC < −4 or LFC > 4 between non-activated and activated T cells. Purple dots: RBP identified in one pull-down experiment with LFC > 4 compared with control. Green dots: RBP reproducibly identified in at least two independently performed pull-down experiments. Gray dots: all proteins identified. n.d., not detected. (D) Protein expression levels of indicated RBPs upon activation of human CD4+ memory T cells. Data from Wolf et al.
Figure 4
Figure 4
RBP-specific modulation of cytokine production kinetics in human T cells (A and B) (Top) Immunoblot of human T cells 7 days after CRISPR-Cas9 gene editing for indicated RBP or with non-targeting crRNA (ctrl). ZC3HAV1 long (L) and short (S) variant. (Bottom) IFN-γ and TNF protein expression of CD8+ T cells after 4-h α-CD3/α-CD28 activation. Brefeldin A was added for the last 2 h. Data are representative of at least two independent experiments, each with three donors. (C) Native RNA immunoprecipitation (RIP) with ATXN2L, ZC3HAV1, HuR, and ZFP36L1 antibodies or respective immunoglobulin G (IgG) isotype control from PMA/I-activated (2 h) human T cell lysates (or 1 h for HuR). (Top) Enrichment of indicated RBP upon RIP, as determined by immunoblot. (Bottom) qRT-PCR of endogenous mRNAs from RIP of indicated RBPs or IgG control. Data compiled from three (ATXN2L, HuR) or two (ZC3HAV1, ZFP36L1) donors from independently performed experiments, with mean ± SD. (D) IFN-γ and TNF production kinetics of CD3/α-CD28-stimulated ZFP36L1 KO or control CD8+ T cells. Brefeldin A was added for the last 2 h (for the 1 h time point from the start). Representative dot plots of intracellular cytokine staining of at least six donors from two independent experiments. (E) Cytokine production kinetics of RBP KO CD8+ T cells compared with the peak of production of the paired non-targeting crRNA-treated control T cells (set at 100%). Data are presented as mean (bold line) and 3–6 individual donors (thin lines). (F) gMFI of cytokine-producing RBP KO CD8+ T cells (of E) compared with paired control treated cells (set at 1). Data are presented as mean (bold line) and individual donors (thin lines).
Figure 5
Figure 5
ZFP36L1 destabilizes IFN-γ, TNF, and IL-2 mRNA in human T cells (A) Cytokine mRNA levels of ATXN2L, HuR, ZC3HAV1, and ZFP36L1 KO T cells and paired control treated T cells that were reactivated with α-CD3/α-CD28 for 3 h (HuR for 1 h) and then treated with actinomycin D (ActD) for indicated time points. Data are presented as mean ± SD of three donors and are representative of two independently performed experiments. Unpaired t test (p < 0.05, ∗∗p < 0.01). (B) Cytokine mRNA levels of ZFP36L1 KO and control T cells reactivated for indicated time points with α-CD3/α-CD28. Data are presented as mean ± SD of three donors and are representative of two independently performed experiments. Ratio paired t test (p < 0.05, ∗∗p < 0.01). (C) Co-immunoprecipitation with α-ZFP36L1 antibodies or IgG control from cytosolic lysates of 2 h PMA/I-activated human T cells, followed by MS analysis. Data represent protein raw log2 median-centered intensities from ZFP36L1 immunoprecipitation versus control. Expression levels of biological replicates were averaged (n = 3 donors). Green dots: putative interactors of ZFP36L1 identified with LFC > 6 compared with control. Gray dots: all proteins identified. n.d., not detected.
Figure 6
Figure 6
RBPs regulate cytokine expression in tumor-specific human T cells (A) MART1 TCR-engineered T cells were CRISPR-Cas9 gene edited for indicated RBP or control treated with non-targeting crRNA. Representative dot plots of cytokine production of MART1-specific CD8+ T cells after 6 h of co-culture with MART1+ tumor cells. Brefeldin A was added for the last 2 h. Data are representative of at least two independent experiments with 3–4 donors each. (B) Cytokine profile analysis of MART1-specific CD8+ T cells. n = 3 donors, with mean ± SD. Data are representative of at least two independent experiments. (C) Cytokine production in response to MART1+ tumor cells of n = 7 donors, compiled from two independently performed experiments. Ratio paired t test (p < 0.05, ∗∗p < 0.01, ∗∗∗p < 0.001).
Figure 7
Figure 7
ZFP36L1 dampens cytokine production in tumor-specific T cells in vivo (A) B16-OVA tumor-bearing Ly5.1+ C57BL/6J mice received 1 × 106 control or Zfp36l1 KO OT-I Ly5.2+ T cells 7 days post tumor engraftment. Tumors were excised 14 days after T cell transfer, and tumor-infiltrating T cells (TILs) were analyzed ex vivo. (B) Absolute cell numbers of control and Zfp36l1 KO TILs per gram of tumor. (C and D) (Left) Representative dot plots and (right) compiled data of percentages and gMFI of Tcf1 and Tox, and of Slamf6 and Tim-3 protein expression by control or Zfp36l1 KO OT-I TILs. (E) (Left) Representative IFN-γ expression by control or Zfp36l1 KO TILs with or without reactivation with 100 nM OVA257–264 peptide for 4 h, and for the last 2 h with brefeldin A and monensin. (Right) Percentage and gMFI of IFN-γ producing TILs. (F) (Left) Representative CD107a and granzyme B expression by control and Zfp36l1 KO TILs in the presence of brefeldin A and monensin for 2 h. (Right) Control and Zfp36l1 KO T cells were reactivated with 100 nM OVA257–264 peptide for 4 h, or left untreated, with brefeldin A and monensin for the last 2 h. In (A) to (F), n = 7 mice per group, with mean ± SD. Data are representative of two independent experiments. Unpaired t test (p < 0.05, ∗∗p < 0.01, ∗∗∗p < 0.001, ∗∗∗∗p < 0.0001). (G) Tumor size of B16-OVA tumor-bearing Ly5.1+Ly5.2+ mice treated with 0.65 × 106 Zfp36l1 KO or control OT-I Ly5.2+ T cells at day 7 after tumor injection. Dashed line set at 14 days after T cell transfer. n = 8 mice/group. (H) Tumor size at day 21 (14 days after the T cell transfer). n = 8 mice/group. Unpaired t test (p < 0.05).

Similar articles

Cited by

References

    1. Zhang B., Karrison T., Rowley D.A., Schreiber H. IFN-gamma- and TNF-dependent bystander eradication of antigen-loss variants in established mouse cancers. J. Clin. Invest. 2008;118:1398–1404. doi: 10.1172/JCI33522. - DOI - PMC - PubMed
    1. Patel S.J., Sanjana N.E., Kishton R.J., Eidizadeh A., Vodnala S.K., Cam M., Gartner J.J., Jia L., Steinberg S.M., Yamamoto T.N., et al. Identification of essential genes for cancer immunotherapy. Nature. 2017;548:537–542. doi: 10.1038/nature23477. - DOI - PMC - PubMed
    1. Almeida J.R., Price D.A., Papagno L., Arkoub Z.A., Sauce D., Bornstein E., Asher T.E., Samri A., Schnuriger A., Theodorou I., et al. Superior control of HIV-1 replication by CD8+ T cells is reflected by their avidity, polyfunctionality, and clonal turnover. J. Exp. Med. 2007;204:2473–2485. doi: 10.1084/jem.20070784. - DOI - PMC - PubMed
    1. Ciuffreda D., Comte D., Cavassini M., Giostra E., Bühler L., Perruchoud M., Heim M.H., Battegay M., Genné D., Mulhaupt B., et al. Polyfunctional HCV-specific T-cell responses are associated with effective control of HCV replication. Eur. J. Immunol. 2008;38:2665–2677. doi: 10.1002/eji.200838336. - DOI - PubMed
    1. Quezada S.A., Simpson T.R., Peggs K.S., Merghoub T., Vider J., Fan X., Blasberg R., Yagita H., Muranski P., Antony P.A., et al. Tumor-reactive CD4+ T cells develop cytotoxic activity and eradicate large established melanoma after transfer into lymphopenic hosts. J. Exp. Med. 2010;207:637–650. doi: 10.1084/jem.20091918. - DOI - PMC - PubMed

Publication types

MeSH terms

LinkOut - more resources