. 2023 Jul 1;34(8):ar84.
doi: 10.1091/mbc.E23-01-0029. Epub 2023 Apr 19.

Multiple tethers of organelle contact sites are involved in α-synuclein toxicity in yeast

Affiliations

Multiple tethers of organelle contact sites are involved in α-synuclein toxicity in yeast

Mara Del Vecchio et al. Mol Biol Cell. .

Abstract

The protein α-synuclein (α-syn) is one of the major factors linked to Parkinson's disease, yet how its misfolding and deposition contribute to the pathology remains largely elusive. Recently, contact sites among organelles were implicated in the development of this disease. Here, we used the budding yeast Saccharomyces cerevisiae, in which organelle contact sites have been characterized extensively, as a model to investigate their role in α-syn cytotoxicity. We observed that lack of specific tethers that anchor the endoplasmic reticulum to the plasma membrane resulted in cells with increased resistance to α-syn expression. Additionally, we found that strains lacking two dual-function proteins involved in contact sites, Mdm10 and Vps39, were resistant to the expression of α-syn. In the case of Mdm10, we found that this is related to its function in mitochondrial protein biogenesis and not to its role as a contact site tether. In contrast, both functions of Vps39, in vesicular transport and as a tether of the vacuole-mitochondria contact site, were required to support α-syn toxicity. Overall, our findings support that interorganelle communication through membrane contact sites is highly relevant for α-syn-mediated toxicity.


Figures
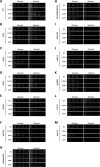
FIGURE 1:
FIGURE 1:
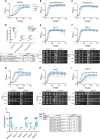
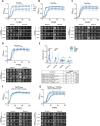
Targeted genetic screen for the involvement of contact site components in α-syn toxicity. A WT strain and isogenic mutants lacking different MCS proteins, transformed with α-synWT, the clinical mutants α-synA30P and α-synA53T, and an empty vector under the control of the strong constitutive TPI1 (triose phosphate isomerase) promoter were spotted as seriated dilution on fermentative and respiratory selective media containing 2% glucose and 3% glycerol, respectively.
FIGURE 2:
FIGURE 2:
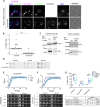
Tcb1, Tcb2, and Scs2 are involved in α-syn toxicity. (A–C, E–I) Growth profiles of a WT strain and isogenic mutants lacking ER–PM components transformed with α-synWT, the clinical mutants α-synA30P and α-synA53T, and an empty vector under the control of the strong constitutive TPI1 promoter. The curves shown represent the mean ± SD of four independent transformants. At least three independent experiments were performed. (D, J) Box plots of the duplication times for each strain, calculated from the exponential phase of the growth curve of each individual transformant. Statistical analysis was based on a two-way analysis of variance (ANOVA), followed by a Tukey posthoc test for multiple comparisons. The comparison between the expression of the different α-syn variants with the corresponding empty vector within each strain is shown above the box plot for each individual strain. The table to the right shows the comparison between strains, in which we show the comparison without α-syn expression (EV, empty vector) and with expression of α-synwt. n.s. P value > 0.05, * P value < 0.05, ** P value < 0.01, **** P value < 0.0001.
FIGURE 3:
FIGURE 3:
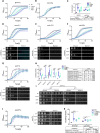
Toxicity of α-syn requires a functional SAM complex but not a functional ERMES complex. (A, B, D–G, J) Growth profiles of a WT strain and isogenic mutants lacking ERMES or regulator component and sam37∆ cells transformed with α-synWT, the clinical mutants α-synA30P and α-synA53T, and an empty vector under the control of the strong constitutive TPI1 promoter. The bar graphs represent the mean ± SD of four independent transformants. At least three independent experiments were performed. (C, H, K) Box plots of the duplication times for each strain, calculated from the exponential phase of the growth curve of each individual transformant. Statistical analysis was based on a two-way ANOVA, followed by a Tukey posthoc test for multiple comparisons. The comparison between the expression of the different α-syn variants with the corresponding empty vector within each strain is shown above the box plot for each individual strain. The tables show the comparison between strains, in which we show the comparison without α-syn expression (EV, empty vector) and with expression of α-synwt. n.s. P value > 0.05, * P value < 0.05, ** P value < 0.01, *** P value < 0.001, **** P value < 0.0001. (I) Serial dilutions of cells carrying the mmm1-1 temperature-sensitive allele expressing α-synWT, the clinical mutants α-synA30P and α-synA53T, and an empty vector under the control of the strong constitutive TPI promoter were spotted on fermentable and respiratory selective medium containing, respectively, 2% glucose and 3% glycerol at both permissive and restrictive temperatures.
FIGURE 4:
FIGURE 4:
HOPS and trafficking along the late endocytic pathway are required for α-syn toxicity. (A, B, D–H) Growth profiles of a WT strain and isogenic mutants lacking HOPS subunits (vps39∆, vps41∆, vps33∆), a CORVET subunit (vps8∆), or a vacuolar SNARE (vam3∆) transformed with α-synWT, the clinical mutants α-synA30P and α-synA53T, and an empty vector under the control of the strong constitutive TPI1 promoter. The bar graphs represent the mean ± SD of four independent transformants. At least three independent experiments were performed. (C, I) Box plots of the duplication times for each strain, calculated from the exponential phase of the growth curve of each individual transformant. Statistical analysis was based on a two-way ANOVA, followed by a Tukey posthoc test for multiple comparisons. The comparison between the expressions of the different α-syn variants with the corresponding empty vector within each strain is shown above the box plot for each individual strain. The tables show the comparison between strains, in which we show the comparison without α-syn expression (EV, empty vector) and with expression of α-synwt. n.s. P value > 0.05, * P value < 0.05, ** P value < 0.01, *** P value < 0.001, **** P value < 0.0001.
FIGURE 5:
FIGURE 5:
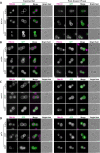
α-syn localization in the postdiauxic phase is affected in mutants of the endocytic pathway. Analysis of the intracellular localization of α-synwt and the clinical mutants α-synA30P and α-synA53T fused to GFP by fluorescence microscopy. The proteins are expressed under the control of the MET25 repressible promoter in WT, vps39∆, ypt7∆, and vps41∆ strains. Vacuole membranes are stained with FM4-64. Pictures were taken after 3–6 h induction (exponential phase) and after 24 h (postdiauxic phase) in a selective medium containing 20 μM methionine. Representative pictures are shown for each condition. The scale bar represents 5 µm.
FIGURE 6:
FIGURE 6:
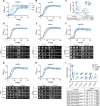
vCLAMP defective-Vps39 mutants suggest that vCLAMP is also required for α-syn toxicity. (A–D, F, G) Growth profiles of vps39∆ strains complemented with VPS39WT or different VPS39 mutant alleles transformed with α-synWT, the clinical mutants α-synA30P and α-synA53T, and an empty vector under the control of the strong constitutive TPI1 promoter. The bar graphs represent the mean ± SD of four independent transformants. At least three independent experiments were performed. (E) Box plots of the duplication times for each strain, calculated from the exponential phase of the growth curve of each individual transformant. Statistical analysis was based on a two-way ANOVA, followed by a Tukey posthoc test for multiple comparisons. The comparison between the expressions of the different α-syn variants with the corresponding empty vector within each strain is shown above the box plot for each individual strain. The table shows the comparison between strains, in which we show the comparison without α-syn expression (EV, empty vector) and with expression of α-synwt. n.s. P value > 0.05, * P value < 0.05, ** P value < 0.01, **** P value < 0.0001.
FIGURE 7:
FIGURE 7:
Tagging Tom20 with GFP inhibits vCLAMP formation and suppresses α-syn toxicity. (A) Tagging Tom20 with GFP inhibits extended vCLAMP formation by overexpressed Vps39. mCherry-Vps39 subcellular localization expressed under the control of the strong constitutive TEF1 promoter was analyzed by fluorescence microscopy. Tom70-HaloTag labeled with JF-646 is used as a mitochondrial marker, and vacuole lumens are stained with CMAC. The scale bar represents 2 μm. (B) Plot showing the number of vCLAMPs per cell when mCherry-Vps39 is expressed under the control of the TEF1 promoter, in control cells or cells expressing Tom20-GFP. We considered a vCLAMP a patch of accumulation of Vps39 on the vacuole membrane in the region where the mitochondria is in proximity to the vacuole. The average for each of the three independent experiments is shown as a circle; at least 50 cells were counted per experiment per condition. Statistical comparison was performed by an unpaired two-sample Student’s t test using the means of each experiment (significance indicated by the asterisks; *** P < 0.001). (C) Analysis of copurification of mitochondria with vacuoles. SDS–PAGE and Western blot analysis of whole-cell lysates or isolated vacuoles from control strains or strains expressing Tom20-GFP. Por1 is used as a mitochondrial marker and Vph1 as a vacuolar marker. (D) Tagging Tom20 with GFP does not affect respiratory growth. Seriated dilutions of a WT strain or a strain containing Tom20-GFP were spotted on media containing glucose, lactate, or glycerol as the sole carbon source. (E–F) Growth profiles in liquid and solid medium of a WT strain with Tom20 tagged either with GFP or with HaloTag, expressing α-synWT, the clinical mutants α-synA30P and α-synA53T under the control of the strong constitutive TPI1 promoter, or an empty vector. The bar graphs represent the mean ± SD of four independent transformants. At least three independent experiments were performed. (G) Box plots of the duplication times for each strain, calculated from the exponential phase of the growth curve of each individual transformant. Statistical analysis was based on a two-way ANOVA, followed by a Tukey posthoc test for multiple comparisons. The comparison between the expressions of the different α-syn variants with the corresponding empty vector within each strain is shown above the box plot for each individual strain. The table shows the comparison between strains, in which we show the comparison without α-syn expression (EV, empty vector) and with expression of α-synwt. n.s. P value > 0.05, * P value < 0.05, ** P value < 0.01, *** P value < 0.001, **** P value < 0.0001.
FIGURE 8:
FIGURE 8:
Contact sites and tethers required for α-syn toxicity. Diagram representing the contact sites and processes found to be necessary for α-syn toxicity in the present study. The proteins that result in resistance to α-syn expression when deleted are marked in red, and so are the contact sites, processes, or complexes in which they are involved. Strains lacking Tcb2, Tcb3, or Scs2, components of the ER–plasma MCS are resistant to α-syn expression. Cells lacking Mdm10 are also resistant to α-syn, and this is likely related to its function in the SAM complex and not to its function as a component of the ERMES tethering complex. Both functions of Vps39 are required for α-syn toxicity: in vesicular transport through the endosomal pathway and as a tether of the vCLAMPs. Nvj2 deletion renders cells resistant to α-syn expression only under respiratory growth conditions, indicating that it is likely that its role in the NVJ is required. This figure was created with BioRender.com.

Similar articles

Cited by

References

    1. Amado L, Cogan AP, González Montoro A (2023). Tethering proteins of the same contact site affect the localization and mobility of each other. J Cell Sci in press. - PubMed
    1. Avenali M, Blandini F, Cerri S (2020). Glucocerebrosidase defects as a major risk factor for Parkinson’s disease. Front Aging Neurosci 12, 97. - PMC - PubMed
    1. Babazadeh R, Ahmadpour D, Jia S, Hao X, Widlund P, Schneider K, Eisele F, Edo LD, Smits GJ, Liu B, Nystrom T (2019). Syntaxin 5 is required for the formation and clearance of protein inclusions during proteostatic stress. Cell Rep 28, 2096–2110.e8. - PubMed
    1. Balderhaar HJ, Ungermann C (2013). CORVET and HOPS tethering complexes—coordinators of endosome and lysosome fusion. J Cell Sci 126, 1307–1316. - PubMed
    1. Bandres-Ciga S, Diez-Fairen M, Kim JJ, Singleton AB (2020). Genetics of Parkinson’s disease: an introspection of its journey towards precision medicine. Neurobiol Dis 137, 104782. - PMC - PubMed

Publication types

MeSH terms

Substances

LinkOut - more resources