. 2023 May 31;193(2):175-191.
doi: 10.1093/toxsci/kfad036.

Exposure to quasi-ultrafine particulate matter accelerates memory impairment and Alzheimer's disease-like neuropathology in the AppNL-G-F knock-in mouse model

Affiliations

Exposure to quasi-ultrafine particulate matter accelerates memory impairment and Alzheimer's disease-like neuropathology in the AppNL-G-F knock-in mouse model

Jason G Kilian et al. Toxicol Sci. .

Abstract

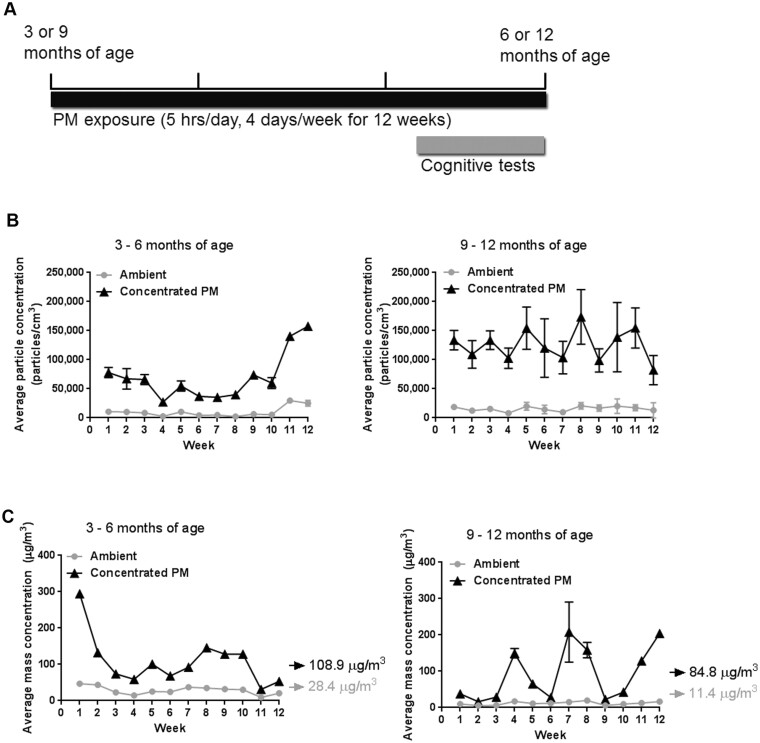
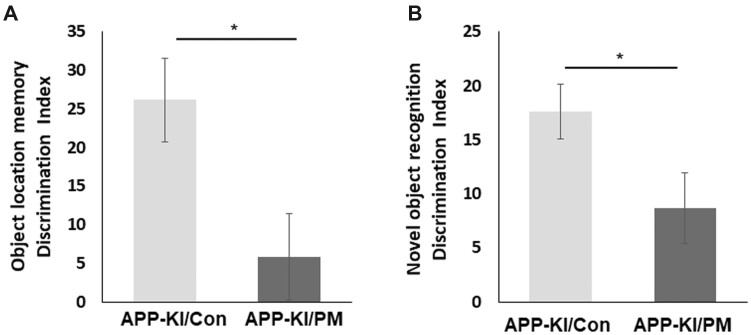
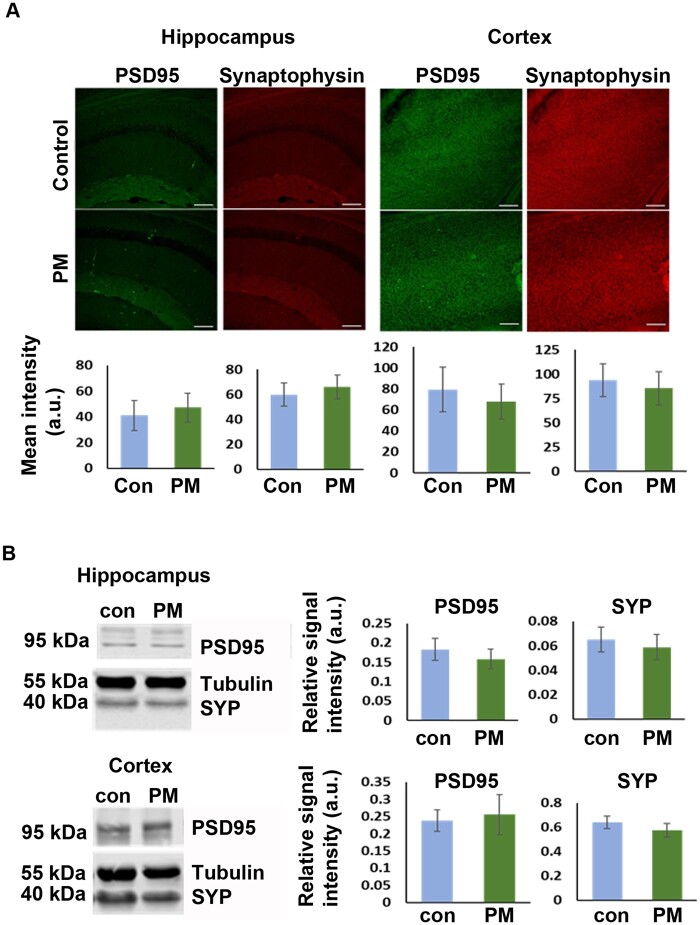
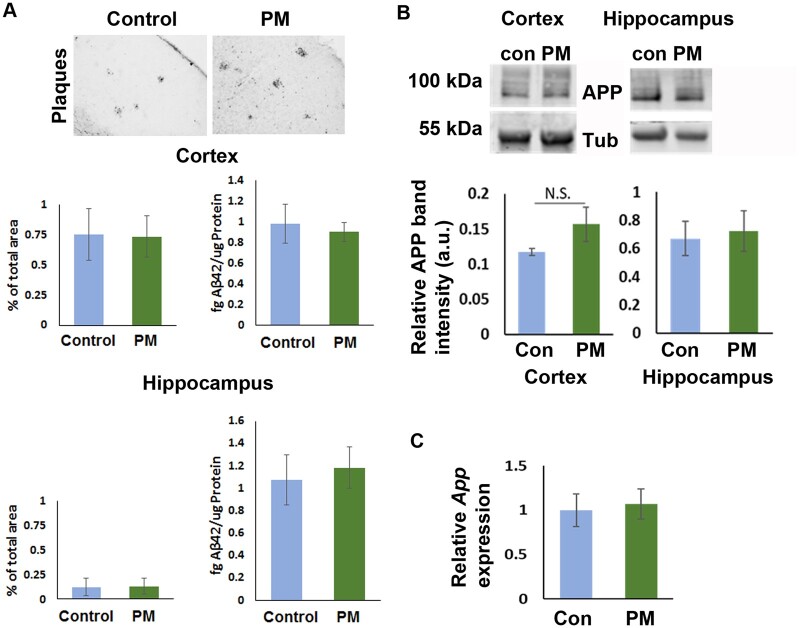
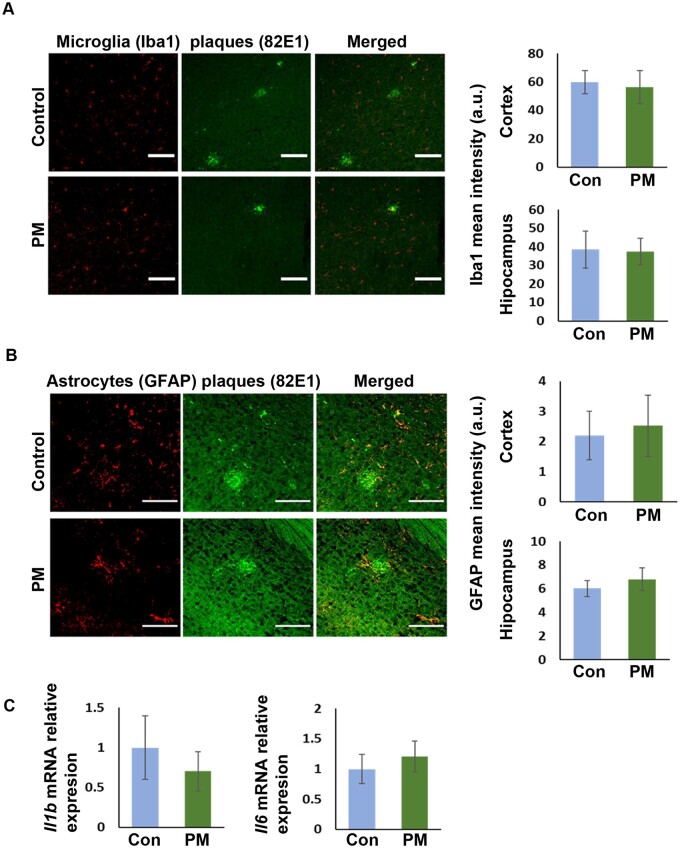
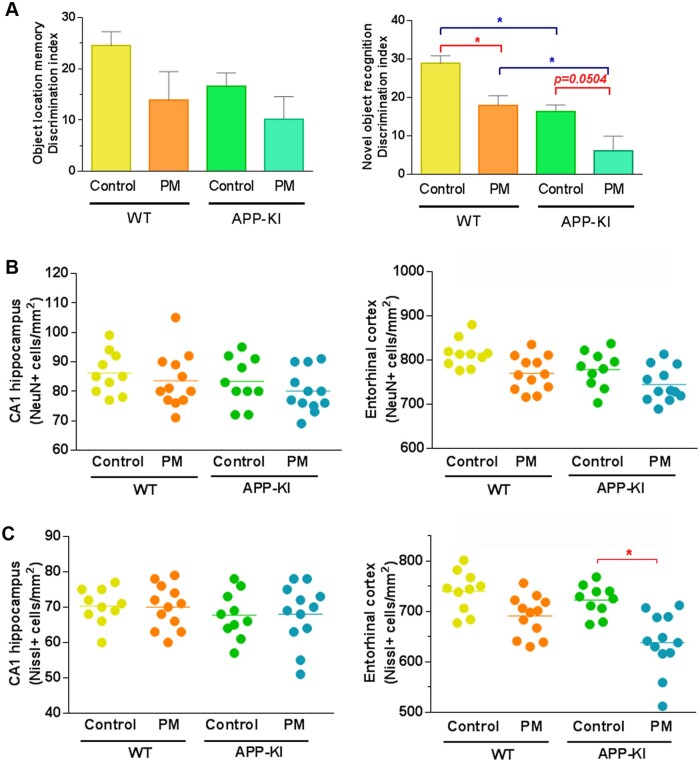
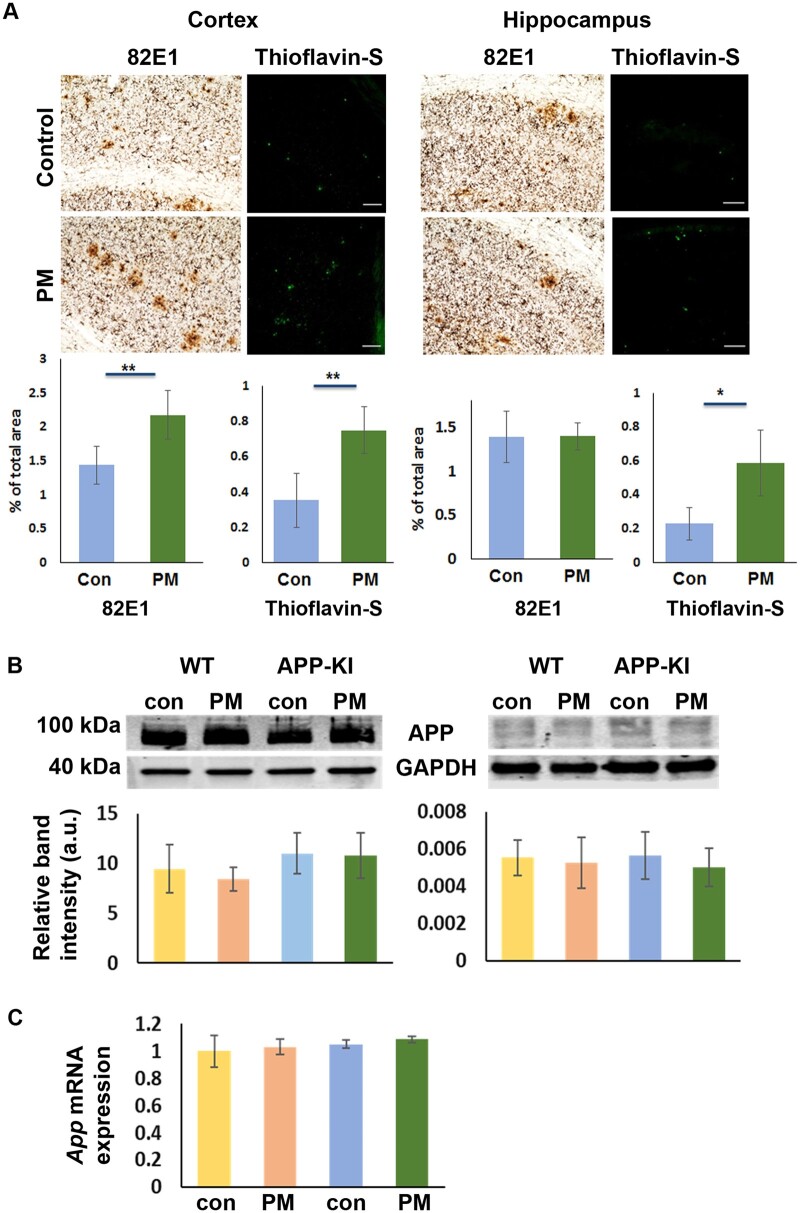
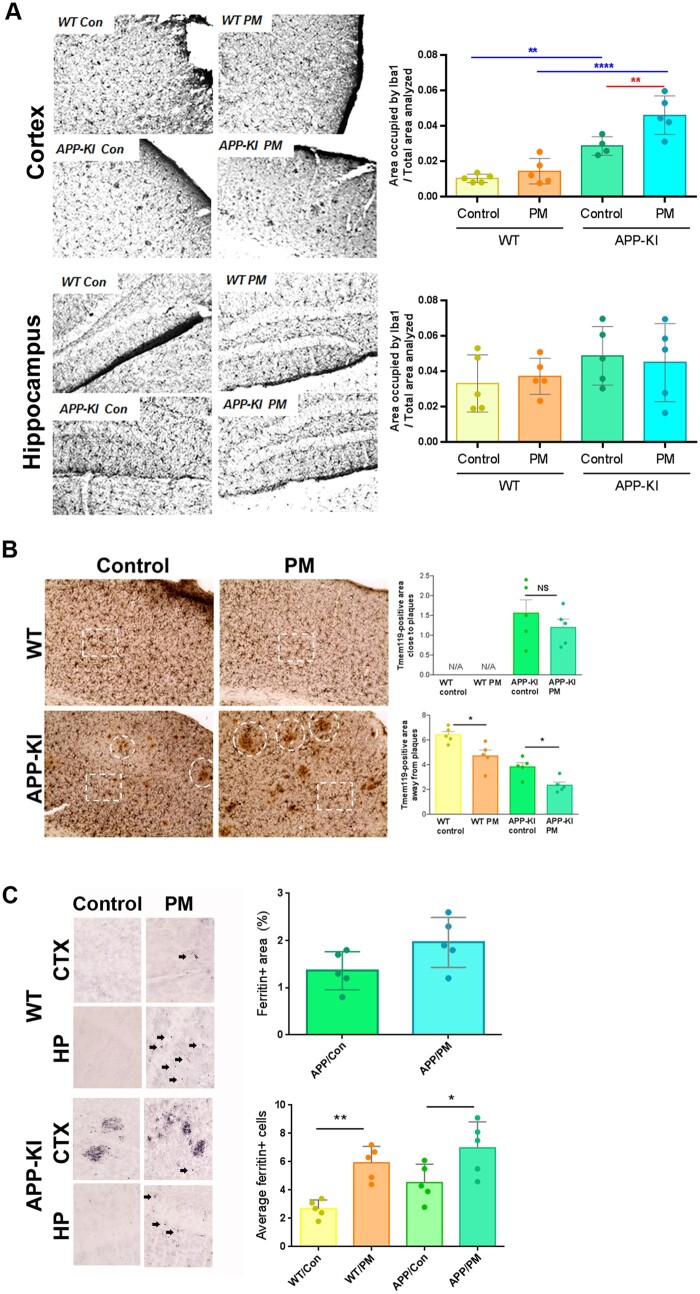
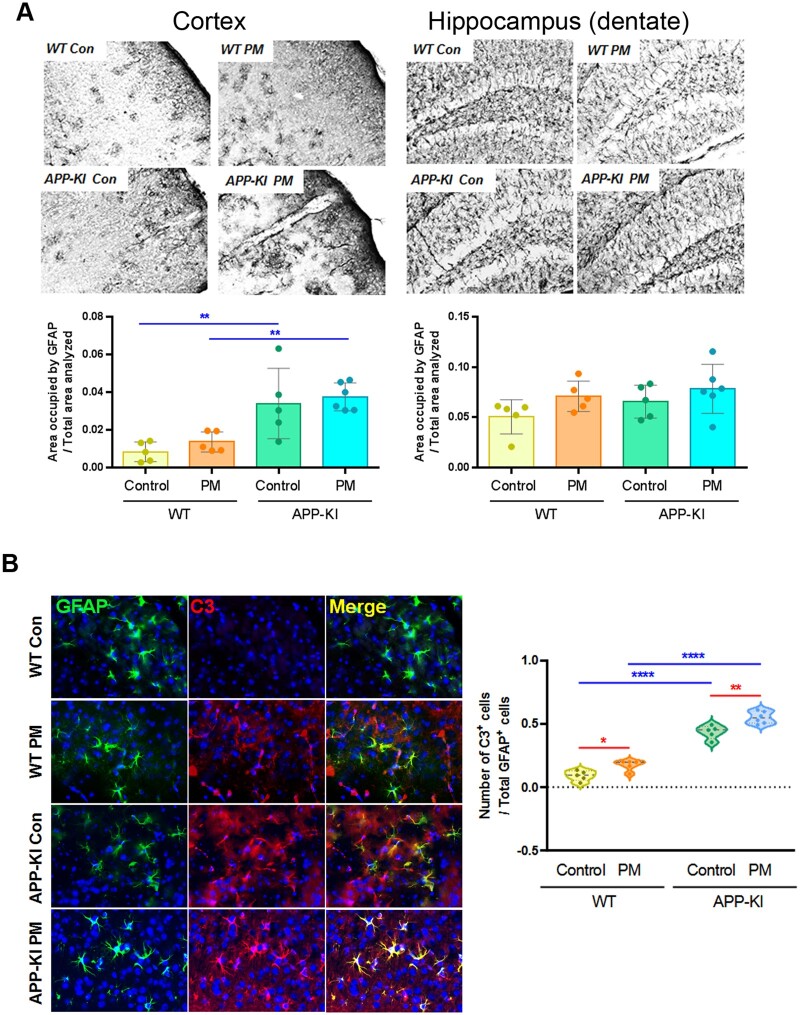
Exposure to traffic-related air pollution consisting of particulate matter (PM) is associated with cognitive decline leading to Alzheimer's disease (AD). In this study, we sought to examine the neurotoxic effects of exposure to ultrafine PM and how it exacerbates neuronal loss and AD-like neuropathology in wildtype (WT) mice and a knock-in mouse model of AD (AppNL-G-F/+-KI) when the exposure occurs at a prepathologic stage or at a later age with the presence of neuropathology. AppNL-G-F/+-KI and WT mice were exposed to concentrated ultrafine PM from local ambient air in Irvine, California, for 12 weeks, starting at 3 or 9 months of age. Particulate matter-exposed animals received concentrated ultrafine PM up to 8 times above the ambient levels, whereas control animals were exposed to purified air. Particulate matter exposure resulted in a marked impairment of memory tasks in prepathologic AppNL-G-F/+-KI mice without measurable changes in amyloid-β pathology, synaptic degeneration, and neuroinflammation. At aged, both WT and AppNL-G-F/+-KI mice exposed to PM showed a significant memory impairment along with neuronal loss. In AppNL-G-F/+-KI mice, we also detected an increased amyloid-β buildup and potentially harmful glial activation including ferritin-positive microglia and C3-positive astrocytes. Such glial activation could promote the cascade of degenerative consequences in the brain. Our results suggest that exposure to PM impairs cognitive function at both ages while exacerbation of AD-related pathology and neuronal loss may depend on the stage of pathology, aging, and/or state of glial activation. Further studies will be required to unveil the neurotoxic role of glial activation activated by PM exposure.

Keywords: Alzheimer’s disease; air pollution; inflammation; mouse model; neuronal loss.


Figures

Figure 1.
Figure 1.
Particulate matter exposure scheme and average PM concentration during the 12-week exposure. A, Schematic diagram of PM exposure on animals. In the last 3 weeks, a battery of cognitive tests was performed in the afternoon while animals continued to be exposed in the morning. B, The average particle concentration of 3–6 months exposure (left) or 9–12 months exposure (right) in particle/m3. C, The average particle mass concentration of 3–6 months exposure (left) or 9–12 months exposure (right) in µg/m3.
Figure 2.
Figure 2.
Particulate matter exposure impairs memory performance in young, prepathologic AppNL-G-F/+-KI mice. A battery of cognitive tests was initiated 3 weeks before the end of 12-week PM exposure as indicated in Figure 1A. Six months old AppNL-G-F/+-KI mice (n = 12 per group, mixed sex) underwent OLM testing (A) followed by ORM testing (B). A reduced discrimination index indicates memory impairment. Bars represent mean values, with error bars expressed as standard error of the mean (*p < .05). Con, filtered air control group; PM, concentrated quasi-ultrafine PM exposed group.
Figure 3.
Figure 3.
Particulate matter exposure does not induce changes in synaptic markers in young AppNL-G-F/+-KI mice. A, Representative images of PSD95 and synaptophysin immunofluorescent staining with fluorescent intensity quantification for the CA1 region of the hippocampus (left) and the cortex (right). B, Representative immunoblot bands of PSD95 and synaptophysin (SYP) in soluble homogenate tissue extracts from the hippocampus (left) and the whole cortex (right). Tubulin was used as a house-keeping protein to normalize band intensity. Graphs show normalized relative band intensity of PSD95 and SYP. Bars represent mean values with error bars expressed as standard error of the mean (n = 8 per group for immunostaining and n = 10 per group for immunoblot. Scale bars = 100 μm).
Figure 4.
Figure 4.
Particulate matter exposure does not exacerbate Aβ plaque burden in young AppNL-G-F/+-KI mice. A, Brain sections were stained with 82E1 antibody to detect Aβ plaques in AppNL-G-F/+-KI mice. Representative images of cortical Aβ plaque burden from the parietal cortex in AppNL-G-F/+-KI mice exposed to filtered air (control, left) and PM (right) are shown. Quantification of Aβ plaque burden was calculated and expressed as percentage of the total measured area occupied by 82E1-positive plaques in the cortex and the hippocampus (graphs on left, n = 8 per group). Soluble Aβ42 in the cortical and the hippocampal tissues was quantified by MSD and expressed in fg/μg protein (graphs on right, n = 6 per group). B, Steady-state levels of full-length APP in the cortical or hippocampal tissues were detected by immunoblot using CT20 antibody. Relative band intensity for APP was normalized with tubulin band intensity throughout the samples and expressed in the graph (n = 6 per group). C, App mRNA expression in the cortical tissue was normalized to Gapdh mRNA and expressed in the graph (n = 6 per group).
Figure 5.
Figure 5.
Glial activation was not altered in PM-exposed young AppNL-G-F/+-KI mice. A, Representative images of microglial marker Iba1 and Aβ (82E1) staining taken from the parietal cortex. Signal intensity was quantified and expressed in the graphs as the mean fluorescent intensity of Iba1 in the cortex and the hippocampus, respectively (n = 8 per group, scale bars = 100 μm). B, Representative images of astrocytic marker GFAP and Aβ (82E1) staining taken from the parietal cortex. Signal intensity was quantified and expressed in the graphs as the mean fluorescent intensity of GFAP in the cortex and the hippocampus, respectively (n = 8 per group, scale bars = 100 μm). C, mRNA expressions of pro-inflammatory cytokines Il1β and Il6 in the cortical tissue were normalized to Gapdh mRNA. Neither Il1β nor Il6 mRNA levels were significantly affected by the exposure status (n = 6 per group).
Figure 6.
Figure 6.
Particulate matter exposure accelerates memory impairment and neuronal loss in older WT and AppNL-G-F/+-KI mice. A, All WT and AppNL-G-F/+-KI mice (n = 12 per group, mixed sex) underwent OLM (left), followed by ORM (right) testing starting 3 weeks prior to the end of 12-week PM exposure. A reduced discrimination index indicates memory impairment by each test. Bars represent mean values with error bars expressed as standard error of the mean. Blue lines and asterisks indicate genotype-dependent differences (WT vs AppNL-G-F/+-KI), and red lines and asterisks indicate exposure-dependent differences (filtered air vs PM exposure) detected between the two groups (*p < .05). B, Graphs represent the number of NeuN+ neurons in the CA1 hippocampus (left) and entorhinal cortex (right). C, Graphs represent the number of neurons by Nissl staining in the CA1 hippocampus (left) and entorhinal cortex (right). Each NeuN and Nissl staining was performed in 2 separate brain sections per animal. Red line and asterisk indicate an exposure-dependent change in the neuronal counts (n = 5–6 animals per group, *p < .05).
Figure 7.
Figure 7.
Amyloid-β plaque burden is exacerbated by PM exposure in old AppNL-G-F/+-KI mice. Brain sections were stained with 82E1 antibody and Thioflavin S to detect diffuse and dense core Aβ plaques in AppNL-G-F/+-KI mice. A, Representative images of Aβ plaque burden detected by 82E1 antibody and Thioflavin S from the parietal cortex (left) and CA1 region of the hippocampus (right) in AppNL-G-F/+-KI mice exposed to filtered air or PM. Quantification of plaque burden by these 2 stained images is expressed as the percentage of the total measured area occupied by plaques (n = 6 per group, scale bars = 100 μm, *p < .05 or **p < .01). B, Steady-state levels of full-length APP in the cortical or hippocampal tissue were detected by immunoblots and expressed as the mean ± S.E.M with band intensity normalized using GAPDH (n = 4 per group). C, App mRNA expression in the cortex was measured by qPCR and normalized with Gapdh mRNA (n = 4 per group).
Figure 8.
Figure 8.
Degenerative microglia activation is increased by PM exposure in both WT and AppNL-G-F/+-KI mice. A, Brain sections were stained with Iba1 antibody to detect microglia. Area covered by Iba1 staining was quantified in the cortex (left) and the hippocampus (right) separately and compared among the groups. Graphs represent the mean ± S.E.M. (n = 5 per group). Blue lines and asterisks indicate genotype-dependent differences (WT vs AppNL-G-F/+-KI) while red lines and asterisks indicate exposure-dependent differences (filtered air vs PM exposure) detected between the 2 groups (**p < .01, ****p < .0001). B, Brain sections were costained with Tmem119 (dark blue/black) and Aβ plaques (82E1 antibody, brown). Tmem119+ microglia were analyzed around plaques (ie, dotted circle, top graph) or away from plaques (ie, dotted square, bottom graph) in the cortex. Graphs represent the mean ± S.E.M (n = 5–6 per group, *p < .05). C, Area covered by ferritin+ microglia were quantified in the brain of AppNL-G-F/+-KI mice (n = 5 per group). Arrows in magnified images indicate representative ferritin-positive microglia-like single cells in each group. Top graph shows area covered by ferritin-positive staining in both the cortex and the hippocampus, and bottom graph shows the average number of ferritin-positive single cells in the cortex and hippocampus of each group (n = 5 per group, *p < .05, **p < .01 between the indicated groups).
Figure 9.
Figure 9.
Neurotoxic astrocyte activation is exacerbated by PM exposure in AppNL-G-F/+-KI mice. A, Brain sections were stained with GFAP antibody to detect astrocytes. Area covered by GFAP staining was quantified in the cortex (left) and the hippocampus (right) separately and compared among the groups. Graphs represent the mean ± S.E.M. (n = 5–6 per group). Blue lines and asterisks indicate genotype-dependent differences (WT vs AppNL-G-F/+-KI). **p < .01 between the indicated groups. B, Brain sections were costained with GFAP and C3, and nuclei were stained with DAPI. Double positive GFAP+/C3+ astrocytes in the cortex were counted and expressed as percent of total GFAP+ cell counts in the graph. Blue lines and asterisks indicate genotype-dependent differences (WT vs AppNL-G-F/+-KI) while red lines and asterisks indicate exposure-dependent differences (filtered air vs PM exposure) detected between the 2 groups (*p < .05, **p < .01, ****p < .0001).

Similar articles

Cited by

References

    1. Bhatt D. P., Puig K. L., Gorr M. W., Wold L. E., Combs C. K. (2015). A pilot study to assess effects of long-term inhalation of airborne particulate matter on early Alzheimer-like changes in the mouse brain. PLoS One 10, e0127102. - PMC - PubMed
    1. Billings L. M., Green K. N., McGaugh J. L., LaFerla F. M. (2007). Learning decreases A beta56 and tau pathology and ameliorates behavioral decline in 3xTg-AD mice. J. Neurosci. 27, 751–761. - PMC - PubMed
    1. Block M. L., Calderon-Garciduenas L. (2009). Air pollution: Mechanisms of neuroinflammation and CNS disease. Trends Neurosci. 32, 506–516. - PMC - PubMed
    1. Bonham L. W., Sirkis D. W., Yokoyama J. S. (2019). The transcriptional landscape of microglial genes in aging and neurodegenerative disease. Front. Immunol. 10, 1170. - PMC - PubMed
    1. Bowe B., Xie Y., Yan Y., Al-Aly Z. (2019). Burden of cause-specific mortality associated with PM2.5 air pollution in the United States. JAMA Netw. Open 2, e1915834. - PMC - PubMed

Publication types