. 2023 May 26;224(2):iyad070.
doi: 10.1093/genetics/iyad070.

A rarefaction approach for measuring population differences in rare and common variation

Affiliations

A rarefaction approach for measuring population differences in rare and common variation

Daniel J Cotter et al. Genetics. .

Abstract

In studying allele-frequency variation across populations, it is often convenient to classify an allelic type as "rare," with nonzero frequency less than or equal to a specified threshold, "common," with a frequency above the threshold, or entirely unobserved in a population. When sample sizes differ across populations, however, especially if the threshold separating "rare" and "common" corresponds to a small number of observed copies of an allelic type, discreteness effects can lead a sample from one population to possess substantially more rare allelic types than a sample from another population, even if the two populations have extremely similar underlying allele-frequency distributions across loci. We introduce a rarefaction-based sample-size correction for use in comparing rare and common variation across multiple populations whose sample sizes potentially differ. We use our approach to examine rare and common variation in worldwide human populations, finding that the sample-size correction introduces subtle differences relative to analyses that use the full available sample sizes. We introduce several ways in which the rarefaction approach can be applied: we explore the dependence of allele classifications on subsample sizes, we permit more than two classes of allelic types of nonzero frequency, and we analyze rare and common variation in sliding windows along the genome. The results can assist in clarifying similarities and differences in allele-frequency patterns across populations.

Keywords: common variants; rare variants; rarefaction; sample-size correction.


Conflict of interest statement

Conflicts of interest The authors declare no conflict of interest.

Figures

Fig. 1.
Fig. 1.
Probability that the globally minor allele at a locus has a given geographic distribution pattern as a function of g, the number of alleles sampled in each super-population (equation 4). a) All SNPs on chromosome 22. b) All nonsingleton SNPs on chromosome 22. c) All SNPs on chromosome 22, normalizing by 1P[UUUUU]. d) All nonsingleton SNPs on chromosome 22, normalizing by 1P[UUUUU]. In a five-letter pattern, U is unobserved, R is rare (>0% and ≤5% population frequency), and C is common (>5%). The order in which super-populations are listed is Africa, Europe, South Asia, East Asia, and the Americas. For example, RUUUU refers to a minor allele that is rare in Africa and unobserved in each of the other four super-populations.
Fig. 2.
Fig. 2.
Probability as a function of the sample size g that across SNPs on chromosome 22, the highest-probability non-UUUUU pattern calculated using a sample-size correction (equation 4) matches the empirically observed pattern without sample-size correction.
Fig. 3.
Fig. 3.
Pattern probabilities at g=10 and g=500 compared to non-sample-size-corrected pattern probabilities. The sample-size-corrected and non-sample-size-corrected probabilities are calculated on chromosome 22. a) All SNPs on chromosome 22, as in Fig. 1c, with non-sample-size-corrected pattern probabilities depicted analogously to Fig. 3b of Biddanda et al. (2020). b) Nonsingleton SNPs on chromosome 22, as in Fig. 1d, with non-sample-size-corrected pattern probabilities depicted analogously to Fig. 3c of Biddanda et al. (2020). The colors used to depict pattern probabilities for g=10 and g=500 are the same as those used in Fig. 1.
Fig. 4.
Fig. 4.
Probabilities for groups of patterns for a nonsingleton minor allele on chromosome 22, in samples containing g=500 alleles from each super-population. The figure summarizes the g=500 column of Fig. 1b, tabulating the numbers of super-populations in which allelic types are unobserved, rare, and common. An ordered triple is written (|U|,|R|,|C|), so that, for example, 2.84% for the entry (0,1,4) indicates that 2.84% of allelic types are unobserved in 0 super-populations, rare in 1 super-population, and common in 4 super-populations.
Fig. 5.
Fig. 5.
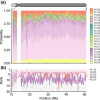
Probabilities for groups of patterns for minor alleles on chromosome 22, in samples containing g=500 alleles from each super-population, averaged across all nonsingleton loci in nonoverlapping 100-kb sliding windows. Ordered triples are written (|U|,|R|,|C|), with the entries representing the numbers of super-populations in which allelic types are unobserved, rare, and common, respectively. Triples are grouped by color, varying within classes with a given number of super-populations in which allelic types are common. a) Probabilities for pattern groups. b) Local frequency ranks of pattern groups, from 1 to 20 (the pattern in which allelic types are unobserved in all super-populations, (5,0,0), is excluded). For simplicity, only those pattern groups that achieve frequency rank 1 or 2 in at least one window on the chromosome receive a color. The remaining pattern groups are shaded gray. Note that the first 10 Mb of chromosome 22 are excluded, as they do not appear in the 1000 Genomes dataset; the centromere is also excluded.
Fig. 6.
Fig. 6.
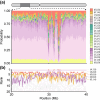
Probabilities for pattern groups for minor alleles of nonsingleton loci appearing between 20 and 40 Mb on chromosome 6, covering the HLA region (approximately 28.5–33.5 Mb on reference build hg38). The data analysis and figure design follow Fig. 5. a) Probabilities for pattern groups. b) Local frequency ranks of pattern groups.

References

    1. The 1000 Genomes Project Consortium . A global reference for human genetic variation. Nature. 2015;526:68–74. - PMC - PubMed
    1. Battey CJ, Coffing GC, Kern AD. Visualizing population structure with variational autoencoders. G3. 2021;11:jkaa036. doi:10.1093/g3journal/jkaa036 - DOI - PMC - PubMed
    1. Biddanda A, Rice DP, Novembre J. A variant-centric perspective on geographic patterns of human allele frequency variation. eLife. 2020;9:e60107. doi:10.7554/eLife.60107 - DOI - PMC - PubMed
    1. Brandt DYC, Aguiar VRC, Bitarello BD, Nunes K, Goudet J, Meyer D. Mapping bias overestimates reference allele frequencies at the HLA genes in the 1000 Genomes Project phase I data. G3. 2015;5:931–941. doi:10.1534/g3.114.015784 - DOI - PMC - PubMed
    1. Byrska-Bishop M, Evani US, Zhao X, Basile AO, Abel HJ, Regier AA, Corvelo A, Clarke WE, Musunuri R, Nagulapalli K, et al. High-coverage whole-genome sequencing of the expanded 1000 genomes project cohort including 602 trios. Cell. 2022;185:3426–3440.e19. doi:10.1016/j.cell.2022.08.004 - DOI - PMC - PubMed

Publication types