Simultaneous Fe2+/Fe3+ imaging shows Fe3+ over Fe2+ enrichment in Alzheimer's disease mouse brain
- PMID: 37075105
- PMCID: PMC10115418
- DOI: 10.1126/sciadv.ade7622
Simultaneous Fe2+/Fe3+ imaging shows Fe3+ over Fe2+ enrichment in Alzheimer's disease mouse brain
Abstract
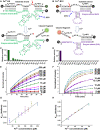
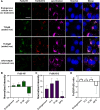
Visualizing redox-active metal ions, such as Fe2+ and Fe3+ ions, are essential for understanding their roles in biological processes and human diseases. Despite the development of imaging probes and techniques, imaging both Fe2+ and Fe3+ simultaneously in living cells with high selectivity and sensitivity has not been reported. Here, we selected and developed DNAzyme-based fluorescent turn-on sensors that are selective for either Fe2+ or Fe3+, revealing a decreased Fe3+/Fe2+ ratio during ferroptosis and an increased Fe3+/Fe2+ ratio in Alzheimer's disease mouse brain. The elevated Fe3+/Fe2+ ratio was mainly observed in amyloid plaque regions, suggesting a correlation between amyloid plaques and the accumulation of Fe3+ and/or conversion of Fe2+ to Fe3+. Our sensors can provide deep insights into the biological roles of labile iron redox cycling.
Figures


Similar articles
-
Label-Free In Situ Chemical Characterization of Amyloid Plaques in Human Brain Tissues.ACS Chem Neurosci. 2024 Apr 3;15(7):1469-1483. doi: 10.1021/acschemneuro.3c00756. Epub 2024 Mar 19. ACS Chem Neurosci. 2024. PMID: 38501754 Free PMC article.
-
Virtual histology of Alzheimer's disease: Biometal entrapment within amyloid-β plaques allows for detection via X-ray phase-contrast imaging.Acta Biomater. 2023 Oct 15;170:260-272. doi: 10.1016/j.actbio.2023.07.046. Epub 2023 Aug 11. Acta Biomater. 2023. PMID: 37574159
-
Redox-Active Metal Ions and Amyloid-Degrading Enzymes in Alzheimer's Disease.Int J Mol Sci. 2021 Jul 19;22(14):7697. doi: 10.3390/ijms22147697. Int J Mol Sci. 2021. PMID: 34299316 Free PMC article. Review.
-
Imaging beta amyloid aggregation and iron accumulation in Alzheimer's disease using quantitative susceptibility mapping MRI.Neuroimage. 2019 May 1;191:176-185. doi: 10.1016/j.neuroimage.2019.02.019. Epub 2019 Feb 7. Neuroimage. 2019. PMID: 30739060
-
[Development of SPECT Probes for In Vivo Imaging of β-Amyloid and Tau Aggregates in the Alzheimer's Disease Brain].Yakugaku Zasshi. 2017;137(11):1361-1365. doi: 10.1248/yakushi.17-00156. Yakugaku Zasshi. 2017. PMID: 29093372 Review. Japanese.
Cited by
-
An exploratory research report on brain mineralization in postoperative delirium and cognitive decline.Eur J Neurosci. 2024 May;59(10):2646-2664. doi: 10.1111/ejn.16282. Epub 2024 Feb 21. Eur J Neurosci. 2024. PMID: 38379517 Free PMC article.
-
Decoding Potassium Homeostasis in Cancer Metastasis and Drug Resistance: Insights from a Highly Selective DNAzyme-Based Intracellular K+ Sensor.J Am Chem Soc. 2025 May 28;147(21):18074-18087. doi: 10.1021/jacs.5c03781. Epub 2025 May 14. J Am Chem Soc. 2025. PMID: 40367066
-
Protective Roles of Hydrogen Sulfide in Alzheimer's Disease and Traumatic Brain Injury.Antioxidants (Basel). 2023 May 13;12(5):1095. doi: 10.3390/antiox12051095. Antioxidants (Basel). 2023. PMID: 37237961 Free PMC article. Review.
-
Ratiometric Detection of Zn2+ Using DNAzyme-Based Bioluminescence Resonance Energy Transfer Sensors.Chemistry (Basel). 2023 Sep;5(3):1745-1759. doi: 10.3390/chemistry5030119. Epub 2023 Aug 8. Chemistry (Basel). 2023. PMID: 38371491 Free PMC article.
-
Structural and mechanistic insights into disease-associated endolysosomal exonucleases PLD3 and PLD4.Structure. 2024 Jun 6;32(6):766-779.e7. doi: 10.1016/j.str.2024.02.019. Epub 2024 Mar 26. Structure. 2024. PMID: 38537643 Free PMC article.
References
-
- D. Galaris, A. Barbouti, K. Pantopoulos, Iron homeostasis and oxidative stress: An intimate relationship. Biochim. Biophys. Acta Mol. Cell Res. 1866, 118535 (2019). - PubMed
-
- E. L. Que, D. W. Domaille, C. J. Chang, Metals in neurobiology: Probing their chemistry and biology with molecular imaging. Chem. Rev. 108, 1517–1549 (2008). - PubMed
-
- J. M. Braughler, L. A. Duncan, R. L. Chase, The involvement of iron in lipid peroxidation. Importance of ferric to ferrous ratios in initiation. J. Biol. Chem. 261, 10282–10289 (1986). - PubMed
MeSH terms
Substances
Grants and funding
LinkOut - more resources
Full Text Sources
Medical
Molecular Biology Databases

