. 2023 Apr 21;9(16):eadd7572.
doi: 10.1126/sciadv.add7572. Epub 2023 Apr 19.

Local brain oscillations and interregional connectivity differentially serve sensory and expectation effects on pain

Affiliations

Local brain oscillations and interregional connectivity differentially serve sensory and expectation effects on pain

Felix S Bott et al. Sci Adv. .

Abstract

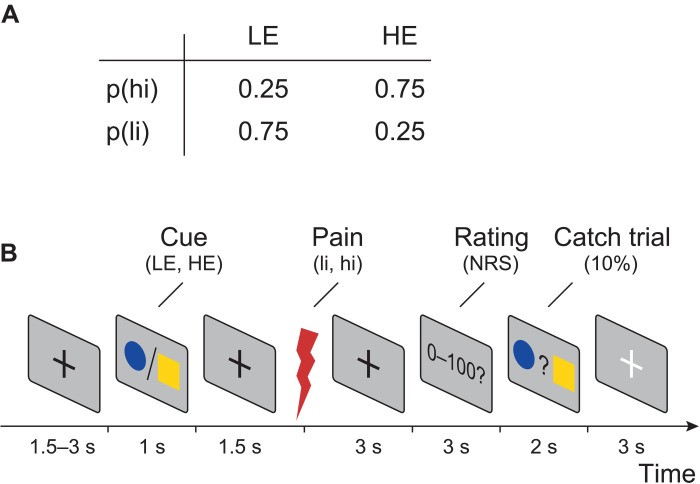
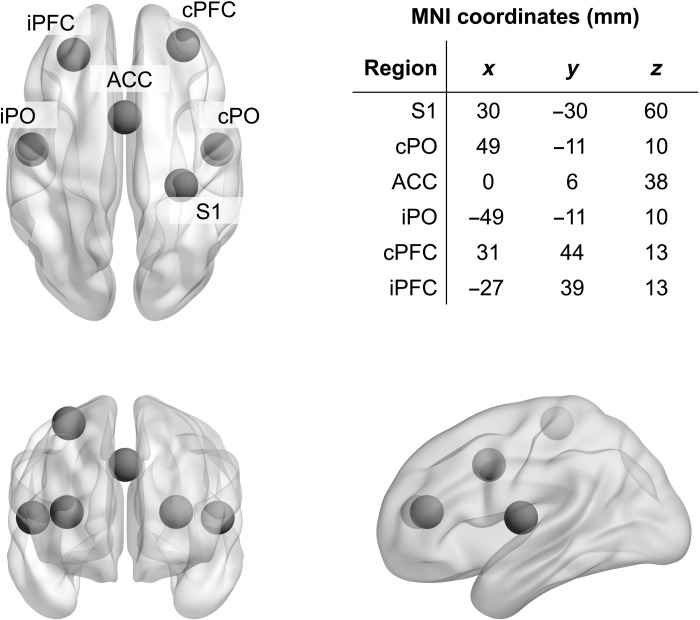
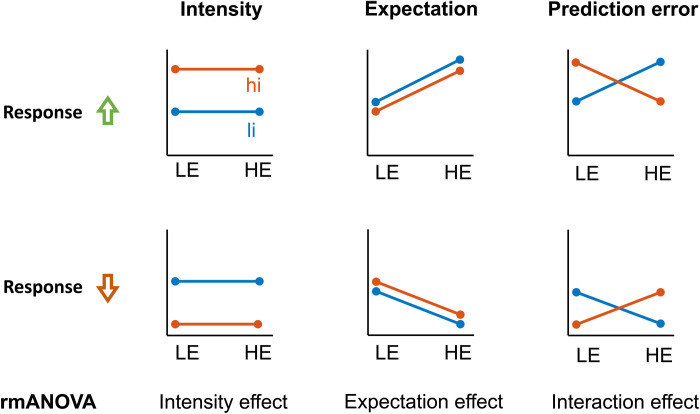
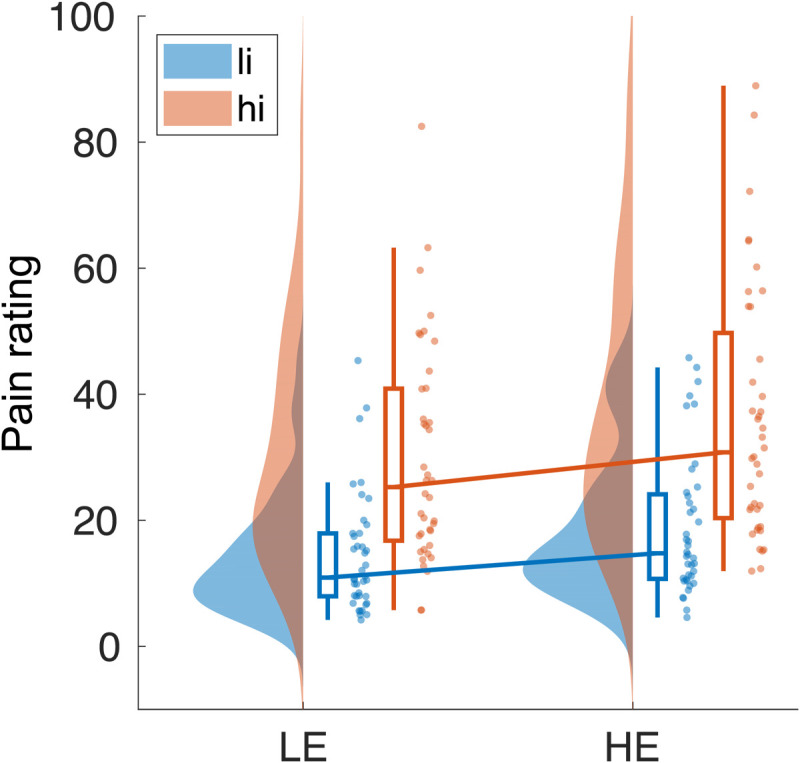
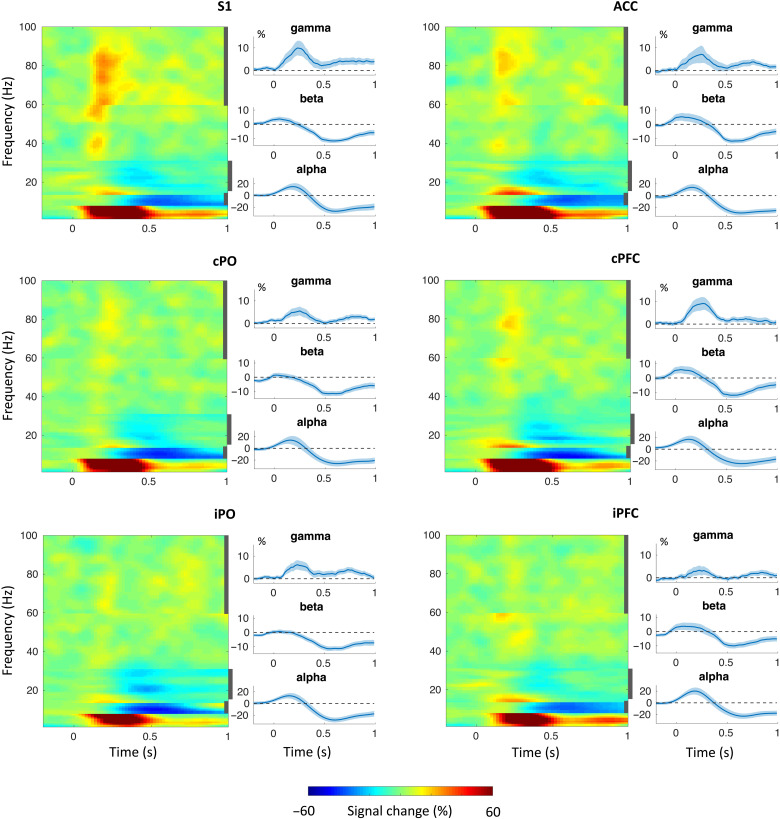
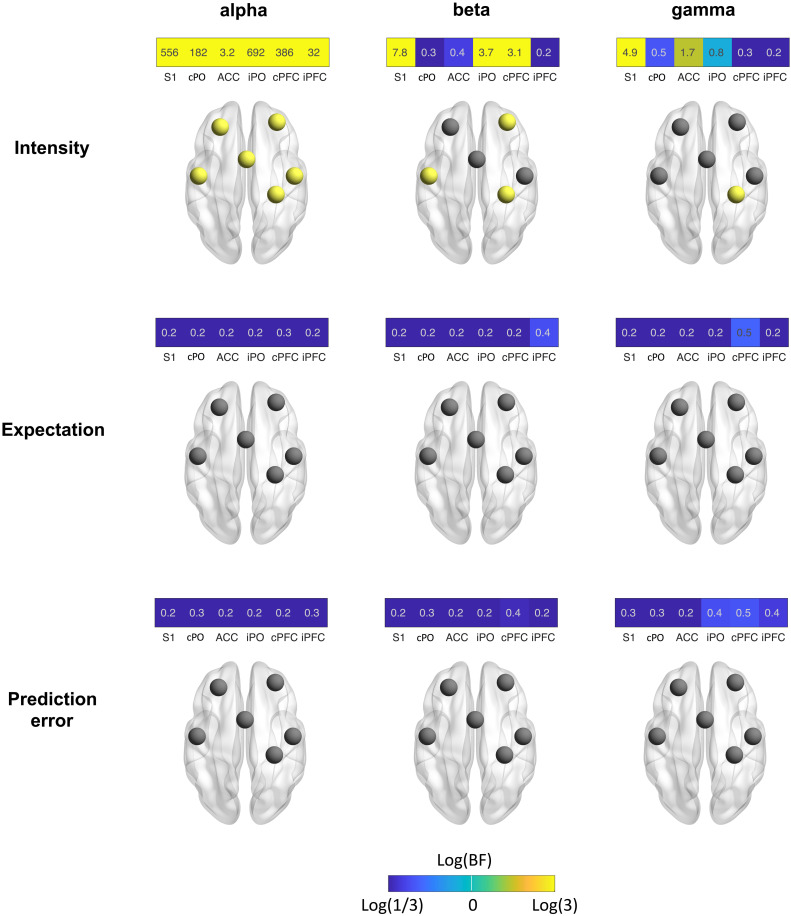
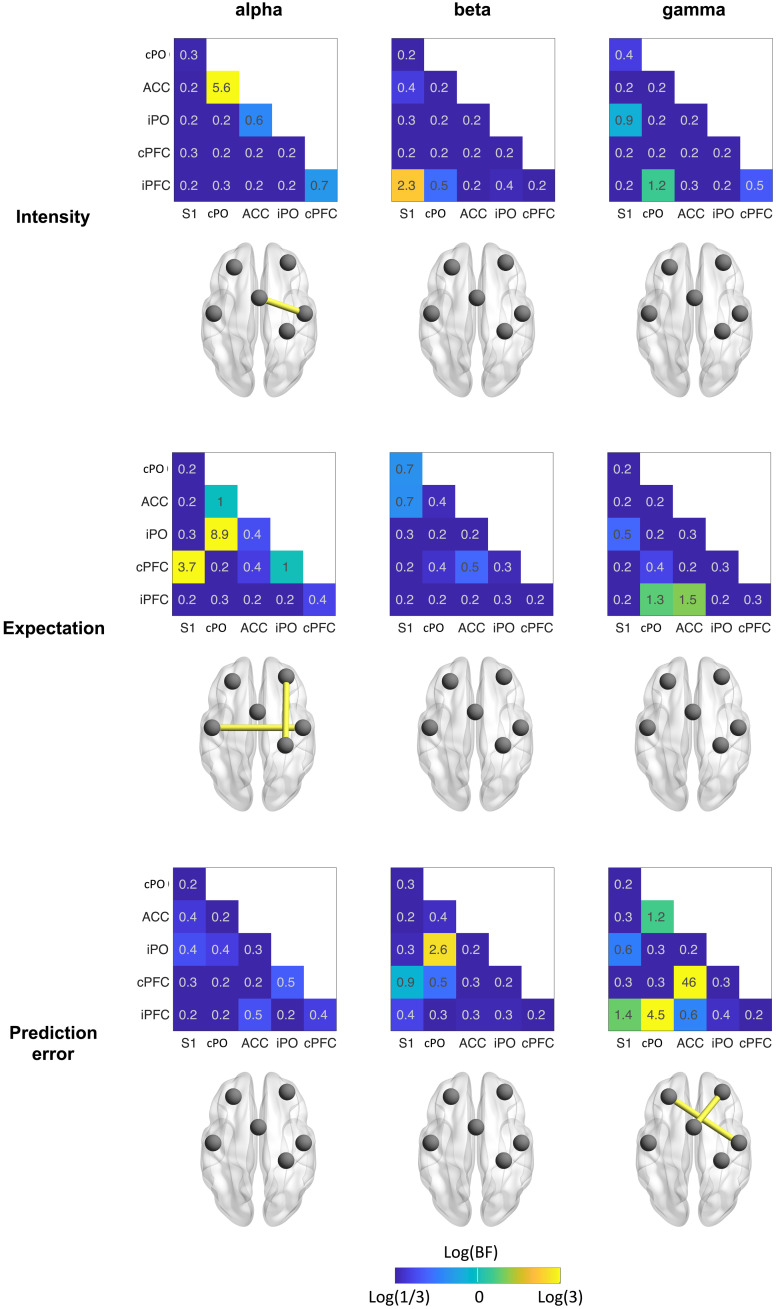
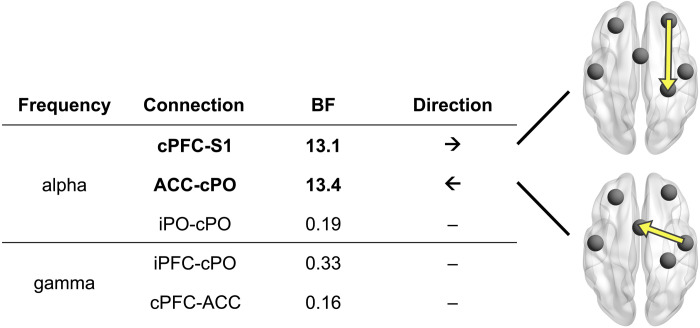
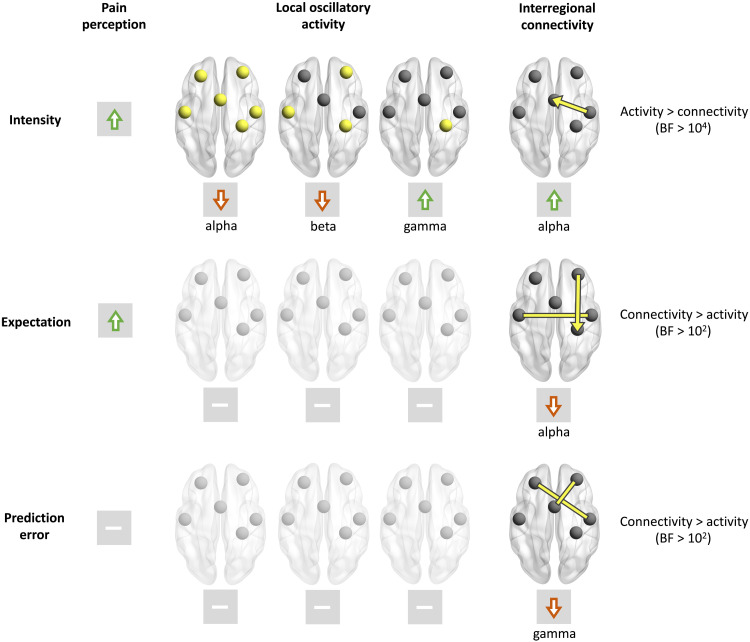
Pain emerges from the integration of sensory information about threats and contextual information such as an individual's expectations. However, how sensory and contextual effects on pain are served by the brain is not fully understood so far. To address this question, we applied brief painful stimuli to 40 healthy human participants and independently varied stimulus intensity and expectations. Concurrently, we recorded electroencephalography. We assessed local oscillatory brain activity and interregional functional connectivity in a network of six brain regions playing key roles in the processing of pain. We found that sensory information predominantly influenced local brain oscillations. In contrast, expectations exclusively influenced interregional connectivity. Specifically, expectations altered connectivity at alpha (8 to 12 hertz) frequencies from prefrontal to somatosensory cortex. Moreover, discrepancies between sensory information and expectations, i.e., prediction errors, influenced connectivity at gamma (60 to 100 hertz) frequencies. These findings reveal how fundamentally different brain mechanisms serve sensory and contextual effects on pain.


Figures

Fig. 1.
Fig. 1.. Experimental design.
(A) Probabilities of different pain stimulus intensities [low intensity (li) and high intensity (hi)] for different levels of expectation [low expectation (LE) and high expectation (HE)]. (B) In each trial, a cue was presented that probabilistically predicted the intensity of a subsequent painful stimulus. Three seconds after the stimulus, a verbal pain rating was obtained from the participants. In 10% of the trials (catch trials), participants were visually prompted to indicate by a button press whether a HE or a LE cue had been presented to ensure that participants continuously paid attention to the visual cues. More details on the experimental design can be found in (23).
Fig. 2.
Fig. 2.. ROI and corresponding MNI coordinates.
Axial, coronal, and sagittal view of the brain and the six regions of interest (ROIs). S1, contralateral primary somatosensory cortex; cPO and iPO, contra- and ipsilateral parietal operculum; ACC, anterior cingulate cortex; cPFC and iPFC, contra- and ipsilateral prefrontal cortex. Please note that the asymmetry of the PFC ROIs reflects the asymmetry of PFC sources found in (31).
Fig. 3.
Fig. 3.. Possible response patterns indicating the effects of stimulus intensity, expectations, and (absolute) PEs.
Effects of stimulus intensity (li and hi), expectations (LE and HE), and PEs were tested by means of repeated measures analyses of variance (rmANOVAs). An experimental modulation can lead to either a relative increase (first row) or relative decrease (second row) of oscillatory activity or connectivity.
Fig. 4.
Fig. 4.. Effects of stimulus intensity, expectations, and PEs on pain ratings.
Rain cloud plot (67) of pain ratings for two levels of stimulus intensity (li and hi) and expectation (LE and HE). A Bayesian rmANOVA yielded decisive evidence for main effects of stimulus intensity and expectation [Bayes factor (BF) = 1.1 × 10²¹ and BF = 5.5 × 10², respectively]. Moreover, there was moderate evidence against an interaction (BF = 0.27).
Fig. 5.
Fig. 5.. TFRs based on hi trials of local oscillatory brain activity in the six ROIs.
The first and third columns show concatenated band specific time-frequency representations (TFRs) for all six ROIs. The sharp transitions in the TFRs are due to the employment of frequency band-specific spatial filters. The second and fourth columns show time courses of brain activity in the alpha, beta, and gamma band. Vertical, dark gray bars in the TFR plots indicate the frequency intervals based on which the time courses of brain activity were computed.
Fig. 6.
Fig. 6.. Effects of stimulus intensity, expectations, and PEs on local brain activity.
Effects were assessed by Bayesian rmANOVAs with the factors intensity and expectation. The color of the tiles representing ROIs scales with the log of the BF. It ranges from blue (BF < 0.33, at least moderate evidence against an effect) to yellow (BF > 3, at least moderate evidence for an effect). Brain images display ROIs in yellow, which exhibit at least moderate evidence for an effect (BF > 3).
Fig. 7.
Fig. 7.. Effects of stimulus intensity, expectations, and PEs on interregional functional connectivity.
Effects were assessed by Bayesian rmANOVA with the factors intensity and expectation. The color of the heat map tiles scales with the log of the BF. It ranges from blue (BF < 0.33, at least moderate evidence against an effect) to yellow (BF > 3, at least moderate evidence for an effect). Brain images display connections in yellow which exhibit at least moderate evidence for an effect (BF > 3).
Fig. 8.
Fig. 8.. Direction of functional connectivity.
Using an asymmetry score based on the PDC connectivity metric, we assessed the direction of information flow in connections that exhibited evidence for an effect in the previous connectivity analysis. Brain images depict connections with strong evidence for asymmetric information flow. The arrows indicate the dominant direction of information flow.
Fig. 9.
Fig. 9.. Synopsis of the effects of stimulus intensity, expectations, and PEs on pain perception, local brain activity, and interregional functional connectivity.
Increases of stimulus intensity led to increases of pain ratings and local brain activity at gamma frequencies as well as to decreases of brain activity at alpha and beta frequencies. Expectations of stronger pain yielded increases of pain ratings and reduced connectivity between cPO and iPO and from cPFC to S1 at alpha frequencies. In contrast, expectations did not modulate local brain activity at any ROI and any frequency band. PEs did not change pain ratings or local brain activity but iPFC-cPO and cPFC-ACC connectivity at gamma frequencies. The last column shows the results of a Bayesian comparison of local brain activity and connectivity models predicting intensity, expectation, and PEs.

References

    1. L. Y. Atlas, T. D. Wager, How expectations shape pain. Neurosci. Lett. 520, 140–148 (2012). - PubMed
    1. H. L. Fields, How expectations influence pain. Pain 159, S3–S10 (2018). - PubMed
    1. K. J. Peerdeman, A. I. van Laarhoven, M. L. Peters, A. W. Evers, An integrative review of the influence of expectancies on pain. Front. Psychol. 7, 1270 (2016). - PMC - PubMed
    1. P. Enck, U. Bingel, M. Schedlowski, W. Rief, The placebo response in medicine: Minimize, maximize or personalize? Nat. Rev. Drug Discov. 12, 191–204 (2013). - PubMed
    1. D. G. Finniss, T. J. Kaptchuk, F. Miller, F. Benedetti, Biological, clinical, and ethical advances of placebo effects. Lancet 375, 686–695 (2010). - PMC - PubMed