Randomized Controlled Trial
. 2023 Apr 19;15(692):eade9078.
doi: 10.1126/scitranslmed.ade9078. Epub 2023 Apr 19.

Comparing antibody assays as correlates of protection against COVID-19 in the COVE mRNA-1273 vaccine efficacy trial

Affiliations
Randomized Controlled Trial

Comparing antibody assays as correlates of protection against COVID-19 in the COVE mRNA-1273 vaccine efficacy trial

David Benkeser et al. Sci Transl Med. .

Abstract

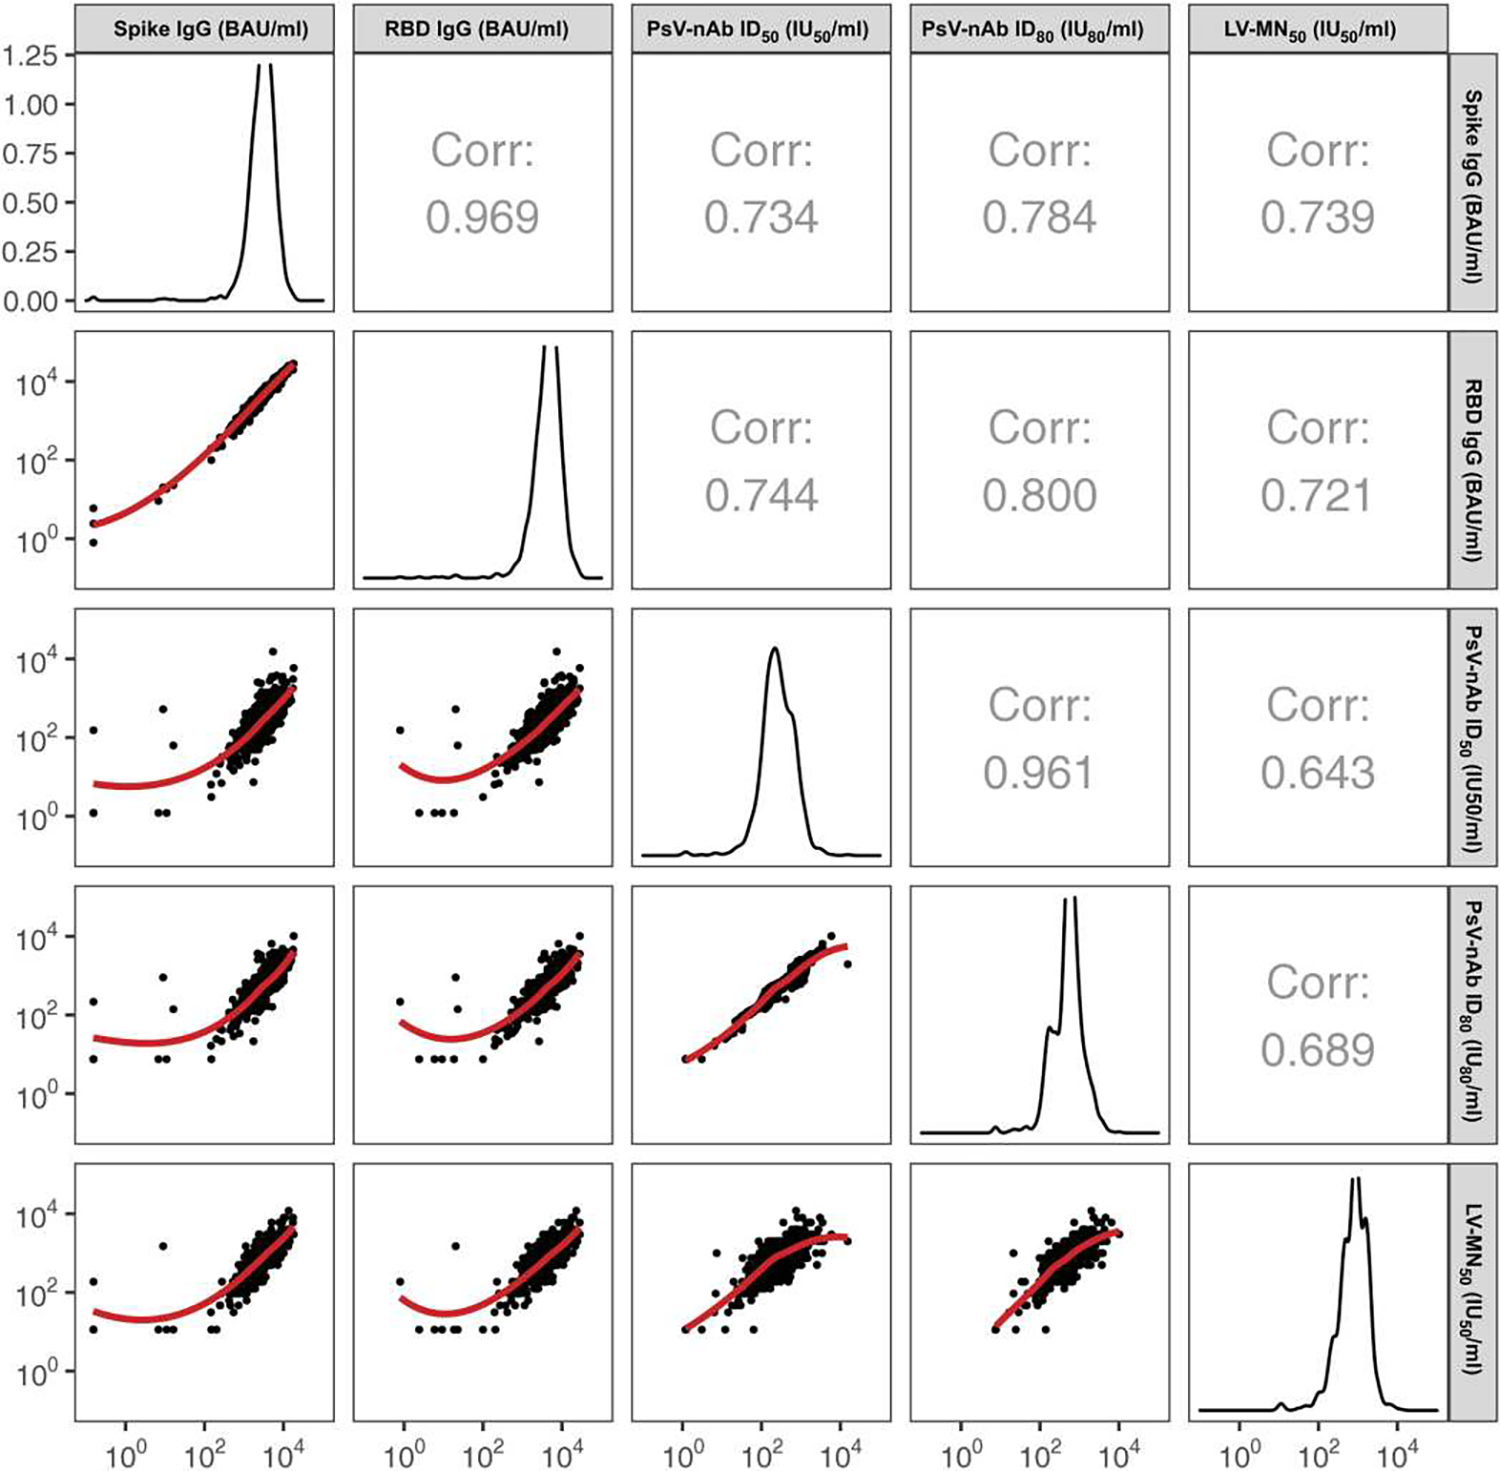
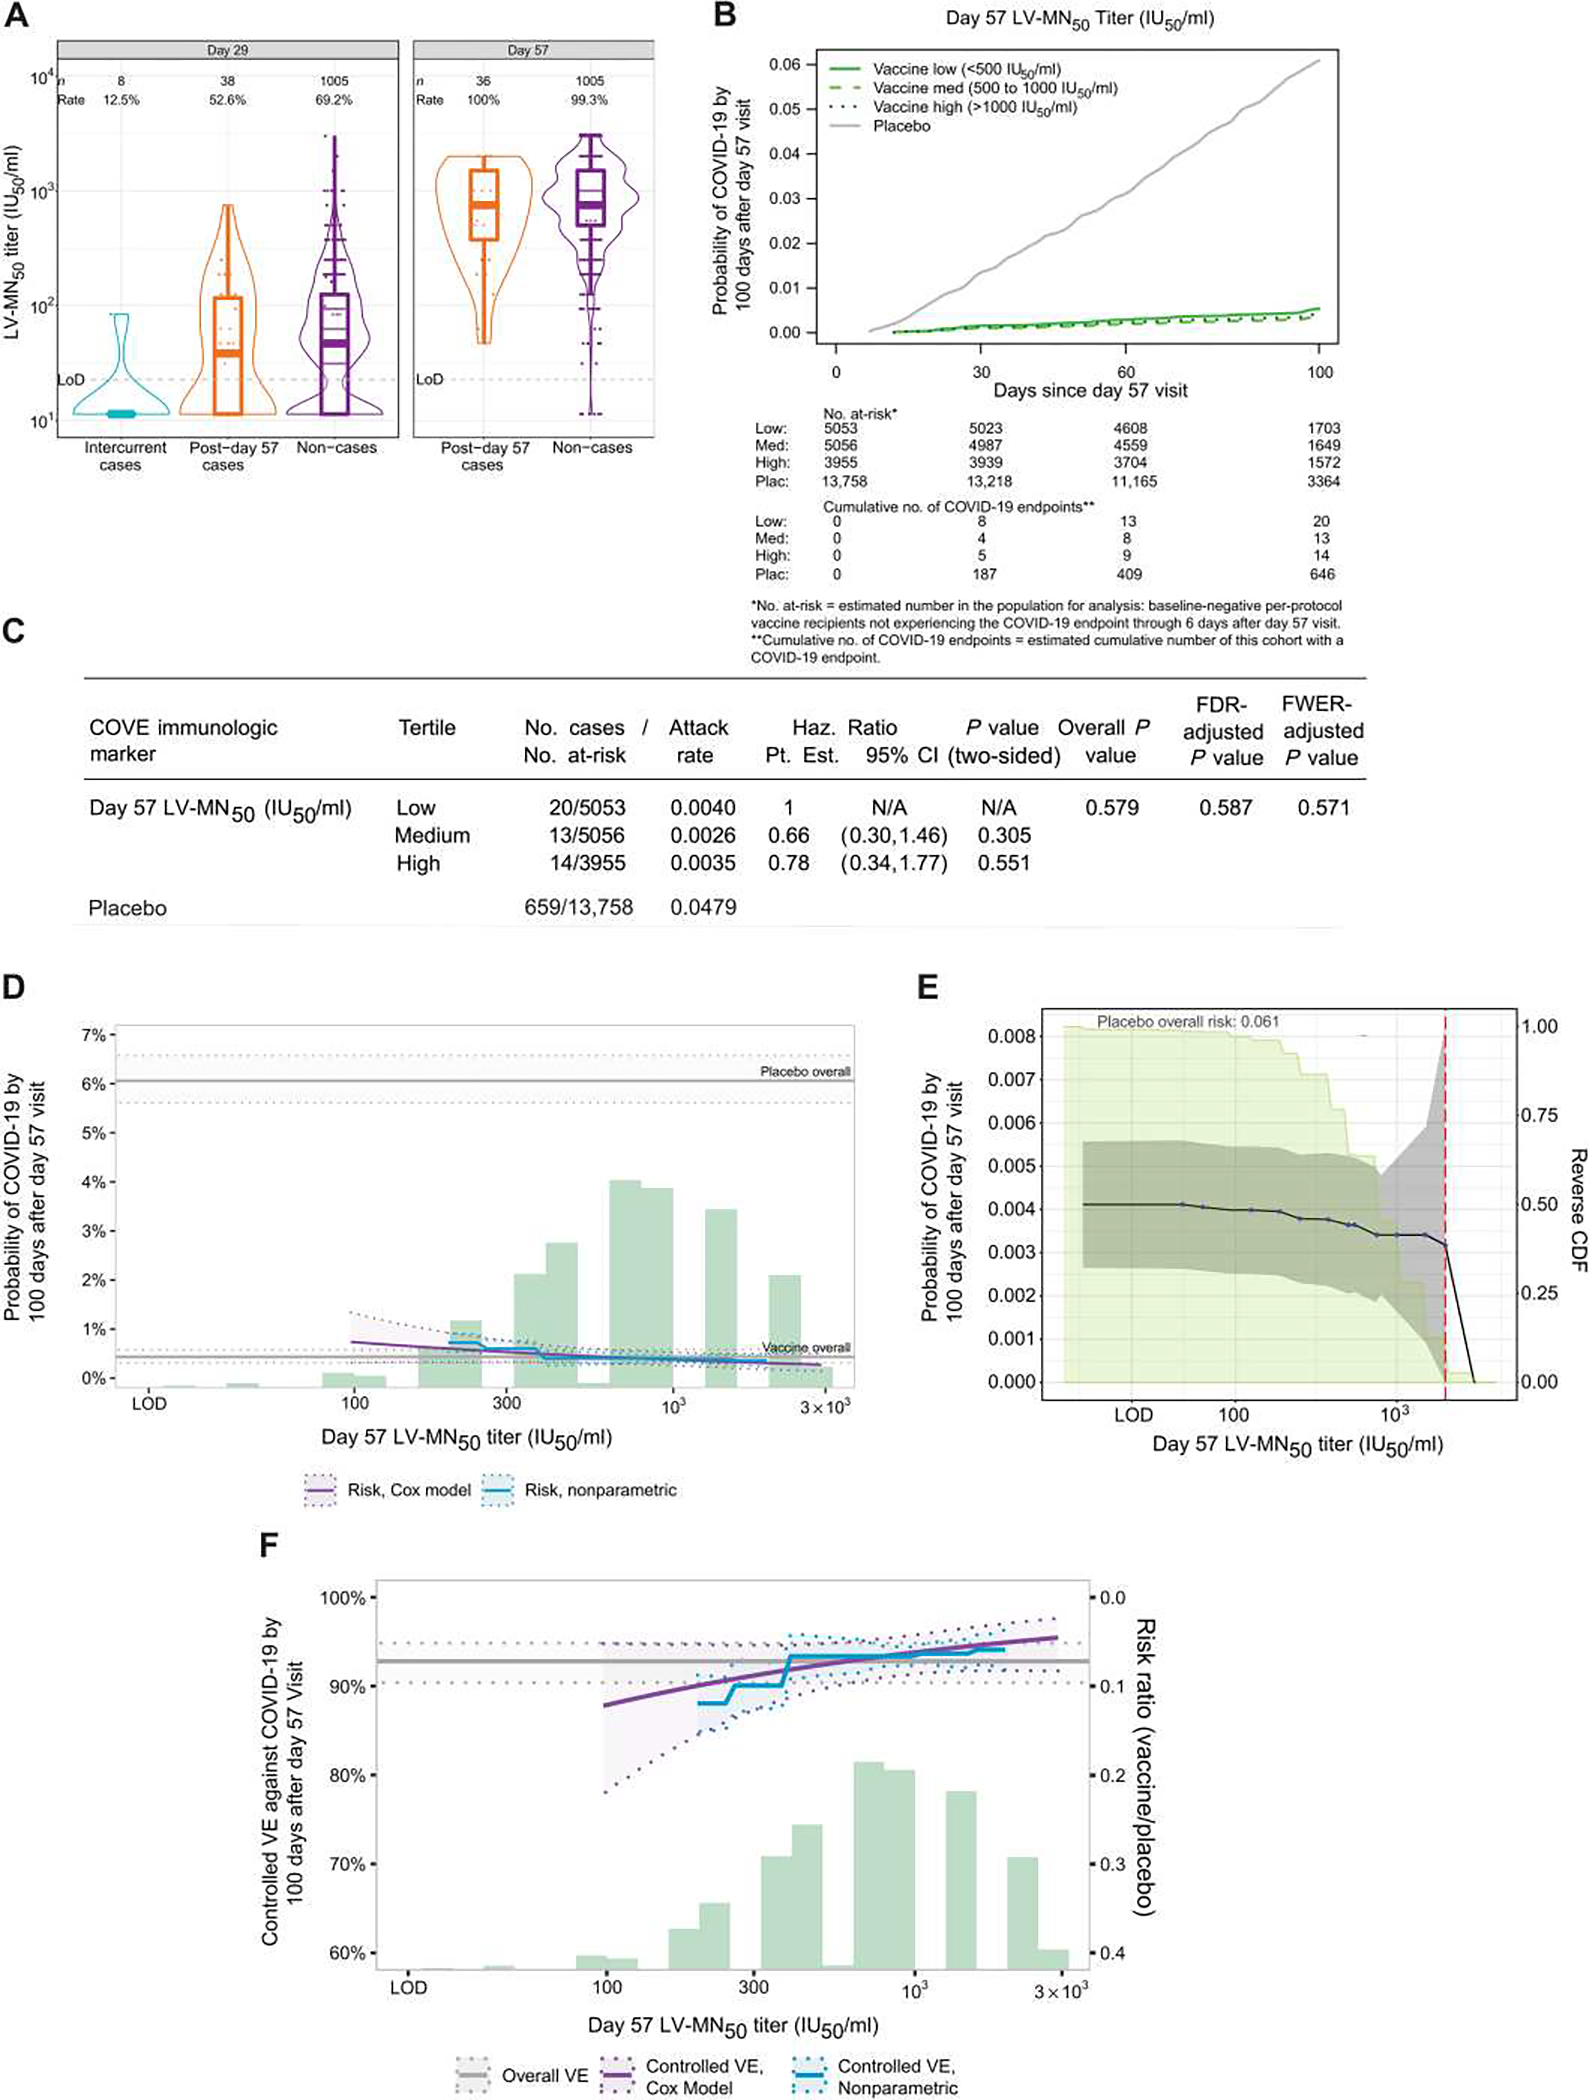
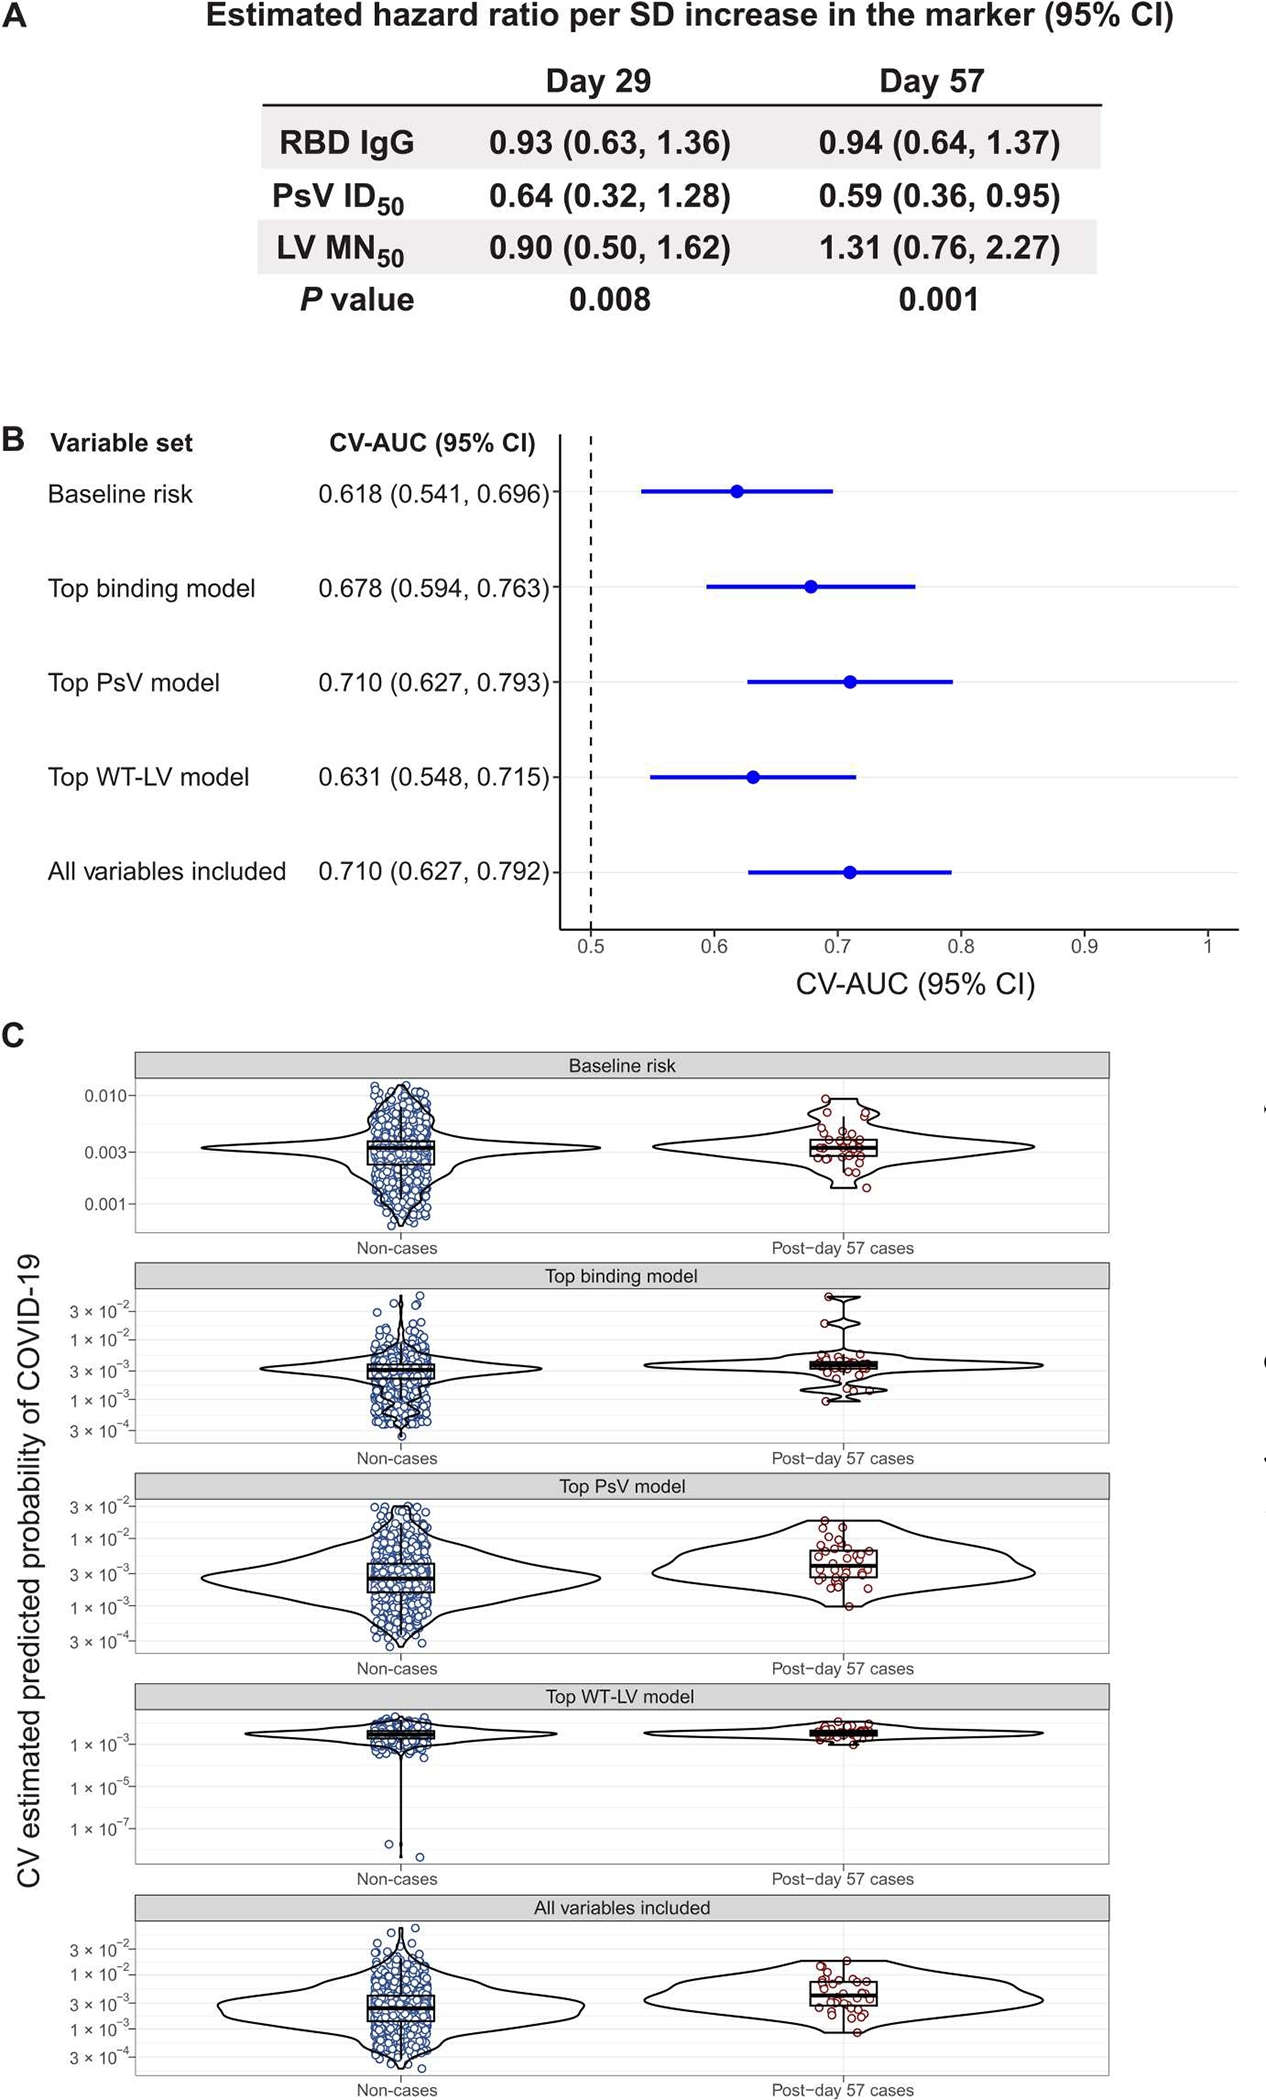
The best assay or marker to define mRNA-1273 vaccine-induced antibodies as a correlate of protection (CoP) is unclear. In the COVE trial, participants received two doses of the mRNA-1273 COVID-19 vaccine or placebo. We previously assessed IgG binding antibodies to the spike protein (spike IgG) or receptor binding domain (RBD IgG) and pseudovirus neutralizing antibody 50 or 80% inhibitory dilution titer measured on day 29 or day 57, as correlates of risk (CoRs) and CoPs against symptomatic COVID-19 over 4 months after dose. Here, we assessed a new marker, live virus 50% microneutralization titer (LV-MN50), and compared and combined markers in multivariable analyses. LV-MN50 was an inverse CoR, with a hazard ratio of 0.39 (95% confidence interval, 0.19 to 0.83) at day 29 and 0.51 (95% confidence interval, 0.25 to 1.04) at day 57 per 10-fold increase. In multivariable analyses, pseudovirus neutralization titers and anti-spike binding antibodies performed best as CoRs; combining antibody markers did not improve correlates. Pseudovirus neutralization titer was the strongest independent correlate in a multivariable model. Overall, these results supported pseudovirus neutralizing and binding antibody assays as CoRs and CoPs, with the live virus assay as a weaker correlate in this sample set. Day 29 markers performed as well as day 57 markers as CoPs, which could accelerate immunogenicity and immunobridging studies.

Trial registration: ClinicalTrials.gov NCT04470427.


Conflict of interest statement

Competing interests: D.B. receives consulting fees from Thera Technologies, Merck Sharp & Dohme, CDC Foundation, and the Foundation for Atlanta Veterans Education and Research Inc. D.C.M.’s laboratory receives funding from Moderna Inc. for neutralization assays. A.B.M. is an employee of Sanofi Vaccine Research and Development. E.M. is an unpaid member of an Independent Data Monitoring Committee through EMMES for PATH and a paid member of a safety monitoring committee through Syneos Health for Novavax. W.D., H.Z., J.M., and R.P. are employed by Moderna Inc. and have stock or stock options in Moderna Inc. L.N.C. receives consulting fees from Fred Hutch for scientific writing and editing. The other authors declare that they have no competing interests.

Figures

Fig. 1.
Fig. 1.. D57 LV-MN50 titers are more highly correlated with D57 spike IgG concentrations and with D57 RBD IgG concentrations than with D57 PsV-nAb ID50 titers or with D57 PsV-nAb ID80 titers.
Analyses were conducted in baseline SARS-CoV-2–negative per-protocol vaccine recipients in the immunogenicity sub-cohort. Corr indicates the baseline variable-adjusted Spearman rank correlation. ID50, 50% inhibitory dilution; ID80, 80% inhibitory dilution; LV, live virus; MN50, 50% microneutralization dilution; nAb, neutralizing antibody; PsV, pseudovirus. Correlations among spike IgG, RBD IgG, PsV-nAb, ID50, and PsV-nAb ID80 were reported previously [figure S6 of (10)]. Serological assay readouts are expressed in values relative to the World Health Organization (WHO) International Standard for anti–SARS-CoV-2 immunoglobulin (27). bAb readouts were converted to bAb units per milliliter (BAU/ml), and PsV-nAb titers and microneutralization assay readouts were calibrated to international units per milliliter (IU50/ml or IU80/ml).
Fig. 2.
Fig. 2.. Correlate analyses show limited evidence for D57 LV-MN50 titer as a CoR and as a CoP.
(A) LV-MN50 titers are shown binned by COVID-19 outcome status in baseline SARS-CoV-2–negative per-protocol vaccine recipients. Each sample was tested independently in singlet by one operator on one test plate following the standard operator procedures. The same sample was then tested by a second operator in singlet on a different plate on the same day. If necessary, repeat testing of any samples was performed in singlet by one operator on a different test day. The final reportable value for each sample was the median LV-MN50 titer of a minimum of two passing independent results. Data points are from the D29 marker or D57 marker case-cohort set. The violin plots contain interior box plots with upper and lower horizontal edges being the 25th and 75th percentiles of antibody concentrations, respectively, and the middle line being the 50th percentile; the vertical bars show the distance from the 25th (or 75th) percentile of antibody concentration and the minimum (or maximum) antibody concentration within the 25th (or 75th) percentile of antibody concentration minus (or plus) 1.5 times the interquartile range. Each side shows a rotated probability density (estimated by a kernel density estimator with a default Gaussian kernel) of the data. Positive response rates were computed with inverse probability of sampling weighting. Positive response was defined by value > LoD (22.66 IU50/ml). Post-D57 cases are COVID-19 endpoints starting 7 days after D57 through the end of blinded follow-up (last COVID-19 endpoint 126 days after dose 2); intercurrent cases are COVID-19 endpoints starting 7 days after D29 through 6 days after D57. IU, international units; LoD, limit of detection. (B) Shown is the cumulative incidence of COVID-19 for the low, medium, and high tertiles of D57 LV-MN50 titers. (C) Shown are the estimated hazard ratios of COVID-19 for the medium versus low and for the high versus low tertiles of D57 LV-MN50. Both comparisons were made in baseline SARS-CoV-2–negative per-protocol participants. All P values are based on Wald tests; multiplicity adjustments are shown controlling false discovery rate and FWER over the set of P values (separately for D29 and for D57 marker CoRs) both for quantitative markers and categorical markers (considering all five antibody markers: spike IgG, RBD IgG, PsV-nAb ID50, PsV-nAb ID80, and LV-MN50) using the Westfall and Young (34) permutation method (10,000 replicates). The overall P value is from a generalized Wald test of whether the hazard rate of COVID-19 differed across the low, medium, and high subgroups. N/A, not applicable. (D) Shown is the cumulative incidence of COVID-19 by 100 days after D57 by D57 LV-MN50 titer, estimated using (solid purple line) a Cox model or (solid blue line) a nonparametric model. Purple dotted lines indicate the bootstrap point-wise 95% CIs; blue dotted lines indicate the influence function–based Wald-based 95% confidence intervals (CIs). Upper and lower horizontal gray lines indicate overall cumulative incidence of COVID-19 from 7 to 100 days after D57 in placebo and vaccine recipients, respectively. The green histogram indicates the frequency distribution of D57 marker among baseline SARS-CoV-2–negative per-protocol vaccine recipients. (E) Shown is the cumulative incidence of COVID-19 by 100 days after D57 by D57 LV-MN50titer PsV-nAb ID50 titer above a threshold [versus at a specific threshold, as in (D)]. Blue dots indicate point estimates at each COVID-19 primary endpoint linearly interpolated by solid black lines; gray shading indicates point-wise 95% CIs. The estimates and CIs assume a nonincreasing threshold-response function. The upper boundary of the green shaded area indicates the estimate of the reverse cumulative distribution function (CDF) of D57 LV-MN50 concentrations. The vertical red dashed line indicates the D57 LV-MN50 occurred (in the time frame of 7 days after D57 through to the data cutoff date of 26 March 2021). (F) Shown is vaccine efficacy by D57 LV-MN50 titer estimated by different implementations of (30). The solid purple line indicates vaccine efficacy by D57 LV-MN50 titer, estimated using a Cox proportional hazard implementation of (30); dotted purple lines indicate bootstrap point-wise 95% CIs. The solid blue line indicates vaccine efficacy by D57 LV-MN50 titer, estimated using a nonparametric implementation of (30); dotted blue lines indicate 95% CIs. The green histogram indicates the frequency distribution of D57 marker among baseline SARS-CoV-2–negative per-protocol vaccine recipients. The horizontal gray line indicates overall vaccine efficacy from 7 to 100 days after D57, and the dotted gray lines indicates 95% CIs. Analyses were adjusted for baseline risk score, at-risk status, and community of color status. Microneutralization assay readouts were calibrated to the WHO anti–SARS-CoV-2 immunoglobulin International Standard (27) and are expressed in IU50/ml.
Fig. 3.
Fig. 3.. Multivariable modeling of COVID-19 risk shows that PsV neutralization titers and anti-spike bAbs perform best as CoRs, with no improvement in performance by including multiple markers.
(A) Shown is the estimated COVID-19 hazard ratio per SD increase of the indicated antibody marker value in baseline SARS-CoV-2–negative per-protocol vaccine recipients. Hazard ratio was assessed using multivariable models. The two-phase sampling Cox model was adjusted for baseline risk score, at-risk status, and community of color status. The P values are from a generalized Wald test of the null hypothesis that all assay marker variables have null association. (B) The forest plot shows discrete Super Learner performance (weighted CV-AUC with 95% CI) for baseline risk factors, the top binding model, the top PsV-nAb model, the top wild-type live virus (WT-LV)–nAb model, and the model including all marker variables. All models include the baseline risk factors. The top binding model includes D57 bAb spike IgG, the top PsV-nAb model includes D29 and D57 PsV-nAb ID80, and the top LV-MN50 model includes D57 LV-MN50. The dashed vertical line indicates a CV-AUC of 0.5 (the prediction performance achieved by random guessing). (C) Shown are the distributions of weighted CV-estimated prediction probabilities for post-D57 cases (n = 36) and non-cases (n = 1005) using discrete Super Learner for baseline risk factors, the top binding model, the top PsV-nAb model, the top WT-LV-MN50 model, and the model including all marker variables. Post-D57 cases are COVID-19 endpoints starting 7 days after D57 through the end of blinded follow-up (last COVID-19 endpoint 126 days after dose 2). Serological assay readouts assessed as immune correlates were first expressed in values relative to the WHO International Standard for anti–SARS-CoV-2 immunoglobulin (27). bAb readouts were converted to BAU/ml, and PsV-nAb titers and microneutralization assay readouts were calibrated to IU50/ml or IU80/ml. CV-AUC, cross-validated area under the receiver operating characteristic curve.

References

    1. Plotkin SA, Correlates of protection induced by vaccination. Clin. Vaccine Immunol. 17, 1055–1065 (2010). - PMC - PubMed
    1. Plotkin SA, Gilbert PB, Correlates of protection, in Plotkin’s Vaccines, Plotkin SA, Orenstein WA, Offit PA, Edwards KM, Eds. (Elsevier, ed. 7, 2018), chap. 3.
    1. Plotkin SA, Gilbert PB, Nomenclature for immune correlates of protection after vaccination. Clin. Infect. Dis. 54, 1615–1617 (2012). - PMC - PubMed
    1. Krammer F, A correlate of protection for SARS-CoV-2 vaccines is urgently needed. Nat. Med. 27, 1147–1148 (2021). - PubMed
    1. Koup RA, Donis RO, Gilbert PB, Li AW, Shah NA, Houchens CR, A government-led effort to identify correlates of protection for COVID-19 vaccines. Nat. Med. 27, 1493–1494 (2021). - PMC - PubMed

Publication types

Associated data