. 2023 Jun;10(17):e2206584.
doi: 10.1002/advs.202206584. Epub 2023 Apr 19.

Epigenetic Control of Translation Checkpoint and Tumor Progression via RUVBL1-EEF1A1 Axis

Affiliations

Epigenetic Control of Translation Checkpoint and Tumor Progression via RUVBL1-EEF1A1 Axis

Mingli Li et al. Adv Sci (Weinh). 2023 Jun.

Erratum in

Abstract

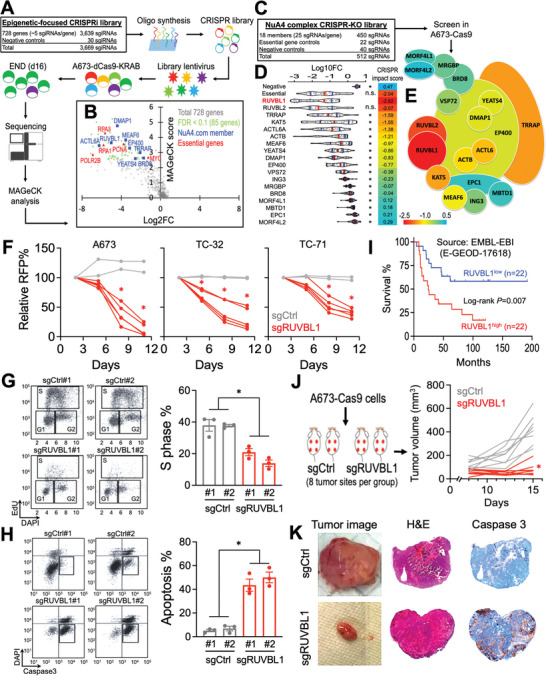
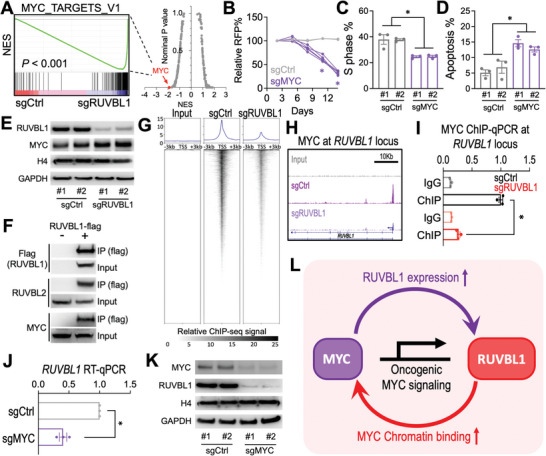
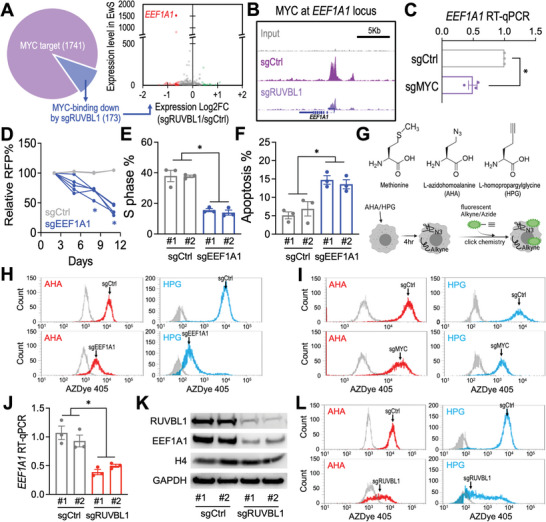
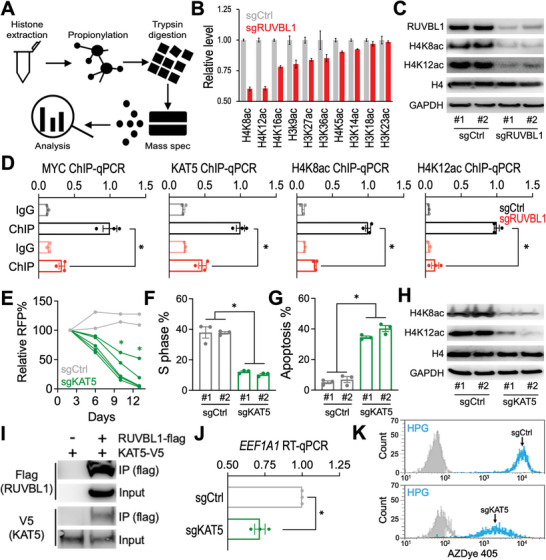
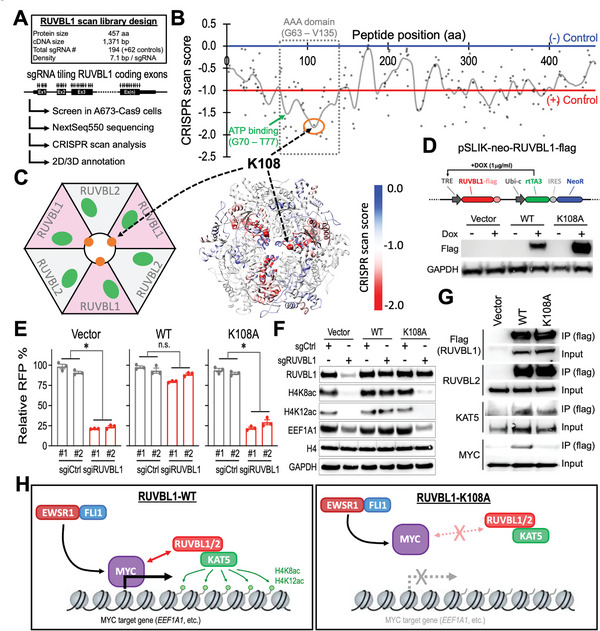
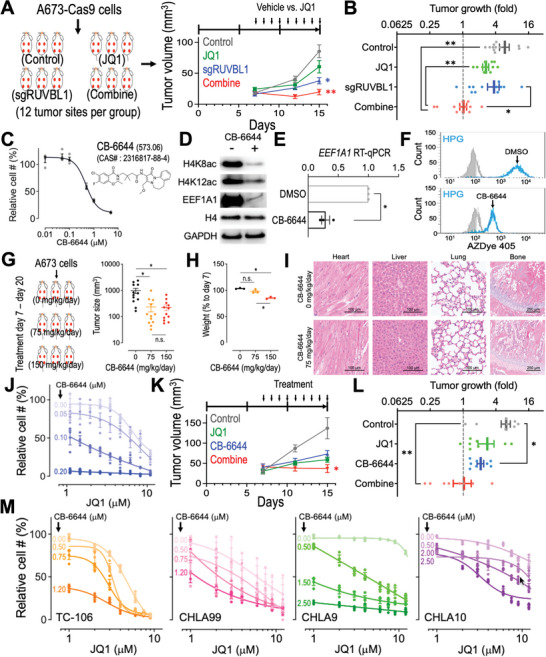
Epigenetic dysregulation is reported in multiple cancers including Ewing sarcoma (EwS). However, the epigenetic networks underlying the maintenance of oncogenic signaling and therapeutic response remain unclear. Using a series of epigenetics- and complex-focused CRISPR screens, RUVBL1, the ATPase component of NuA4 histone acetyltransferase complex, is identified to be essential for EwS tumor progression. Suppression of RUVBL1 leads to attenuated tumor growth, loss of histone H4 acetylation, and ablated MYC signaling. Mechanistically, RUVBL1 controls MYC chromatin binding and modulates the MYC-driven EEF1A1 expression and thus protein synthesis. High-density CRISPR gene body scan pinpoints the critical MYC interacting residue in RUVBL1. Finally, this study reveals the synergism between RUVBL1 suppression and pharmacological inhibition of MYC in EwS xenografts and patient-derived samples. These results indicate that the dynamic interplay between chromatin remodelers, oncogenic transcription factors, and protein translation machinery can provide novel opportunities for combination cancer therapy.

Keywords: EEF1A1; Ewing sarcoma; KAT5; MYC; RUVBL1; epigenetic.


Conflict of interest statement

J.C. is a scientific founder of Genovel Biotech Corp. and holds equities with the company, and is also a Scientific Advisor for Race Oncology.

Figures

Figure 1
Figure 1
Serial CRISPR screens identify the essential role of RUVBL1 in EwS. A) Schematic outline of an epigenetic‐focused CRISPRi screen in A673‐dCas9‐KRAB cells. B) Volcano plot depicts the log2 fold change of sgRNA abundance during 16 d of screen culture (x‐axis; log2FC) and the significance (y‐axis; MAGeCK score) of each gene in the epigenetics CRISPRi screen (n = 3 replicates). C) Library design of the NuA4 complex CRISPR screen in A673‐Cas9 cells. D) Violin plots indicate the median (red lines), first and third quartiles (blue lines), and the log10 fold change of individual sgRNA (dots) during 16 d of NuA4 complex CRISPR screen culture (n = 3 replicates). E) Heatmap showing the CRISPR impact scores (Log10FC of the first quartile out of 25 sgRNAs per gene) of each member in the NuA4 complex CRISPR screen. F) Growth competition assay of Cas9‐expressing A673, TC‐32, and TC‐71 EwS cells transduced with RFP‐labeled negative control sgRNAs (gray lines; n = 2 independent sgCtrl sequences) and sgRNAs targeting RUVBL1 (red lines; n = 5 independent sgRUVBL1 sequences). G) Cell cycle monitored by EdU incorporation, and H) cellular apoptosis detected by active caspase 3+/DAPI in A673‐Cas9 cells transduced with sgCtrl and sgRUVBL1 for 7 d (n = 3 for each group). I) Survival curves of patients with EwS family of tumors expressing high versus low RUVBL1 (22 patients for each group). J) Profile plot of EwS xenograft tumor volume in mice inoculated with sgCtrl and sgRUVBL1 transduced A673‐Cas9 cells (n = 8 tumor sites per group). K) Tumor image (left), hematoxylin and eosin stain (middle), and cleaved caspase 3 stain (right; brown) of sgCtrl and sgRUVBL1 transduced A673‐Cas9 xenograft tumor. Data are represented as mean ± SEM. *P < 0.01 compared to D) RUVBL1 and F–H,J) sgCtrl by two‐sided Student's t‐test. Source data are available for this figure: SourceData F1 A, B, and D.
Figure 2
Figure 2
RUVBL1 controls MYC chromatin localization and transactivation activity in EwS. A) RNAseq and GSEA analyses showing changes in expression of the MYC upregulated target gene set in sgCtrl and sgRUVBL1 transduced (day 5) A673‐Cas9 cells (two independent sgRNA sequences per group). (Right) Each dot indicates one gene set from the GSEA Molecular Signature Database (MSigDB; total 238 gene sets from the Hallmark and Oncogenic Signature [C6] collections). NES: Normalized enrichment score. B) Growth competition assay of sgCtrl (gray lines; n = 2 independent sgRNA sequences) and sgMYC (purple lines; n = 5 independent sgRNA sequences) in A673‐Cas9 cells. C) Cell cycle monitored by EdU incorporation, and D) cellular apoptosis detected by active caspase 3+/DAPI in A673‐Cas9 cells transduced with sgCtrl and sgMYC (n = 3 for each group). E) Western blot of RUVBL1, MYC, histone H4, and GAPDH in A673‐Cas9 cells transduced with sgCtrl and sgRUVBL1 (two independent sgRNA sequences per group). F) Co‐IP of RUVBL1 (flag‐tagged) with RUVBL2 and MYC in HEK293 cells. G) Meta plots (top) and heatmaps (bottom) showing ChIP‐seq signal of MYC at TSSs ± 3 kb regions for all genes in A673‐Cas9 cells transduced with sgCtrl and sgRUVBL1. H) Profiles of MYC ChIP‐seq and (I) ChIP‐qPCR at RUVBL1 locus in A673‐Cas9 cells transduced with sgCtrl and sgRUVBL1 (n = 3 for each group). J) RT‐qPCR of RUVBL1 mRNA in A673‐Cas9 cells transduced with sgCtrl and sgMYC (n = 3 for each group). K) Western blot of MYC, RUVBL1, and GAPDH in A673‐Cas9 cells transduced with sgMYC (two independent sgRNA sequences per group). L) Model of a feed‐forward network between RUVBL1 and MYC in EwS. Data are represented as mean ± SEM. *P < 0.01 compared to sgCtrl by two‐sided Student's t‐test.
Figure 3
Figure 3
RUVBL1 controls protein synthesis via mediating EEF1A1 expression. A) RNAseq evaluation of the expression level in EwS (y‐axis) and the log2 fold change of expression induced by sgRUVBL1 (x‐axis) of the RUVBL1‐regulated MYC targets (173 genes). The depleted (red) and enriched (green) genes are highlighted. B) Profiles of MYC ChIP‐seq at EEF1A1 locus in A673‐Cas9 cells transduced with sgCtrl and sgRUVBL1. C) RT‐qPCR of EEF1A1 mRNA in A673‐Cas9 cells transduced with sgCtrl and sgMYC (n = 3 for each group). D) Growth competition assay of sgCtrl (gray lines; n = 2 independent sgRNA sequences) and sgEEF1A1 (blue lines; n = 5 independent sgRNA sequences) in A673‐Cas9 cells. E) Cell cycle monitored by EdU incorporation, and F) cellular apoptosis detected by active caspase 3+/DAPI in A673‐Cas9 cells transduced with sgCtrl and sgEEF1A1 (n = 3 for each group). G) Schematic outline of metabolic labeling of the newly synthesized proteins using AHA/HPG incorporation. Flow cytometric profiles of AHA (red) and HPG (cyan) labeled compared to the nonlabeled (gray) cells in A673‐Cas9 cultures transduced with H) sgCtrl versus sgEEF1A1, I) sgCtrl versus sgMYC, and L) sgCtrl versus sgRUVBL1. J) RT‐qPCR of EEF1A1 mRNA in A673‐Cas9 cells transduced with sgCtrl and sgRUVBL1 (two independent sgRNA sequences; n = 3 for each group). K) Western blot of RUVBL1, EEF1A1, histone H4, and GAPDH in A673‐Cas9 cells transduced with sgCtrl and sgRUVBL1 (two independent sgRNA sequences per group). Data are represented as mean ± SEM. *P < 0.01 compared to sgCtrl by two‐sided Student's t‐test.
Figure 4
Figure 4
RUVBL1 modulates histone H4 acetylation via KAT5. A) Schematic outline of histone modification mass spectrometry and B) levels of histone H3 and H4 acetylation detected in sgCtrl and sgRUVBL1 transduced A673‐Cas9 cells (n = 3 mass spec measurements per sample). C) Western blot of RUVBL1, H4K8ac, H4K12ac, histone H4, and GAPDH in A673‐Cas9 cells transduced with sgCtrl versus sgRUVBL1 (two independent sgRNA sequences per group). D) ChIP‐qPCR of MYC, KAT5, H4K8ac, and H4K12ac at EEF1A1 locus in A673‐Cas9 cells transduced with sgCtrl and sgRUVBL1 (n = 3 for each group). E) Growth competition assay of sgCtrl (gray lines; n = 2 independent sgRNA sequences) and sgKAT5 (green lines; n = 5 independent sgRNA sequences) in A673‐Cas9 cells. F) Cell cycle monitored by EdU incorporation, and G) cellular apoptosis detected by active caspase 3+/DAPI in A673‐Cas9 cells transduced with sgCtrl and sgKAT5 (n = 3 for each group). H) Western blot of RUVBL1, H4K8ac, H4K12ac, histone H4, and GAPDH in A673‐Cas9 cells transduced with sgCtrl versus sgKAT5 (two independent sgRNA sequences per group). I) Co‐IP of RUVBL1 (flag‐tagged) with KAT5 (V5‐tagged) in HEK293 cells. J) RT‐qPCR of EEF1A1 mRNA in A673‐Cas9 cells transduced with sgCtrl and sgKAT5 (n = 3 for each group). K) Flow cytometric profiles of HPG labeled (cyan) compared to the nonlabeled (gray) cells in A673‐Cas9 cultures transduced with sgCtrl versus sgKAT5. Data are represented as mean ± SEM. *P < 0.01 compared to sgCtrl by two‐sided Student's t‐test. Source data are available for this figure: SourceData F4 B.
Figure 5
Figure 5
Lysine 108 in RUVBL1 is required for the interaction between RUVBL1 and MYC. A) Schematic outline of RUVBL1 high‐density CRISPR gene body scan in A673‐Cas9 cells. B) 2D annotation of RUVBL1 CRISPR scan. The gray line indicates the smoothened model of the CRISPR scan score derived from 194 sgRNAs (dots) targeting the coding exons of RUVBL1 (n = 3 replicates). The median CRISPR scan scores of the positive control (red line; defined as −1.0) and negative control (blue line; defined as 0.0) sgRNAs are highlighted. C) 3D annotation RUVBL1 CRISPR scan score relative to a cryo‐EM structural model of a hexamer consists of three RUVBL1 and three RUVBL2 proteins (PDB ID: 5OAF). D) Western blot showing doxycycline (DOX)‐induced expression of flag‐tagged WT‐ and K108A‐RUVBL1 in A673‐dCas9‐KRAB cells. E) Effect of WT‐ and K108A‐RUVBL1 expression on the growth competition assay of A673‐dCas9‐KRAB cells transduced with sgiCtrl and sgiRUVBL1 (n = 3 for each group). F) Western blot of RUVBL1, H4K8ac, H4K12ac, EEF1A1, histone H4, and GAPDH in WT‐ and K108A‐RUVBL1 expressing A673‐dCas9‐KRAB cells transduced with sgiCtrl and sgiRUVBL1. G) Co‐IP of WT‐ and K108A‐RUVBL1 (flag‐tagged) with RUVBL2, KAT5, and MYC in HEK293 cells. H) Model of RUVBL1 supporting MYC chromatin binding and target gene expression. Data are represented as mean ± SEM. *P < 0.01 compared to sgCtrl by two‐sided Student's t‐test. Source data are available for this figure: SourceData F5 B.
Figure 6
Figure 6
Targeting RUVBL1 synergizes with JQ1 in EwS. A) EwS xenograft tumor volume and B) tumor growth fold (day 15 vs day 7; n = 12 tumor sites per group) in control (gray), JQ1 (green), sgRUVBL1 (blue), and combination (red) groups. C) Chemical structure of CB‐6644 and the effect of CB‐6644 treatment on the proliferation of A673 cells (n = 4 for each group). D) Western blot of H4K8ac, H4K12ac, EEF1A1, histone H4, and GAPDH in A673 cells treated with vehicle (DMSO) and CB‐6644 (0.5 × 10⁻⁶ m). E) RT‐qPCR of EEF1A1 mRNA in A673‐Cas9 cells treated with DMSO and 0.5 × 10⁻⁶ m CB‐6644 (n = 3 for each group). F) Flow cytometric profiles of HPG labeled (cyan) compared to the nonlabeled (gray) cells in A673 cultures incubated with DMSO versus CB‐6644 (0.5 × 10⁻⁶ m). G) A673 EwS xenograft tumor volume (n = 12 tumor sites per group) and H) mouse weight (vs before CB‐6644 treatment; n = 3 mice per group) after 14 d of CB‐6644 treatment at 0 (black), 75 (orange), and 150 (red) mg kg−1 d−1. I) Hematoxylin and eosin stain of the heart, liver, lung, and bone tissues in mice treated with 0 and 75 mg kg−1 mL−1 of CB‐6644 for 14 d. J) Effect of JQ1 and CB‐6644 combination on the proliferation of A673 cells (n = 3 for each condition). Relative cell # (%) of each CB‐6644 condition was normalized to the samples without JQ1 treatment. K) EwS xenograft tumor volume and L) tumor growth fold (day 15 vs day 7; n = 8 tumor sites per group) in control (gray), JQ1 (green), CB‐6644 (blue), and combination (red) groups. M) Effect of JQ1 and CB‐6644 combination on the proliferation of patient‐derived Ewing Tumor Family cells TC‐106, CHLA99, CHLA9, and CHLA10 (n = 3 for each condition). Data are represented as mean ± SEM. *P < 0.01 and **P < 0.001 compared to control by two‐sided Student's t‐test.

References

    1. a) Grunewald T. G. P., Cidre‐Aranaz F., Surdez D., Tomazou E. M., de Alava E., Kovar H., Sorensen P. H., Delattre O., Dirksen U., Nat. Rev. Dis. Primers 2018, 4, 5; - PubMed
    2. b) Riggi N., Suva M. L., Stamenkovic I., N. Engl. J. Med. 2021, 384, 1477. - PubMed
    1. a) Delattre O., Zucman J., Plougastel B., Desmaze C., Melot T., Peter M., Kovar H., Joubert I., de Jong P., Rouleau G., Aurias A., Thomas G., Nature 1992, 359, 162; - PubMed
    2. b) May W. A., Gishizky M. L., Lessnick S. L., Lunsford L. B., Lewis B. C., Delattre O., Zucman J., Thomas G., Denny C. T., Proc. Natl. Acad. Sci. USA 1993, 90, 5752; - PMC - PubMed
    3. c) Grohar P. J., Kim S., Rivera G. O. R., Sen N., Haddock S., Harlow M. L., Maloney N. K., Zhu J., O'Neill M., Jones T. L., Huppi K., Grandin M., Gehlhaus K., Klumpp‐Thomas C. A., Buehler E., Helman L. J., Martin S. E., Caplen N. J., Cell Rep. 2016, 14, 598. - PMC - PubMed
    1. Gangwal K., Sankar S., Hollenhorst P. C., Kinsey M., Haroldsen S. C., Shah A. A., Boucher K. M., Watkins W. S., Jorde L. B., Graves B. J., Lessnick S. L., Proc. Natl. Acad. Sci. USA 2008, 105, 10149. - PMC - PubMed
    1. a) Dauphinot L., De Oliveira C., Melot T., Sevenet N., Thomas V., Weissman B. E., Delattre O., Oncogene 2001, 20, 3258; - PubMed
    2. b) Prieur A., Tirode F., Cohen P., Delattre O., Mol. Cell. Biol. 2004, 24, 7275; - PMC - PubMed
    3. c) Bilke S., Schwentner R., Yang F., Kauer M., Jug G., Walker R. L., Davis S., Zhu Y. J., Pineda M., Meltzer P. S., Kovar H., Genome Res. 2013, 23, 1797; - PMC - PubMed
    4. d) Aynaud M. M., Mirabeau O., Gruel N., Grossetete S., Boeva V., Durand S., Surdez D., Saulnier O., Zaidi S., Gribkova S., Fouche A., Kairov U., Raynal V., Tirode F., Grunewald T. G. P., Bohec M., Baulande S., Janoueix‐Lerosey I., Vert J. P., Barillot E., Delattre O., Zinovyev A., Cell Rep. 2020, 30, 1767. - PubMed
    1. a) Brohl A. S., Solomon D. A., Chang W., Wang J., Song Y., Sindiri S., Patidar R., Hurd L., Chen L., Shern J. F., Liao H., Wen X., Gerard J., Kim J. S., Lopez Guerrero J. A., Machado I., Wai D. H., Picci P., Triche T., Horvai A. E., Miettinen M., Wei J. S., Catchpool D., Llombart‐Bosch A., Waldman T., Khan J., PLoS Genet. 2014, 10, e1004475; - PMC - PubMed
    2. b) Crompton B. D., Stewart C., Taylor‐Weiner A., Alexe G., Kurek K. C., Calicchio M. L., Kiezun A., Carter S. L., Shukla S. A., Mehta S. S., Thorner A. R., de Torres C., Lavarino C., Sunol M., McKenna A., Sivachenko A., Cibulskis K., Lawrence M. S., Stojanov P., Rosenberg M., Ambrogio L., Auclair D., Seepo S., Blumenstiel B., DeFelice M., Imaz‐Rosshandler I., Schwarz‐Cruz Y. C. A., Rivera M. N., Rodriguez‐Galindo C., Fleming M. D., et al., Cancer Discovery 2014, 4, 1326; - PubMed
    3. c) Dharia N. V., Kugener G., Guenther L. M., Malone C. F., Durbin A. D., Hong A. L., Howard T. P., Bandopadhayay P., Wechsler C. S., Fung I., Warren A. C., Dempster J. M., Krill‐Burger J. M., Paolella B. R., Moh P., Jha N., Tang A., Montgomery P., Boehm J. S., Hahn W. C., Roberts C. W. M., McFarland J. M., Tsherniak A., Golub T. R., Vazquez F., Stegmaier K., Nat. Genet. 2021, 53, 529. - PMC - PubMed

Publication types

MeSH terms

LinkOut - more resources