. 2023 May 4;110(5):809-825.
doi: 10.1016/j.ajhg.2023.03.014. Epub 2023 Apr 18.

POLR1A variants underlie phenotypic heterogeneity in craniofacial, neural, and cardiac anomalies

Affiliations

POLR1A variants underlie phenotypic heterogeneity in craniofacial, neural, and cardiac anomalies

Kelly Smallwood et al. Am J Hum Genet. .

Abstract

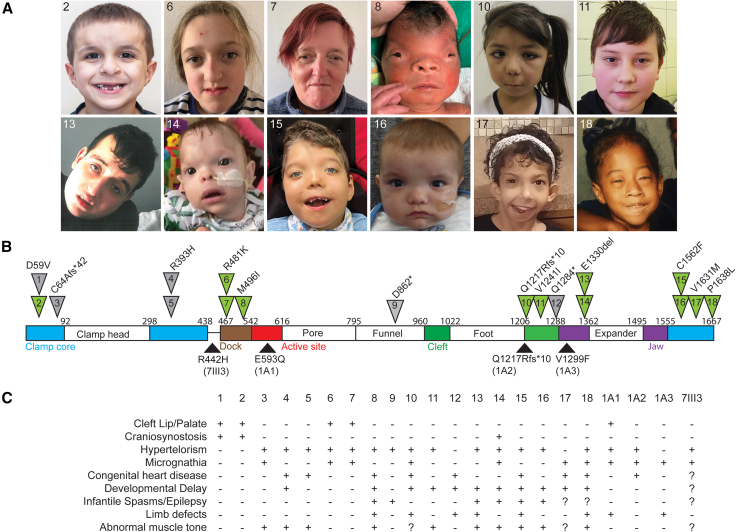
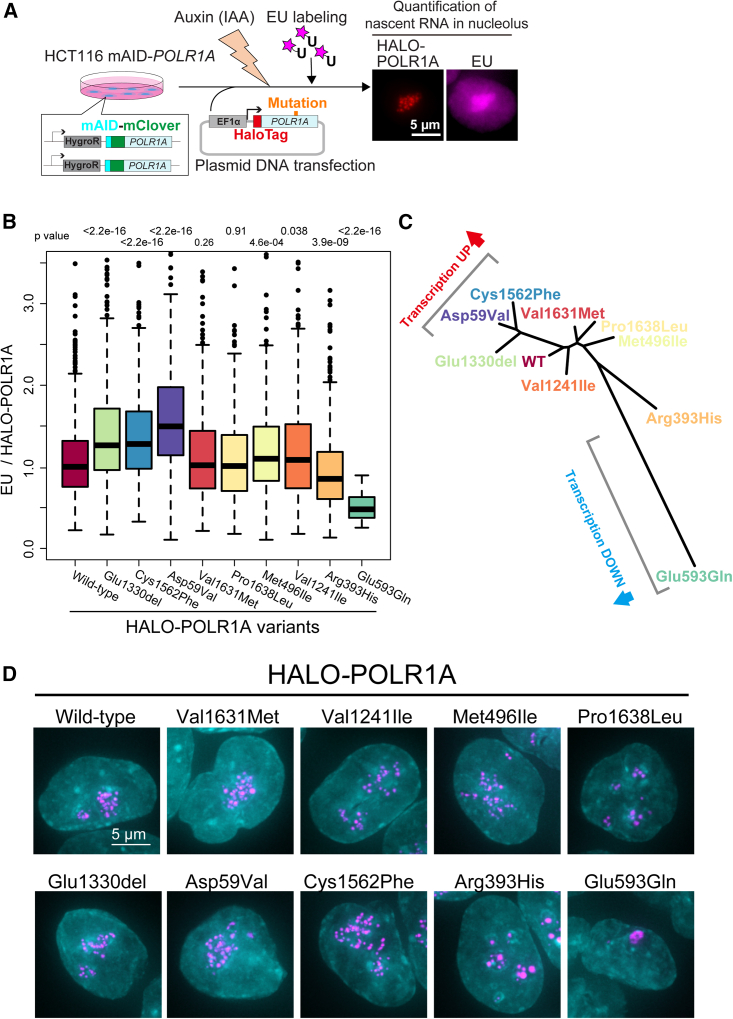
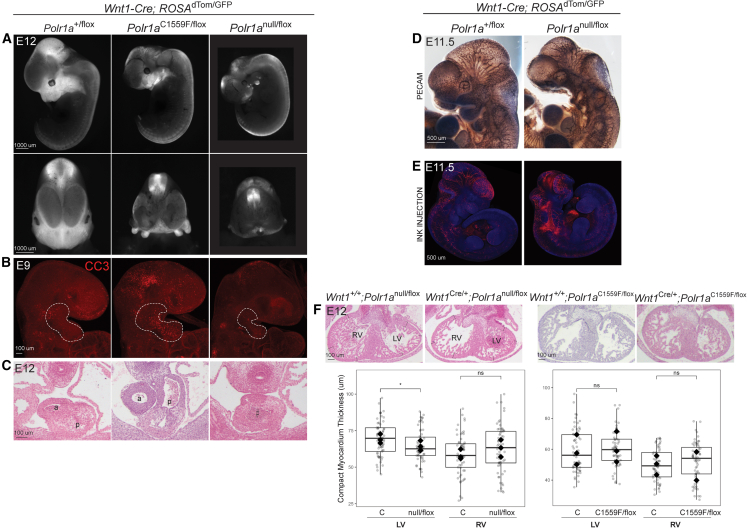
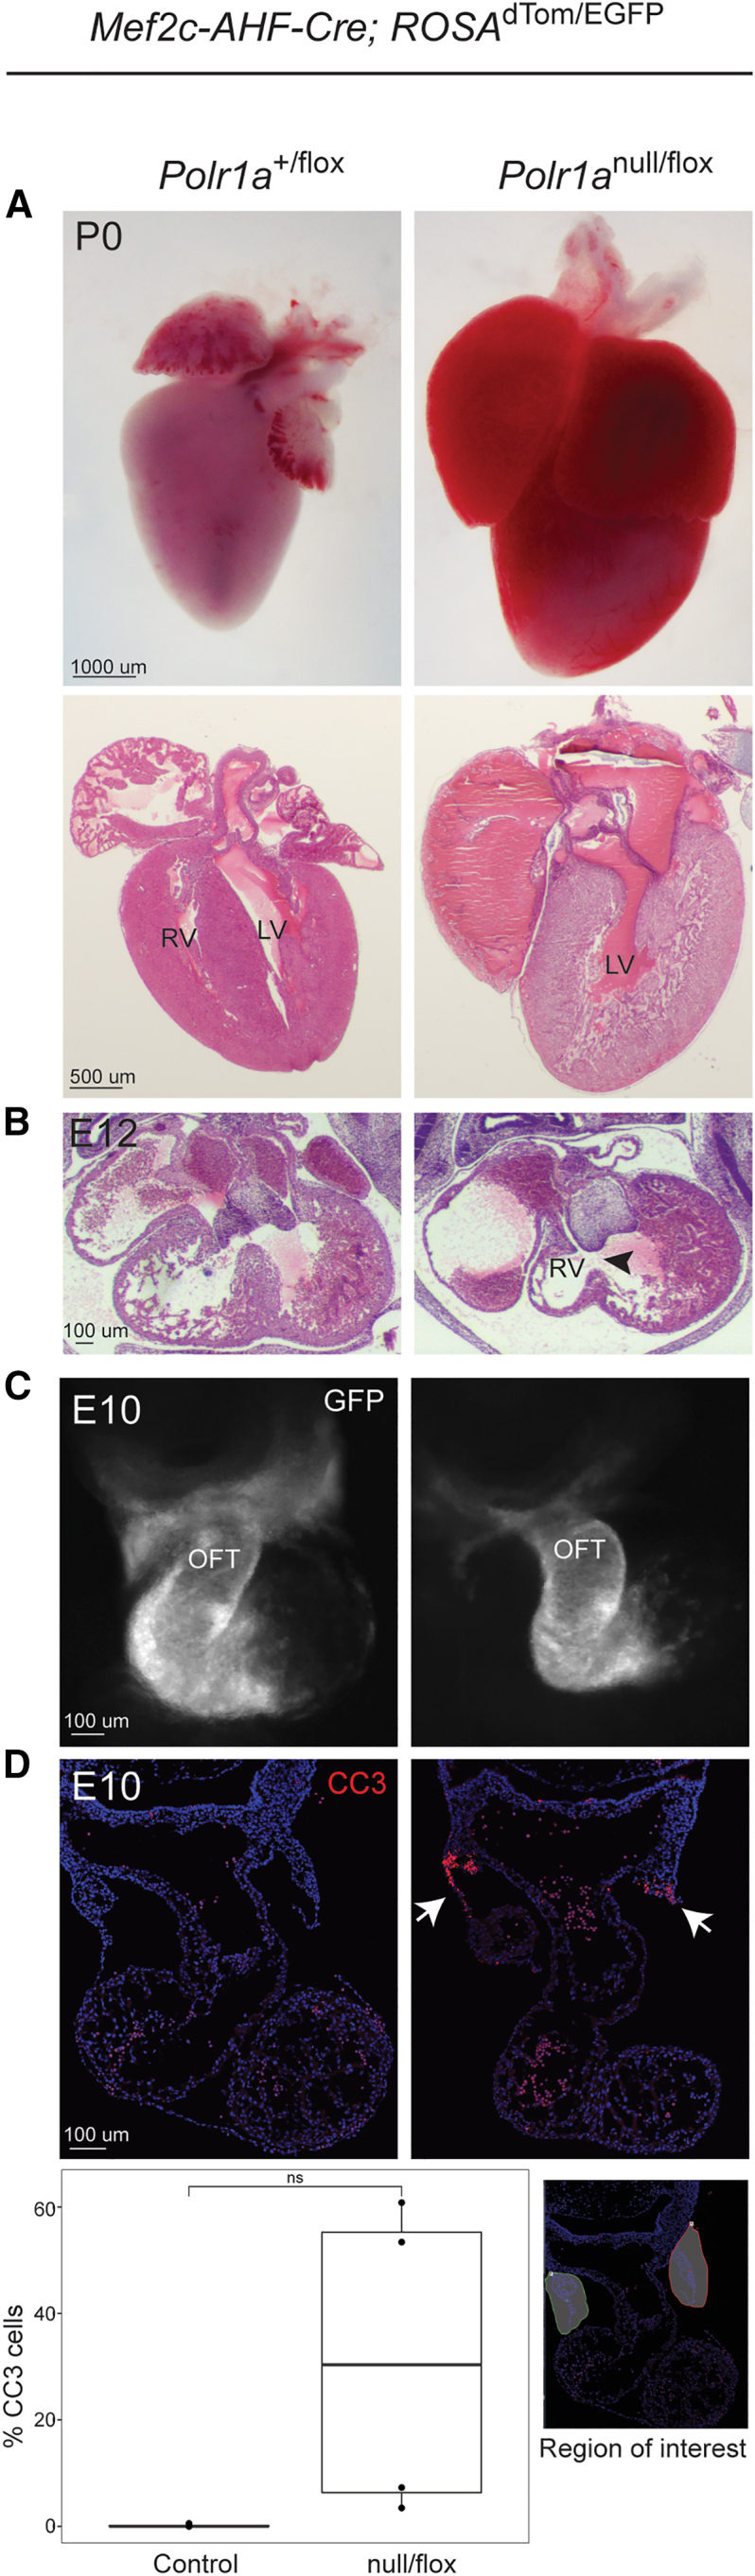
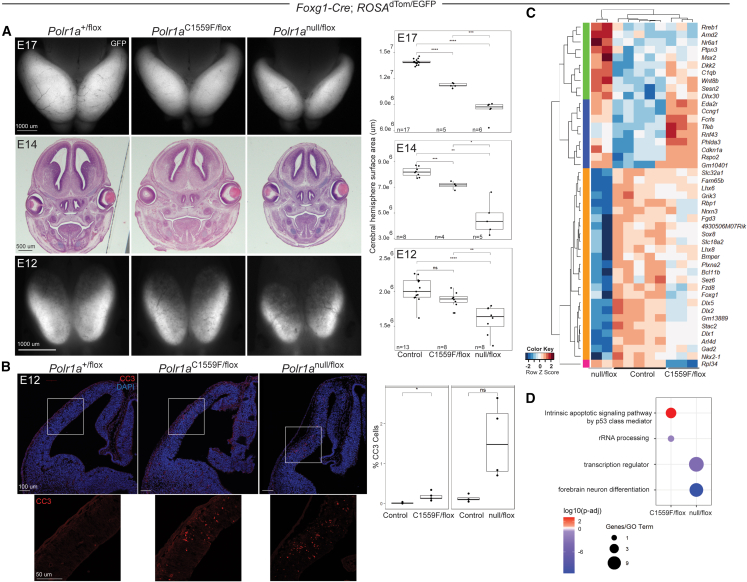
Heterozygous pathogenic variants in POLR1A, which encodes the largest subunit of RNA Polymerase I, were previously identified as the cause of acrofacial dysostosis, Cincinnati-type. The predominant phenotypes observed in the cohort of 3 individuals were craniofacial anomalies reminiscent of Treacher Collins syndrome. We subsequently identified 17 additional individuals with 12 unique heterozygous variants in POLR1A and observed numerous additional phenotypes including neurodevelopmental abnormalities and structural cardiac defects, in combination with highly prevalent craniofacial anomalies and variable limb defects. To understand the pathogenesis of this pleiotropy, we modeled an allelic series of POLR1A variants in vitro and in vivo. In vitro assessments demonstrate variable effects of individual pathogenic variants on ribosomal RNA synthesis and nucleolar morphology, which supports the possibility of variant-specific phenotypic effects in affected individuals. To further explore variant-specific effects in vivo, we used CRISPR-Cas9 gene editing to recapitulate two human variants in mice. Additionally, spatiotemporal requirements for Polr1a in developmental lineages contributing to congenital anomalies in affected individuals were examined via conditional mutagenesis in neural crest cells (face and heart), the second heart field (cardiac outflow tract and right ventricle), and forebrain precursors in mice. Consistent with its ubiquitous role in the essential function of ribosome biogenesis, we observed that loss of Polr1a in any of these lineages causes cell-autonomous apoptosis resulting in embryonic malformations. Altogether, our work greatly expands the phenotype of human POLR1A-related disorders and demonstrates variant-specific effects that provide insights into the underlying pathogenesis of ribosomopathies.

Keywords: RNA Polymerase I; acrofacial dysostosis; congenital heart defect; craniofacial anomalies; developmental delay; epilepsy; limb defects; neural crest cells; ribosomal RNA; ribosomopathies.


Conflict of interest statement

Declaration of interests A.B., M.J.G.S., K. McWalters, R.P., and R.S. are employees of GeneDx.

Figures

Figure 1
Figure 1
Human cohort phenotypes (A) Facial photographs of 12 individuals in the cohort. (B) Diagram of POLR1A with all reported variant locations indicated. Variants of individuals with photos are indicated in green triangles. Variants reported in this work are above and previously published variants are below the protein diagram. Of previously published affected individuals, IA1, IA2, and IA3 were reported by Weaver et al. and 7III3 was reported by Shenoy. IA3 variant details are c.3895G>T (p.Val1299Phe). Details for all other variants are contained within the manuscript and supplemental documents. (C) Phenotype summary of all individuals with heterozygous POLR1A variants.
Figure 2
Figure 2
Variant POLR1A effects on rRNA synthesis and nucleolar morphology (A) Scheme of rRNA synthesis analysis in a genome-edited HCT116 cell line. rRNA synthesis was monitored by incorporating 5-ethynyl-uridine (EU) in nucleoli after transfecting the plasmid containing a POLR1A variant fused with a HaloTag and subsequently adding the plant auxins, indole-3-acetic acid (IAA), for rapid degradation of endogenous POLR1A fused with mini-AID (mAID) and the fluorescent protein mClover (mAID + mClover). The scale bar represents 5 μm. (B) Boxplot of fluorescence intensity of EU normalized to HaloTag-POLR1A intensity in cells transiently expressing POLR1A corresponding to wild-type, p.Glu1330del, p.Cys1562Phe, p.Asp59Val, p.Val1631Met, p.Pro1638Leu, p.Met496Ile, p.Val1241Ile, p.Arg393His, and p.Glu593Gln POLR1A. Median values are indicated. p values for statistically significant difference between wild type and each variant are indicated above the boxplot of the mutant (Wilcoxon rank-sum test). n = 782 cells (wild-type POLR1A); n = 551 cells (Glu1330del), p < 2.2 × 10⁻¹⁶; n = 409 cells (Cys1562Phe), p < 2.2 × 10⁻¹⁶; n = 267 cells (Asp59Val), n = 381 cells (Val1631Met), p = 0.26; n = 384 cells (Pro1638Leu), p = 0.91; n = 317 cells (Met496Ile), p = 4.6 × 10−4; n = 496 cells (Val1241Ile), p = 0.038; n = 439 cells (Arg393His), p = 3.9 × 10⁻⁹; and n = 28 cells (Glu593Gln), p < 2.2 × 10−16. (C) Phylogeny shows the similarity of the nucleolar morphologies of wild type and nine POLR1A variants. HaloTag-POLR1A image sets were analyzed with the wndchrm program. (D) Localization of fluorescently labeled HaloTag-POLR1A variants. Each merged image of DAPI (cyan) and HaloTag-POLR1A variants (magenta) is the image with the average feature score out of a set of HaloTag-POLR1A variant images classified by FLDA with Top 438 features out of 2,919 image features computed by the wndchrm program. The scale bar represents 5 μm.
Figure 3
Figure 3
Polr1a craniofacial model (A) Polr1anull/flox; Wnt1-Cre embryos demonstrate more hypoplastic craniofacial primordia at E12 compared to Polr1aC1559F/flox; Wnt1-Cre. The scale bar represents 1,000 μm. (B) At E9, cell death (indicated by CC3 accumulation) is prominent in the first arch (dashed white line) of the Polr1aC1559F/flox; Wnt1-Cre mutant. The first arch of the Polr1anull/flox; Wnt1-Cre mutant has less CC3 but overall is smaller than in Polr1aC1559F/flox; Wnt1-Cre at the same stage. The scale bar represents 100 μm. (C) The outflow tract of Polr1anull/flox; Wnt1-Cre E12 mutants is not septated while the Polr1aC1559F/flox; Wnt1-Cre outflow tract is. (D) PECAM1 staining shows abnormal vasculature in Polr1anull/flox; Wnt1-Cre embryos at E11.5. The scale bar represents 100 μm. (E) Ink injections demonstrating Polr1anull/flox; Wnt1-Cre embryos have vascular leakage at E11.5. The scale bar represents 100 μm. (F) Compact myocardium of Polr1anull/flox; Wnt1-Cre left ventricle is thinner than control at E12 (left). There is no difference in compact myocardium thickness between control and Polr1aC1559F/flox; Wnt1-Cre mutants at E12 (right). Points are individual myocardium measurements and filled diamonds are the average for each embryo, n = 3 for each genotype. Of note, two diamonds are superimposed on the C1559F/flox plot. a, aorta; p, pulmonary trunk. p values calculated via Student’s t test (equal variance, two tailed, two sample). p < 0.05. The scale bar represents 100 μm.
Figure 4
Figure 4
Polr1a cardiovascular model (A) Hearts from Polr1anull/flox; Mef2c-AHF-Cre neonates (P0) demonstrate gross enlargement compared to control, and histology reveals only a single ventricle is present. The scale bar represents 1,000 μm (top) and 500 μm (bottom). (B) At E12, Polr1anull/flox; Mef2c-AHF-Cre mutants have an under-developed right ventricle and large ventricular septal defect (black arrowhead). The scale bar represents 100 μm. (C) At E10 the primordial right ventricle is smaller in width compared to control. The scale bar represents 100 μm. (D) At E10, section immunohistochemistry demonstrates a trend toward increased abundance of CC3 in the anterior heart field of Polr1anull/flox; Mef2c-AHF-Cre mutants (white arrows). Each genotype had n = 4 and p values were calculated via Welch’s t test (unequal variance, two tailed, two sample). Unequal variance was observed as a litter effect. ns, not significant (p > 0.05). OFT, outflow tract. The scale bar represents 100 μm.
Figure 5
Figure 5
Polr1a central nervous system model (A) At E12, cerebral cortex area is reduced in Polr1anull/flox; Foxg1-Cre compared to both Polr1aC1559F/flox; Foxg1-Cre and control. At E14 and E17, the Polr1anull/flox mutant cortex is smaller than Polr1aC1559F/flox, and both are smaller than control. Numbers of embryos per genotype are shown on the graph for each stage. Comparisons were made via Welch’s t test (unequal variance, 2-tailed, 2-sample) for E17 and E14 embryos and Student’s t test (equal variance, 2-tailed, 2-sample) for E12 embryos. p < 0.05, ∗∗p < 0.005, ∗∗∗p < 0.0005, and ∗∗∗∗p < 0.00005. The scale bars represent 1,000 μm (top), 500 μm (middle), and 1,000 μm (bottom). (B) At E12, there is a statistically significant increase in CC3 detected in Polr1aC1559F/flox; Foxg1-Cre cortex compared to control (p < 0.05). There is also increased CC3 detected in Polr1anull/flox; Foxg1-Cre cortex compared to control though it does not reach statistical significance (ns, not significant). The Polr1anull/flox; Foxg1-Cre comparison had n = 4 embryos per genotype, and the Polr1aC1559F/flox; Foxg1-Cre comparison had n = 5 embryos per genotype. p values were calculated by Welch’s t test (unequal variance, two tailed, two sample). Bottom row shows close-up images of CC3 (red channel) in the areas indicated by white boxes in the top row images. The scale bars represent 100 μm (top) and 50 μm (bottom). (C) Bulk RNA-seq of brains from both mutants at E12 demonstrates a subset of differentially regulated (DE) genes between each mutant and controls. (D) Gene ontology analysis of DE genes shows increased expression of genes involved in apoptosis in Polr1aC1559F/flox; Foxg1-Cre mutants and reduced expression of genes involved in forebrain neuron differentiation and transcription regulation in Polr1anull/flox; Foxg1-Cre mutants.

References

    1. Misiaszek A.D., Girbig M., Grötsch H., Baudin F., Murciano B., Lafita A., Müller C.W. Cryo-EM structures of human RNA polymerase I. Nat. Struct. Mol. Biol. 2021;28:997–1008. - PMC - PubMed
    1. Vincent M., Geneviève D., Ostertag A., Marlin S., Lacombe D., Martin-Coignard D., Coubes C., David A., Lyonnet S., Vilain C., et al. Treacher Collins syndrome: a clinical and molecular study based on a large series of patients. Genet. Med. 2016;18:49–56. - PubMed
    1. Dauwerse J.G., Dixon J., Seland S., Ruivenkamp C.A.L., van Haeringen A., Hoefsloot L.H., Peters D.J.M., Boers A.C.d., Daumer-Haas C., Maiwald R., et al. Mutations in genes encoding subunits of RNA polymerases I and III cause Treacher Collins syndrome. Nat. Genet. 2011;43:20–22. - PubMed
    1. Schaefer E., Collet C., Genevieve D., Vincent M., Lohmann D.R., Sanchez E., Bolender C., Eliot M.M., Nürnberg G., Passos-Bueno M.R., et al. Autosomal recessive POLR1D mutation with decrease of TCOF1 mRNA is responsible for Treacher Collins syndrome. Genet. Med. 2014;16:720–724. - PubMed
    1. Thiffault I., Wolf N.I., Forget D., Guerrero K., Tran L.T., Choquet K., Lavallée-Adam M., Poitras C., Brais B., Yoon G., et al. Recessive mutations in POLR1C cause a leukodystrophy by impairing biogenesis of RNA polymerase III. Nat. Commun. 2015;6:7623. - PMC - PubMed

Publication types