. 2023 May 2;35(5):786-806.e13.
doi: 10.1016/j.cmet.2023.03.019. Epub 2023 Apr 18.

Nutrient-sensing AgRP neurons relay control of liver autophagy during energy deprivation

Affiliations

Nutrient-sensing AgRP neurons relay control of liver autophagy during energy deprivation

Weiyi Chen et al. Cell Metab. .

Abstract

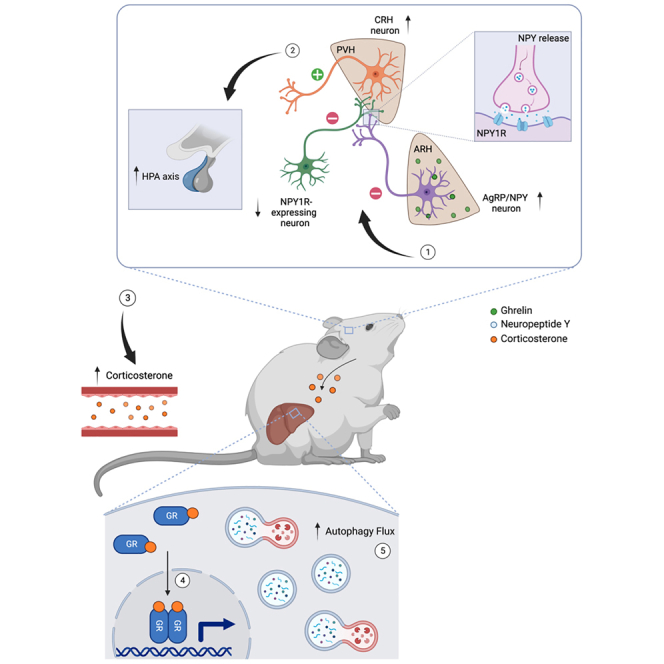
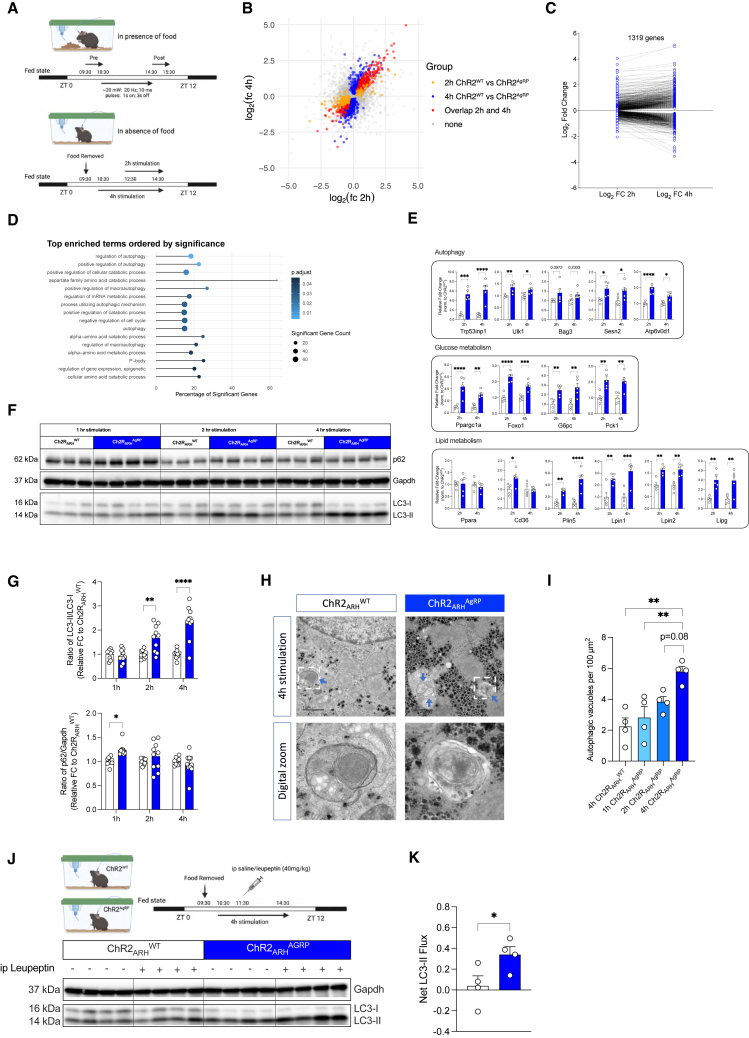
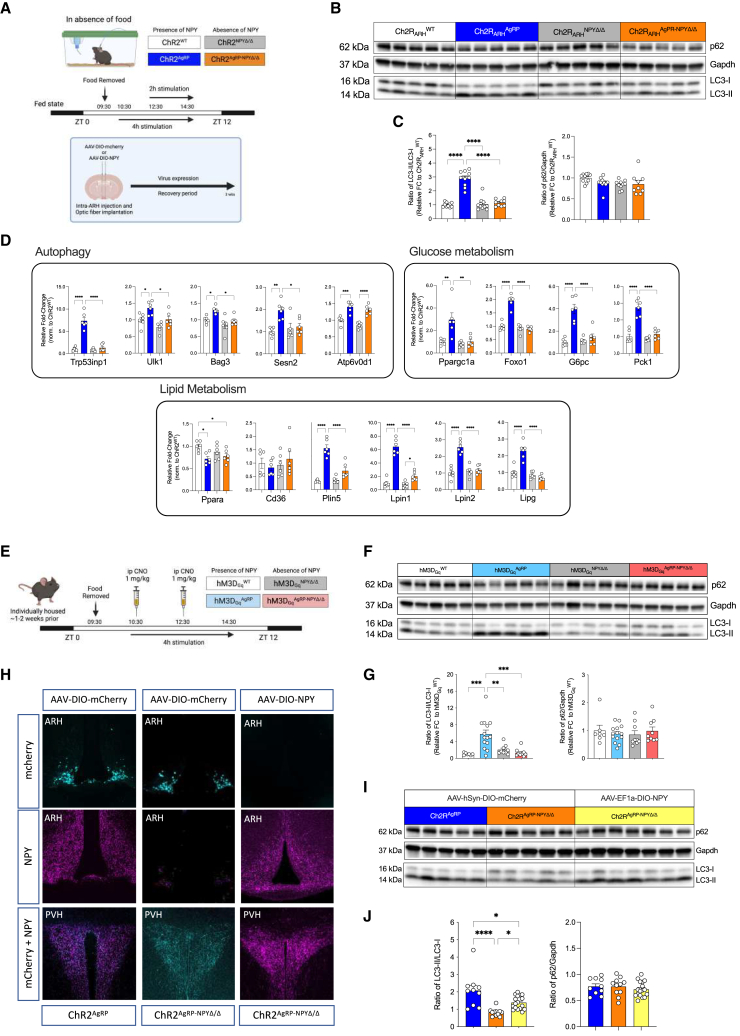
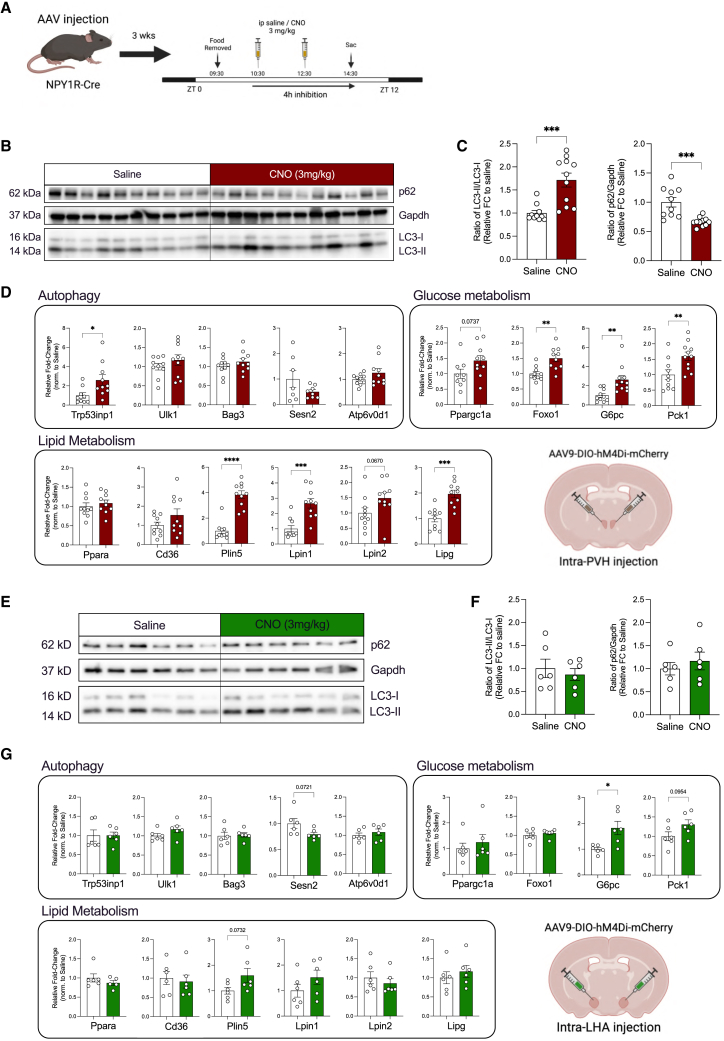
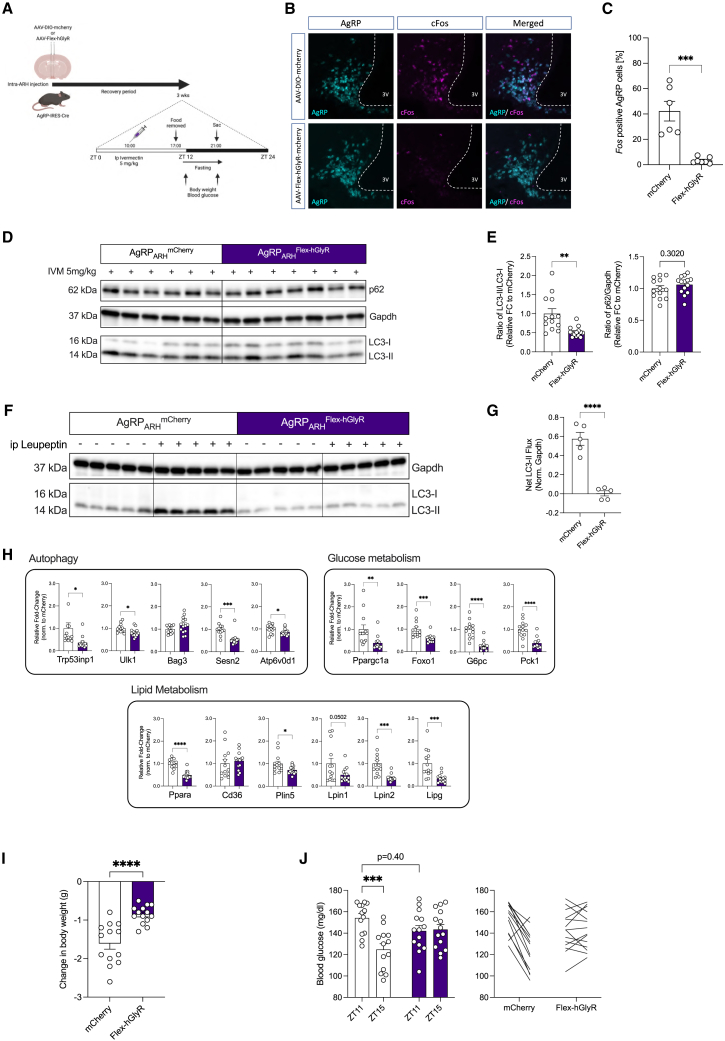
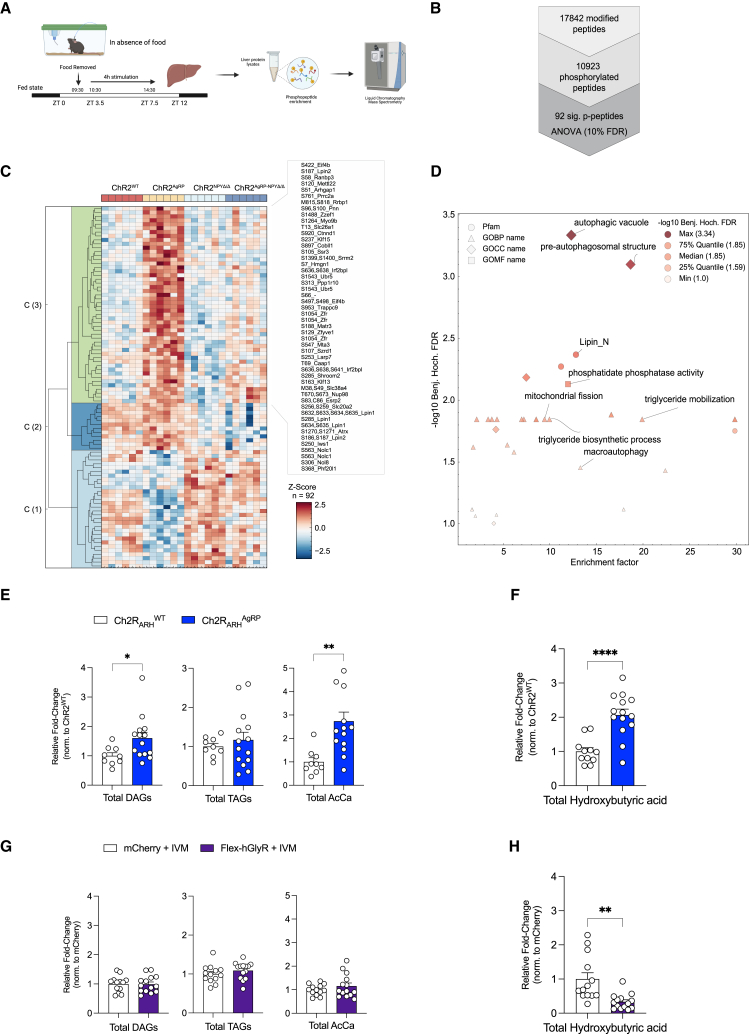
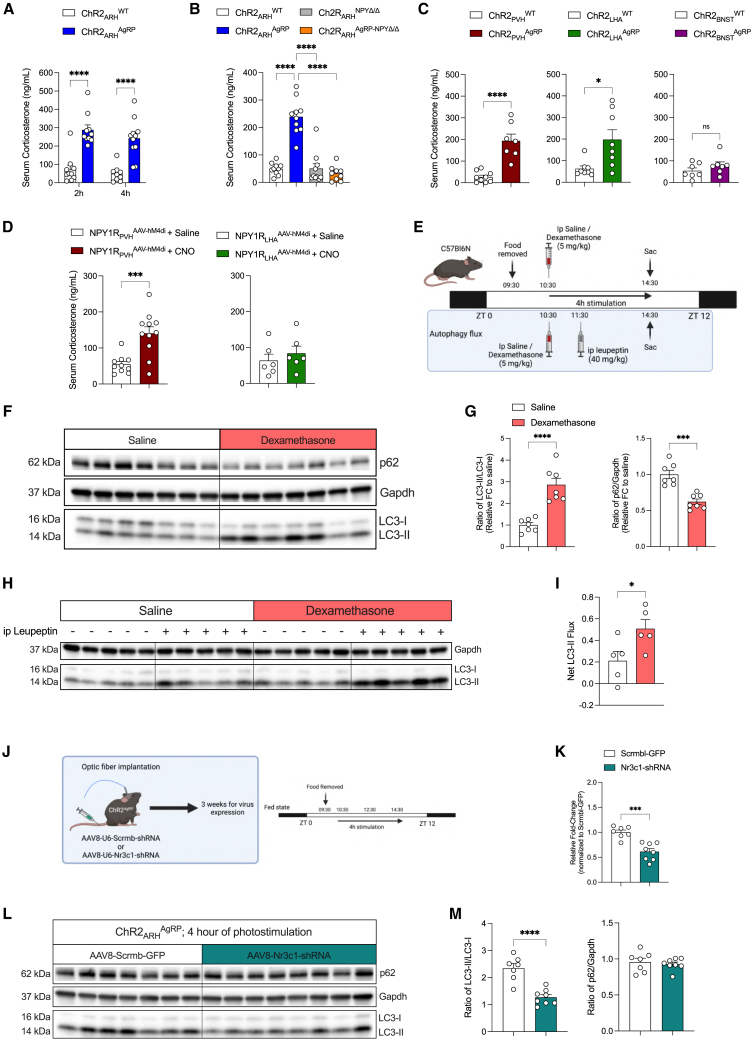
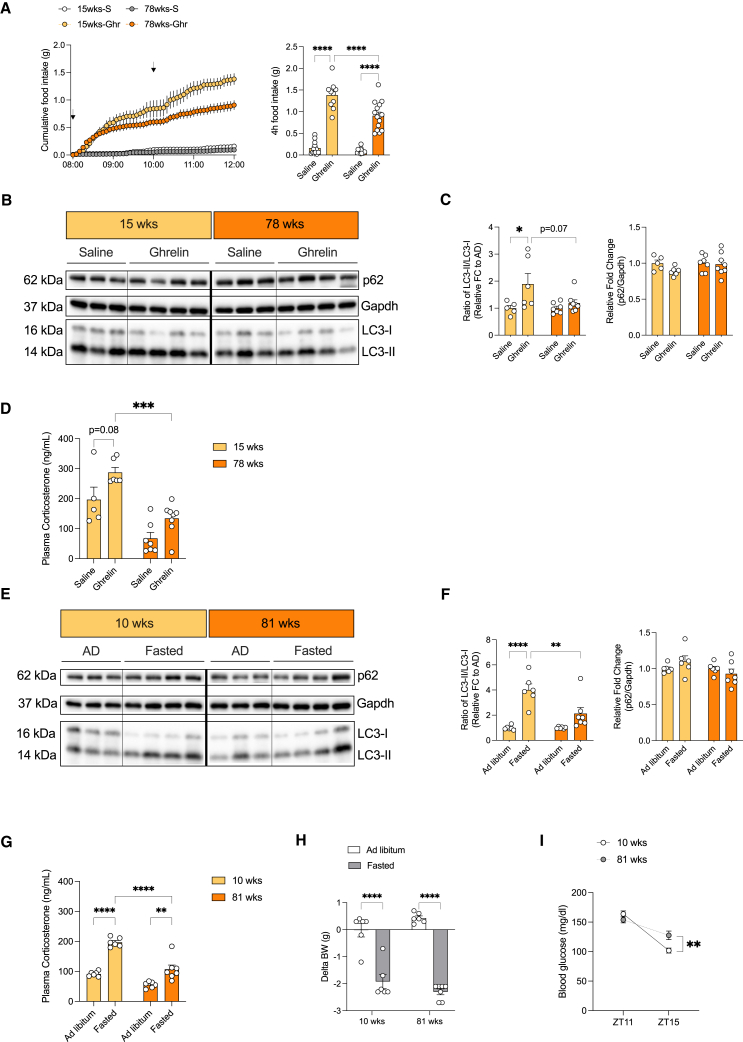
Autophagy represents a key regulator of aging and metabolism in sensing energy deprivation. We find that fasting in mice activates autophagy in the liver paralleled by activation of hypothalamic AgRP neurons. Optogenetic and chemogenetic activation of AgRP neurons induces autophagy, alters phosphorylation of autophagy regulators, and promotes ketogenesis. AgRP neuron-dependent induction of liver autophagy relies on NPY release in the paraventricular nucleus of the hypothalamus (PVH) via presynaptic inhibition of NPY1R-expressing neurons to activate PVHCRH neurons. Conversely, inhibiting AgRP neurons during energy deprivation abrogates induction of hepatic autophagy and rewiring of metabolism. AgRP neuron activation increases circulating corticosterone concentrations, and reduction of hepatic glucocorticoid receptor expression attenuates AgRP neuron-dependent activation of hepatic autophagy. Collectively, our study reveals a fundamental regulatory principle of liver autophagy in control of metabolic adaptation during nutrient deprivation.

Keywords: AgRP neurons; CRH neurons; HPA axis; NPY1R; autophagy; corticosterone; hypothalamus; liver metabolism; non-cell autonomous; short-term fasting.


Conflict of interest statement

Declaration of interests The authors declare no competing interests.

Figures

None
Graphical abstract
Figure 1
Figure 1
Optogenetic stimulation of AgRP neurons induces autophagy in the liver (A) Experimental design for optogenetic activation of AgRP neurons in the presence and absence of food. (B) Scatterplot of the Log2-fold changes of 2 h (yellow), 4 h (blue), and overlapping hepatic transcripts (red) between 2 and 4 h stimulations (n = 5 animals/group). Each colored dot represents a significantly regulated gene. (C) Log2-fold change of hepatic gene expression that increase or decrease after 2 and 4 h of AgRP neuron activation. (D) Fisher’s exact test results represented in a bar chart showing significantly enriched gene ontology terms and the percentage of significantly regulated genes. (E) Validation of gene expression related to autophagy, glucose metabolism, and lipid metabolism by quantitative real-time PCR; data are normalized to the respective ChR2WT group and represented as scatter dot plots with individual values relative to Tbp expression (n = 5 animals/group). (F) Representative western blot analysis of liver homogenates from 1, 2, and 4 h optogenetically stimulated ChR2WT and ChR2AgRP mice, showing autophagic marker proteins LC3-I, LC3-II, and p62 and the corresponding gapdh loading control (see Figure S2C for additional western blots used for quantification). (G) Densitometric analysis of the autophagic marker proteins in post-nuclear supernatants of liver extracts of 1, 2, and 4 h optogenetic stimulated ChR2WT and ChR2AgRP mice (n = 9–10 animals/group/time point). (H) Representative TEM images of liver sections of 4 h optogenetic-stimulated ChR2WT and ChR2AgRP mice. (TOP) Autophagic vacuoles are indicated by blue arrows and digital zoom image of a double-membrane autophagosome outlined by the white-dotted box. Scale bars, 1 μm. (I) Quantification of double-membrane autophagic vacuoles per 100 μm2 following 1, 2, or 4 h of optogenetic stimulation in ChR2WT and ChR2AgRP mice (n = 4 animals/group/time point; ∼20 images/animal/liver). (J) Experimental design and representative western blot analysis of liver homogenates from leupeptin-based LC3-II flux analysis in vivo following 4 h of optogenetic activation of AgRP neurons. Mice were injected with saline as controls (n = 4 animals/group). (K) Net LC3-II flux in the liver as described in (J) (n = 4 animals/group). Data are represented as mean ± SEM. Statistical analyses were performed by two-way ANOVA followed by Šídák post hoc tests (for E and F without repeated-measure [RM]), one-way ANOVA followed by Tukey’s post hoc test (for I) or unpaired two-tailed Student’s t tests (for K). p ≤ 0.05; ∗∗p ≤ 0.01; ∗∗∗p ≤ 0.001, ∗∗∗∗p ≤ 0.0001 (see also Figures S1 and S2).
Figure 2
Figure 2
AgRP-mediated control of hepatic autophagy requires expression of NPY (A) Workflow for virus-mediated re-expression of NPY in the ARH, experimental design for optogenetic stimulation of AgRP neurons in the presence and absence of NPY. (B) Representative western blots using liver extracts from fed ChR2WT, ChR2AgRP, ChR2 NPYΔ/Δ, and ChR2AgRP-NPYΔ/Δ mice after 4 h of photostimulation (see Figure S6A for additional western blot used for quantification). (C) Densitometric analysis of the ratio of LC3-II/LC3-I (LC3) and p62/Gapdh as autophagic marker proteins in post-nuclear supernatants of liver homogenates from mice in (B) (n = 9–10 animals/group). (D) Quantitative real-time PCR analyses of genes related to autophagy, glucose metabolism, and lipid metabolism; data are normalized to ChR2WT littermates and represented as scatter dot plots with individual values relative to Tbp expression (n = 6 animals/group). (E) Experimental design for DREADD stimulation of AgRP neurons in the presence and absence of NPY. (F) Representative western blots of liver extracts from fed hM3DgqWT, hM3DgqAgRP, hM3DgqNPYΔ/Δ, and hM3DgqAgRP-NPYΔ/Δ mice sacrificed at ZT7.5 after i.p. injections of CNO (1 mg/kg) at ZT3.5 and ZT5.5 (see also Figure S6F for additional western blots used for quantification). (G) Densitometric analysis of the ratio of LC3-II/LC3-I (LC3) and p62/Gapdh as autophagic marker proteins in post-nuclear supernatants of liver homogenates from hM3DgqWT (n = 7), hM3DgqAgRP (n = 14), hM3DgqNPYΔ/Δ (n = 9), and hM3DgqAgRP-NPYΔ/Δ (n = 9) mice. (H) Representative confocal images indicating successful expression of bilaterally injected control virus (AAV-DIO-mCherry) in ChR2AgRP and ChR2AgRP-NPYΔ/Δ mice, and NPY virus (AAV-DIO-NPY) in ChR2AgRP-NPYΔ/Δ mice in the ARH. Note that NPY containing fibers in the ARH and PVH were detected in ChR2AgRP-NPYΔ/Δ mice with re-expression of NPY using immunohistochemistry; this is absent in the corresponding control. (I) Representative western blots of autophagic marker proteins using liver extracts from mice in (H) after 4 h of optogenetic stimulation (see also Figure S6G for additional replicates used for quantification). (J) Densitometric analysis of the ratio of LC3-II/LC3-I (LC3) and p62/Gapdh as autophagic marker proteins in post-nuclear supernatants of liver homogenates from mice in (I) (n = 10–17 animals/group). Data are represented as mean ± SEM. Statistical analyses were performed by one-way ANOVA followed by Tukey’s post hoc test. p ≤ 0.05; ∗∗p ≤ 0.01; ∗∗∗p ≤ 0.001, ∗∗∗∗p ≤ 0.0001 (see also Figure S6).
Figure 3
Figure 3
NPY1R inhibition in the PVH promotes liver autophagy (A) Workflow for PVH or LHA-targeted delivery of Cre-dependent AAV-hM4di in NPY1R-Cre mice and experimental design for the CNO-mediated inhibition of NPY1R-expressing neurons. (B) Representative western blots of 4 h inhibition of PVHNPY1R neurons following saline or CNO (3 mg/kg) treatment. (C) Densitometric analysis of the ratio of LC3-II/LC3-I (LC3) and p62/Gapdh as autophagic marker proteins in liver homogenates from mice in (B) (n = 10–11 animals/group). (D) Quantitative real-time PCR analyses of genes related to autophagy, glucose and lipid metabolism; data are normalized to the saline group and represented as scatter dot plots with individual values relative to Tbp expression (n = 7–11 animals/group) (E) Representative western blots of 4 h inhibition of LHANPY1R neurons following saline or CNO (3 mg/kg) treatment. (F) Densitometric analysis of the ratio of LC3-II/LC3-I (LC3) and p62/Gapdh as autophagic marker proteins in liver homogenates from mice in (E) (n = 6 animals/group). (G) Quantitative real-time PCR analyses of genes related to autophagy, glucose metabolism, and lipid metabolism; data are normalized to the saline group and represented as scatter dot plots with individual values relative to Tbp expression (n = 6 animals/group). Data are represented as mean ± SEM. Statistical analyses were performed by unpaired two-tailed Student’s t tests. p ≤ 0.05; ∗∗p ≤ 0.01; ∗∗∗p ≤ 0.001, ∗∗∗∗p ≤ 0.0001 (see also Figure S13).
Figure 4
Figure 4
Hepatic autophagy induction on short-term nutrient deprivation requires AgRP neuron activation (A) Workflow for virus-mediated expression of either mCherry or hGlyR in AgRP neurons, experimental design for the chemogenetic inhibition of AgRP neuron. (B) Representative confocal images showing AgRP (Cyan) and cFos (Magenta) mRNA expression in the ARH of 4 h fasted AgRP-IRES-Cre mice with bilateral intra-ARH injection of AAV-DIO-mCherry or AAV-Flex-hGlyR following ivermectin (IVM) injection. (C) Quantification of cFos-positive AgRP neurons from mice in (B) following i.p. IVM injection and a 4 h, short-term fast (n = 6–7 animals/group). (D) Representative western blots of liver extracts from mice in (B) after a short-term fasting in the dark cycle (see also Figure S10C for additional replicates used for quantification). (E) Densitometric analysis of the ratio of LC3-II/LC3-I (LC3) and p62/Gapdh as autophagic marker proteins in liver homogenates from mice in (B) (n = 13–14 animals/group). (F) Representative western blot analysis of liver homogenates from leupeptin-based LC3-II flux analysis in vivo following the inhibition of AgRP neuron and a 4 h, short-term fast. Mice were injected with saline as controls. (G) Densitometric analysis of net LC3-II flux from liver homogenates from mice in (F) (n = 5 animals/group). (H) Quantitative real-time PCR analyses of genes related to autophagy, glucose and lipid metabolism; data are normalized to mice injected with AAV-DIO-mCherry and represented as scatter dot plots with individual values relative to Tbp expression (n = 13–14 animals/group). (I) Change in body weight between ZT11 and ZT15 on a 4 h fast (n = 13–14 animals/group). (J) Blood glucose measurements at baseline (ZT11) and after 4 h fast (ZT15); represented as blood glucose levels of individual animal before and after fasting (n = 13–14 animals/group). Data are represented as mean ± SEM. Statistical analyses were performed by unpaired two-tailed Student’s t tests (for C, E, F, and G) or two-way RM ANOVA followed by Šídák post hoc test (for H). p ≤ 0.05; ∗∗p ≤ 0.01; ∗∗∗p ≤ 0.001, ∗∗∗∗p ≤ 0.0001 (see also Figure S10).
Figure 5
Figure 5
AgRP neuron activation promotes hepatic phosphoproteom changes in pathways associated with autophagy and lipid mobilization (A) Schematic representation of the liver phosphoproteomics workflow. (B) Number of identified phosphorylated peptides. Significantly altered phosphopeptides were identified using a one-way ANOVA and a permutation-based false discovery rate (FDR) cutoff of 0.10. (C) Hierarchical clustering of significantly altered hepatic phosphopeptides in individual ChR2WT, ChR2AgRP, ChR2 NPYΔ/Δ and ChR2AgRP-NPYΔ/Δ mice after 4 h photostimulation (n = 6 animals/group). The row dendrogram was calculated using Euclidean distance and complete methods. (D) Scatterplot showing the significant enriched GO terms of differentially regulated phosphopeptides clusters. p values were corrected for multiple testing by the Benjamini-Hochberg (BH) procedure. (E) Total diglycerides (DAGs), triacylglycerides (TAGs), and acyl carnitines (AcCa) concentrations in the liver of 4 h photostimulated ChR2WT and ChR2AgRP mice (n = 9–14 animals/group). (F) Liver hydroxybutyric acid concentrations in 4 h photostimulated ChR2WT and ChR2AgRP mice (n = 11–14 animals/group). (G) Total diglycerides (DAGs), triacylglycerides (TAGs) and acyl carnitines (AcCa) concentrations in the liver following a short-term 4 h fast and the simultaneous chemogenetic inhibition of AgRP neurons (n = 13–14 animals/group). (H) Liver hydroxybutyric acid concentrations following a short-term 4 h fast and simultaneous chemogenetic inhibition of AgRP neurons (n = 13–14 animals/group). Data are represented as mean ± SEM. Statistical analyses were performed by unpaired two-tailed Student’s t test (for E, F, G, and H). p ≤ 0.05; ∗∗p ≤ 0.01; ∗∗∗p ≤ 0.001, ∗∗∗∗p ≤ 0.0001 (see also Figures S11 and S12).
Figure 6
Figure 6
AgRP neuron activation increases circulating corticosterone concentrations to promote hepatic autophagy (A) Serum corticosterone levels after 2 and 4 h optogenetic stimulation of AgRP neurons (n = 9–11 animals/group). (B) Serum corticosterone levels after 4 h optogenetic stimulation of AgRP neurons in the presence or absence of NPY (n = 9–10 animals/group). (C) Serum corticosterone levels after 4 h of optogenetic AgRP → PVH, AgRP → LHA, or AgRP → BNST projection stimulation (n = 7–9 animals/group/projection). (D) Serum corticosterone levels after 4 h of chemogenetic PVHNPY1R or LHANPY1R neuron inhibition (n = 6–11 animals/group/projection). (E) Experimental design for i.p. dexamethasone treatment alone and in combination with lysosomal inhibitor (leupeptin) to measure autophagy flux in vivo. (F) Representative western blots of liver homogenates from C57BL/6N mice which received either a single i.p. injection of saline or dexamethasone. Gapdh was used as loading control. (G) Densitometric analysis of the ratio of LC3-II/LC3-I (LC3) and p62/Gapdh as autophagic marker proteins in liver homogenates from mice in (F) (n = 7 animals/group). (H) Representative western blots of liver homogenates from C57BL/6N mice which received either an i.p. injection of saline/leupeptin, 1 h after saline/dexamethasone treatment. Gapdh was used as loading control. (I) Net LC3-II flux in the liver as described in (H) (n = 5 animals/group). (J) Experimental design for AAV-mediated expression of either Scrmb- or Nr3c1-shRNA in the liver of ChR2AgRP mice 3 weeks prior to 4 h optogenetic stimulation in the absence of food. (K) Validation of the knock down of Nr3c1 in the liver by qPCR (n = 7–8 animals/group). (L) Representative western blots of hepatic autophagic marker proteins from mice in (J). (M) Densitometric analysis of the ratio of LC3-II/LC3-I (LC3) and p62/Gapdh as autophagic marker proteins in liver homogenates from mice in (L) (n = 7–8 animals/group). Data are represented as mean ± SEM. Statistical analyses were performed by two-way ANOVA followed by Šídák post hoc tests (for A), one-way ANOVA followed by Tukey’s post hoc tests (for B) or unpaired two-tailed Student’s t test (for C, D, G, I, K, and M). ns, not significant, p ≤ 0.05; ∗∗p ≤ 0.01; ∗∗∗p ≤ 0.001, ∗∗∗∗p ≤ 0.0001 (see also Figure S14).
Figure 7
Figure 7
Aging impairs ghrelin and fasting-mediated activation of the HPA-axis and hepatic autophagy (A) Cumulative food intake over a period of 4 h following either i.c.v. saline (S) or Ghrelin (Ghr) injection in 15 and 78 weeks old C57BL/6J mice as indicated by the black arrows. (Right) Depiction of total food intake after 4 h treatment (n = 10–15 animals/group/treatment; crossover experiment). (B) Representative Western blots of liver homogenates from 15 and 78 weeks old C57BL/6J mice after i.c.v. treatment of saline or Ghrelin in the absence of food. Gapdh was used as loading control. Bold line indicates dissection. (C) Densitometric analysis of autophagic marker proteins in liver homogenates from mice in (B) (n = 5–8 animals/group/treatment). (D) Plasma corticosterone concentrations of 15 and 78 weeks old C57BL/6J mice 4 h after either central saline or ghrelin delivery (n = 5–8 animals/group/treatment). (E) Representative western blots of liver homogenates from C57BL/6J mice of 10 and 81 weeks old which were either ad libitum fed or fasted for 4 h into the dark cycle. Gapdh was used as the loading control. Bold line indicates dissection. (F) Densitometric analysis of autophagic marker proteins in liver homogenates from mice in (E) (n = 6–7 animals/group/treatment). (G) Plasma corticosterone concentrations of mice in (E) (n = 6–7 animals/group/treatment). (H) Change in body weight after 4 h of fasting into the dark cycle (n = 6–7 animals/group/treatment). (I) Blood glucose concentrations of ad libitum fed and fasted C57BL/6J mice at ZT11 and ZT15 respectively (n = 6–7 animals/group/time point). Data are represented as mean ± SEM. Statistical analyses were performed by two-way ANOVA followed by Šídák post hoc tests (for A, C, D, F, and G; without RM, for H and I; RM for treatment). ns, not significant, p ≤ 0.05; ∗∗p ≤ 0.01; ∗∗∗p ≤ 0.001, ∗∗∗∗p ≤ 0.0001 (see also Figure S14 for full western blots).

Comment in

References

    1. Perez-Riverol Y., Csordas A., Bai J., Bernal-Llinares M., Hewapathirana S., Kundu D.J., Inuganti A., Griss J., Mayer G., Eisenacher M., et al. The PRIDE database and related tools and resources in 2019: improving support for quantification data. Nucleic Acids Res. 2019;47:D442–D450. doi: 10.1093/nar/gky1106. - DOI - PMC - PubMed
    1. Timper K., Brüning J.C. Hypothalamic circuits regulating appetite and energy homeostasis: pathways to obesity. Dis. Model. Mech. 2017;10:679–689. doi: 10.1242/dmm.026609. - DOI - PMC - PubMed
    1. Jais A., Brüning J.C. Arcuate nucleus-dependent regulation of metabolism – pathways to obesity and diabetes mellitus. Endocr. Rev. 2022;43:314–328. doi: 10.1210/endrev/bnab025. - DOI - PMC - PubMed
    1. Gropp E., Shanabrough M., Borok E., Xu A.W., Janoschek R., Buch T., Plum L., Balthasar N., Hampel B., Waisman A., et al. Agouti-related peptide-expressing neurons are mandatory for feeding. Nat. Neurosci. 2005;8:1289–1291. doi: 10.1038/nn1548. - DOI - PubMed
    1. Luquet S., Perez F.A., Hnasko T.S., Palmiter R.D. NPY/AgRP neurons are essential for feeding in adult mice but can be ablated in neonates. Science. 2005;310:683–685. doi: 10.1126/science.1115524. - DOI - PubMed

Publication types

Substances