Surface Active Salivary Metabolites Indicate Oxidative Stress and Inflammation in Obstructive Sleep Apnea
- PMID: 37075797
- PMCID: PMC10186124
- DOI: 10.4168/aair.2023.15.3.316
Surface Active Salivary Metabolites Indicate Oxidative Stress and Inflammation in Obstructive Sleep Apnea
Abstract
Purpose: Obstructive sleep apnea (OSA), a highly prevalent and potentially serious sleep disorder, requires effective screening tools. Saliva is a useful biological fluid with various metabolites that might also influence upper airway patency by affecting surface tension in the upper airway. However, little is known about the composition and role of salivary metabolites in OSA. Therefore, we investigated the metabolomics signature in saliva from the OSA patients and evaluated the associations between identified metabolites and salivary surface tension.
Methods: We studied 68 subjects who visited sleep clinic due to the symptoms of OSA. All underwent full-night in-lab polysomnography. Patients with apnea-hypopnea index (AHI) < 10 were classified to the control, and those with AHI ≥ 10 were the OSA groups. Saliva samples were collected before and after sleep. The centrifuged saliva samples were analyzed by liquid chromatography with high-resolution mass spectrometry (ultra-performance liquid chromatography-tandem mass spectrometry; UPLC-MS/MS). Differentially expressed salivary metabolites were identified using open source software (XCMS) and Compound Discoverer 2.1. Metabolite set enrichment analysis (MSEA) was performed using MetaboAnalyst 5.0. The surface tension of the saliva samples was determined by the pendant drop method.
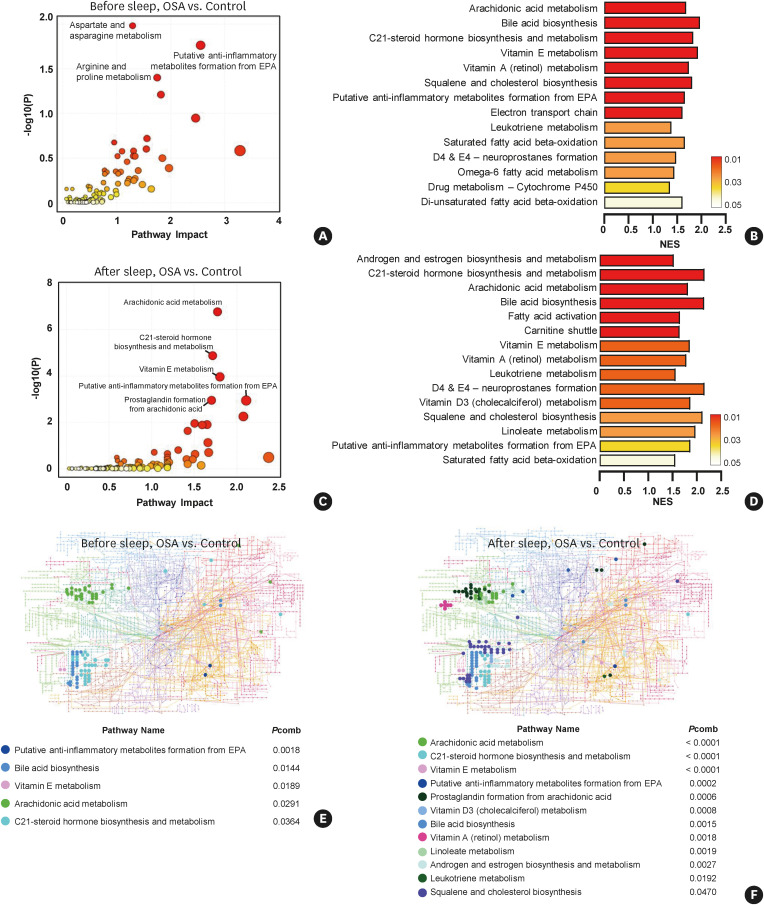
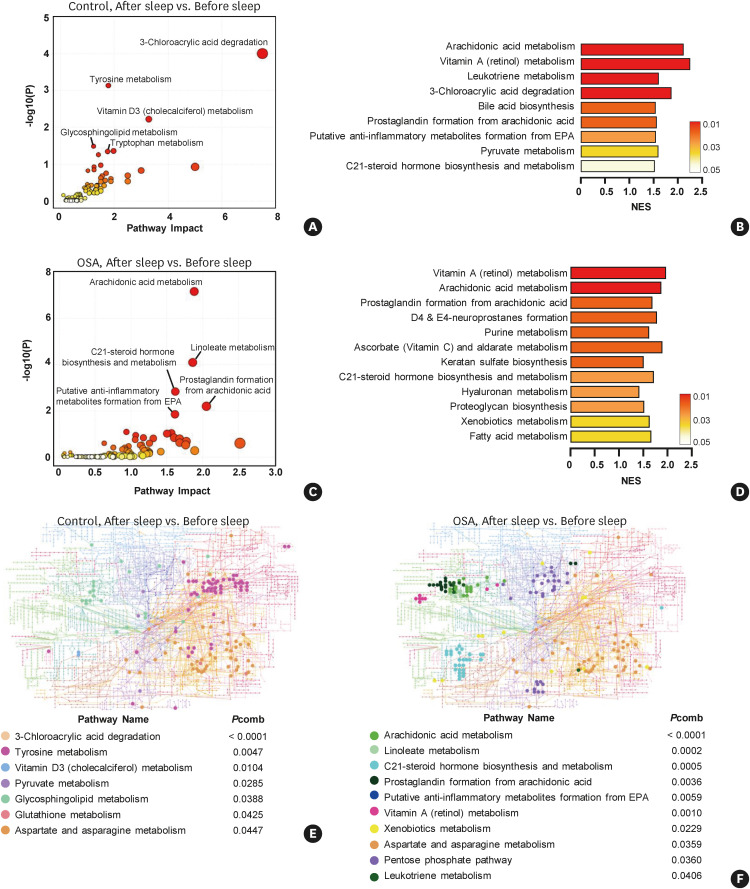
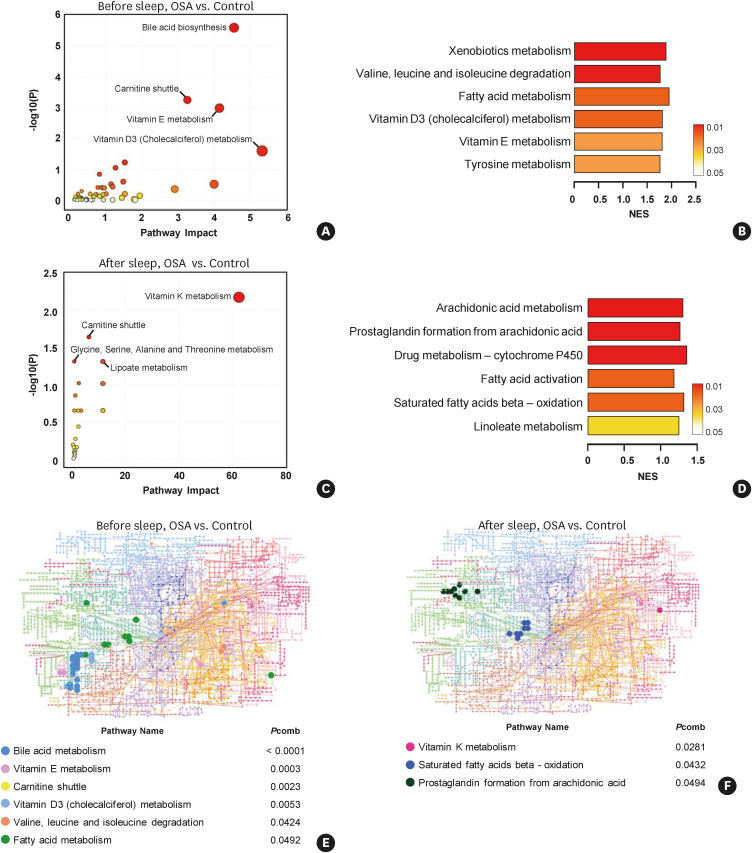
Results: Three human-derived metabolites (1-palmitoyl-2-[5-hydroxyl-8-oxo-6-octenoyl]-sn-glycerol-3-phosphatidylcholine [PHOOA-PC], 1-palmitoyl-2-[5-keto-8-oxo-6-octenoyl]-sn-glycerol-3-phosphatidylcholine [KPOO-PC], and 9-nitrooleate) were significantly upregulated in the after-sleep salivary samples from the OSA patients compared to the control group samples. Among the candidate metabolites, only PHOOA-PC was correlated with the AHI. In OSA samples, salivary surface tension decreased after sleep. The differences in surface tension were negatively correlated with PHOOA-PC and 9-nitrooleate concentrations. Furthermore, MSEA revealed that arachidonic acid-related metabolism pathways were upregulated in the after-sleep samples from the OSA group.
Conclusions: This study revealed that salivary PHOOA-PC was correlated positively with the AHI and negatively with salivary surface tension in the OSA group. Salivary metabolomic analysis may improve our understanding of upper airway dynamics and provide new insights into novel biomarkers and therapeutic targets in OSA.
Keywords: Sleep apnea, obstructive; airway resistance; biomarkers; metabolomics; phosphatidylcholines; saliva; sleep; surface tension.
Copyright © 2023 The Korean Academy of Asthma, Allergy and Clinical Immunology • The Korean Academy of Pediatric Allergy and Respiratory Disease.
Conflict of interest statement
There are no financial or other issues that might lead to conflict of interest.
Figures


Similar articles
-
Increased phosphatidylcholine concentration in saliva reduces surface tension and improves airway patency in obstructive sleep apnoea.J Oral Rehabil. 2013 Oct;40(10):758-66. doi: 10.1111/joor.12094. Epub 2013 Aug 30. J Oral Rehabil. 2013. PMID: 24033347
-
The Association of Salivary Biomarkers With the Severity of Obstructive Sleep Apnea and Concomitant Hypertension.Am J Med Sci. 2019 Jun;357(6):468-473. doi: 10.1016/j.amjms.2019.03.004. Epub 2019 Mar 22. Am J Med Sci. 2019. PMID: 31126512
-
Salivary parameters and periodontal inflammation in obstructive sleep apnoea patients.Sci Rep. 2022 Nov 12;12(1):19387. doi: 10.1038/s41598-022-23957-5. Sci Rep. 2022. PMID: 36371504 Free PMC article.
-
Continuous Positive Airway Pressure vs Mandibular Advancement Devices in the Treatment of Obstructive Sleep Apnea: An Updated Systematic Review and Meta-Analysis.Cureus. 2022 Jan 31;14(1):e21759. doi: 10.7759/cureus.21759. eCollection 2022 Jan. Cureus. 2022. PMID: 35251830 Free PMC article. Review.
-
Salivary biomarkers associated with obstructive sleep apnea: a systematic review.Expert Rev Mol Diagn. 2021 Feb;21(2):223-233. doi: 10.1080/14737159.2021.1873132. Epub 2021 Jan 17. Expert Rev Mol Diagn. 2021. PMID: 33404265
Cited by
-
Role of Oxidative Stress in the Occurrence and Development of Cognitive Dysfunction in Patients with Obstructive Sleep Apnea Syndrome.Mol Neurobiol. 2024 Aug;61(8):5083-5101. doi: 10.1007/s12035-023-03899-3. Epub 2023 Dec 30. Mol Neurobiol. 2024. PMID: 38159196 Review.
-
A New Simpler and More Accurate Approach to the Diagnosis of Sleep Apnea.Allergy Asthma Immunol Res. 2023 May;15(3):276-278. doi: 10.4168/aair.2023.15.3.276. Allergy Asthma Immunol Res. 2023. PMID: 37188484 Free PMC article. No abstract available.
-
Critical Factors in Sample Collection and Preparation for Clinical Metabolomics of Underexplored Biological Specimens.Metabolites. 2024 Jan 5;14(1):36. doi: 10.3390/metabo14010036. Metabolites. 2024. PMID: 38248839 Free PMC article. Review.
-
Potential non-invasive biomarkers of chronic sleep disorders identified by salivary metabolomic profiling among middle-aged Japanese men.Sci Rep. 2025 Apr 21;15(1):10980. doi: 10.1038/s41598-025-95403-1. Sci Rep. 2025. PMID: 40258870 Free PMC article.
-
Exploring Biomarkers in Asthma: Insights From Serum Metabolomics.Allergy Asthma Immunol Res. 2024 May;16(3):211-213. doi: 10.4168/aair.2024.16.3.211. Allergy Asthma Immunol Res. 2024. PMID: 38910279 Free PMC article. No abstract available.
References
-
- Lévy P, Kohler M, McNicholas WT, Barbé F, McEvoy RD, Somers VK, et al. Obstructive sleep apnoea syndrome. Nat Rev Dis Primers. 2015;1:15015. - PubMed
-
- Maeder MT, Mueller C, Schoch OD, Ammann P, Rickli H. Biomarkers of cardiovascular stress in obstructive sleep apnea. Clin Chim Acta. 2016;460:152–163. - PubMed