

Payer shifting after expansions in access to private care among veterans
- PMID: 37076113
- PMCID: PMC10622298
- DOI: 10.1111/1475-6773.14162
Payer shifting after expansions in access to private care among veterans
Abstract
Objective: To investigate whether expanded access to Veterans Affairs (VA)-purchased care increased overall utilization or induced a shift from other payers to VA for emergency care among VA enrollees.
Data sources and study setting: This study included all emergency department (ED) encounters in 2019 from hospitals in the state of New York.
Study design: We conducted a difference-in-differences analysis comparing VA enrollees to the general population before and after the implementation of the Maintaining Internal Systems and Strengthening Integrated Outside Networks (MISSION) Act in June 2019.
Data collection/extraction methods: We included all ED visits with individuals aged 30 or older at the time of the encounter. Individuals were considered eligible for the policy change if they were enrolled with VA at the beginning of 2019.
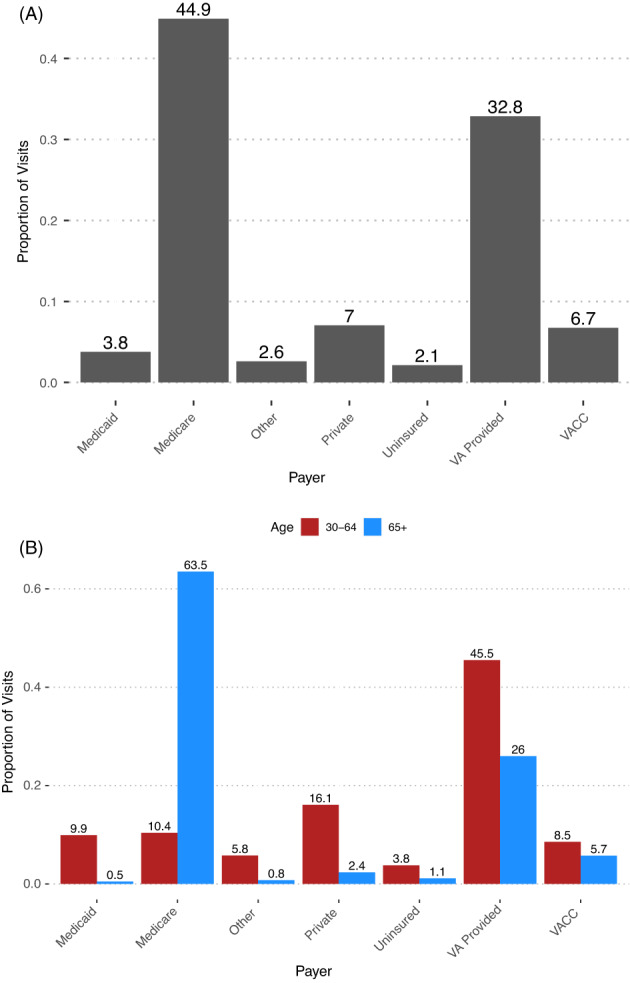
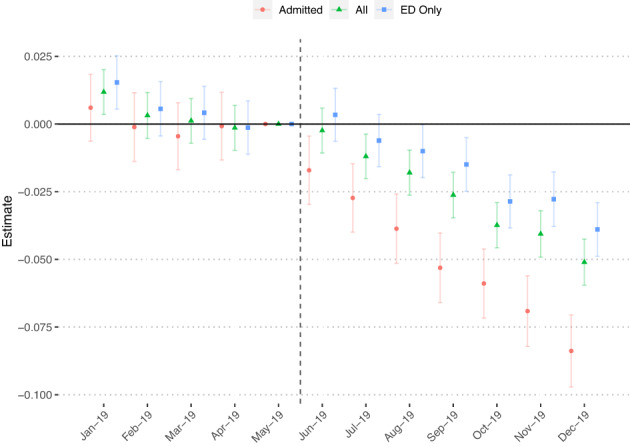
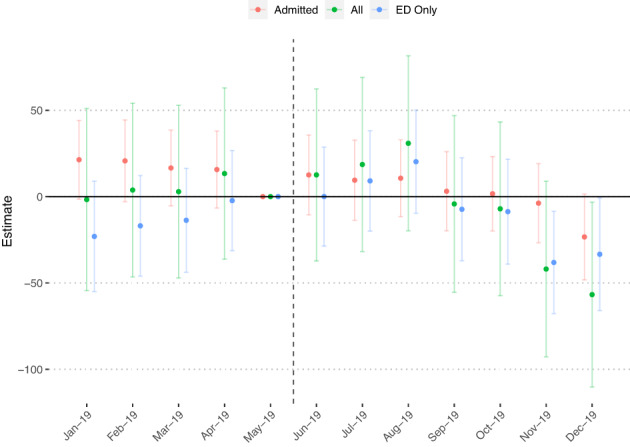
Principal findings: Of the 5,577,199 ED visits in the sample, 4.9% (n = 253,799) were made by VA enrollees. Of these, 44.9% of visits were paid by Medicare, 32.8% occurred in VA facilities, and 7% were paid by private health insurance. There was a 6.4% (2.91 percentage points; std. error = 0.18; p < 0.01) decrease in the proportion of ED visits paid by Medicare among VA enrollees relative to the general population after the implementation of the MISSION Act in June 2019. This decrease was larger for ED visits with a subsequent inpatient admission (-8.4%; 4.87 percentage points; std. error = 0.33; p < 0.01). There was no statistically significant change in the total volume of ED visits (0.06%; std. error = 0.08; p = 0.45).
Conclusions: Leveraging a novel dataset, we demonstrate that MISSION Act implementation coincided with a shift in the financing of non-VA ED visits from Medicare to VA without any increase in overall ED utilization. These findings have important implications for VA health care financing and delivery.
Keywords: emergency care; insurance; medicare; veterans health; veterans health services.
Published 2023. This article is a U.S. Government work and is in the public domain in the USA.
Figures
Similar articles
-
Who pays when VA users are hospitalized in the private sector? Evidence from three data sources.Med Care. 2007 Oct;45(10):1003-7. doi: 10.1097/MLR.0b013e318070c6e2. Med Care. 2007. PMID: 17890999
-
The impact of private insurance coverage on veterans' use of VA care: insurance and selection effects.Health Serv Res. 2008 Feb;43(1 Pt 1):267-86. doi: 10.1111/j.1475-6773.2007.00743.x. Health Serv Res. 2008. PMID: 18211529 Free PMC article.
-
The Impact of a Change in the Price of VA Health Care on Utilization of VA and Medicare Services.Med Care. 2018 Jul;56(7):569-576. doi: 10.1097/MLR.0000000000000922. Med Care. 2018. PMID: 29768309
-
Comparing Quality of Surgical Care Between the US Department of Veterans Affairs and Non-Veterans Affairs Settings: A Systematic Review.J Am Coll Surg. 2023 Aug 1;237(2):352-361. doi: 10.1097/XCS.0000000000000720. Epub 2023 May 8. J Am Coll Surg. 2023. PMID: 37154441 Free PMC article.
-
Serving Vietnam Veterans Hospitalized Outside the VA System: A Scoping Review of Presumptive Service-Related Illnesses and Presentations.J Gen Intern Med. 2025 May 15. doi: 10.1007/s11606-025-09601-8. Online ahead of print. J Gen Intern Med. 2025. PMID: 40375044
Cited by
-
Community Emergency Care Use by Veterans in an Era of Expanding Choice.JAMA Netw Open. 2024 Mar 4;7(3):e241626. doi: 10.1001/jamanetworkopen.2024.1626. JAMA Netw Open. 2024. PMID: 38457180 Free PMC article.
-
Health Insurance Enrollment Among US Veterans, 2010-2021.JAMA Netw Open. 2024 Aug 1;7(8):e2430205. doi: 10.1001/jamanetworkopen.2024.30205. JAMA Netw Open. 2024. PMID: 39186266 Free PMC article.
-
Estimating the Risk of Cardiovascular Events in U.S. Veterans Using the SMART Risk Score.JACC Adv. 2024 Dec 12;4(1):101459. doi: 10.1016/j.jacadv.2024.101459. eCollection 2025 Jan. JACC Adv. 2024. PMID: 39759440 Free PMC article.
-
Trends in Veteran hospitalizations and associated readmissions and emergency department visits during the MISSION Act era.Health Serv Res. 2024 Oct;59(5):e14332. doi: 10.1111/1475-6773.14332. Epub 2024 Jun 2. Health Serv Res. 2024. PMID: 38825849
-
Cost Shifting for Emergency Care of Veterans With Medicare After MISSION Act Implementation.JAMA Health Forum. 2024 Dec 6;5(12):e244312. doi: 10.1001/jamahealthforum.2024.4312. JAMA Health Forum. 2024. PMID: 39729304 Free PMC article.
References
-
- Department of Veterans Affairs . Community care network (CCN) . 2022. Accessed July 2, 2022. https://www.va.gov/COMMUNITYCARE/docs/pubfiles/factsheets/FactSheet_26-0...
-
- Congressional Budget Office . The Veterans Community Care Program: background and early effects . Accessed February 2, 2022. https://www.cbo.gov/publication/57583
-
- Department of Veterans Affairs . FY 2023 budget submission—budget in brief . 2022. https://www.va.gov/budget/docs/summary/fy2023-va-budget-in-brief.pdf
Publication types
MeSH terms
Grants and funding
LinkOut - more resources
Full Text Sources
Research Materials
