. 2023 Apr 19:381:e073406.
doi: 10.1136/bmj-2022-073406.

Beverage consumption and mortality among adults with type 2 diabetes: prospective cohort study

Affiliations

Beverage consumption and mortality among adults with type 2 diabetes: prospective cohort study

Le Ma et al. BMJ. .

Abstract

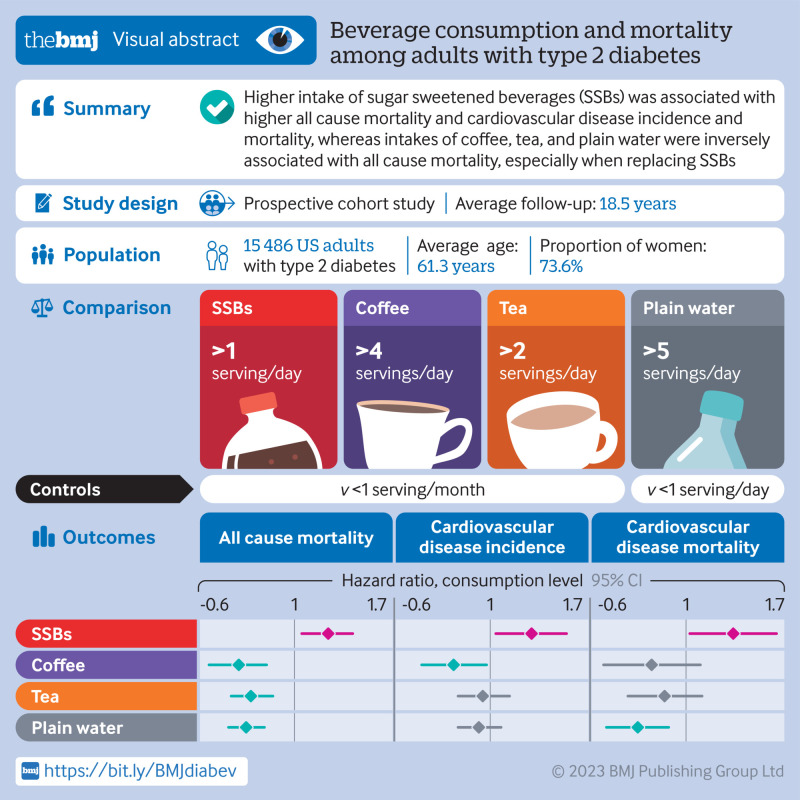
Objective: To investigate the intake of specific types of beverages in relation to mortality and cardiovascular disease (CVD) outcomes among adults with type 2 diabetes.

Design: Prospective cohort study.

Setting: Health professionals in the United States.

Participants: 15 486 men and women with a diagnosis of type 2 diabetes at baseline and during follow-up (Nurses' Health Study: 1980-2018; and Health Professionals Follow-Up Study: 1986-2018). Beverage consumption was assessed using a validated food frequency questionnaire and updated every two to four years.

Main outcome measures: The main outcome was all cause mortality. Secondary outcomes were CVD incidence and mortality.

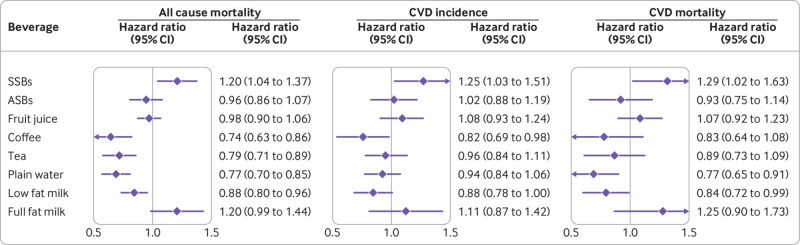
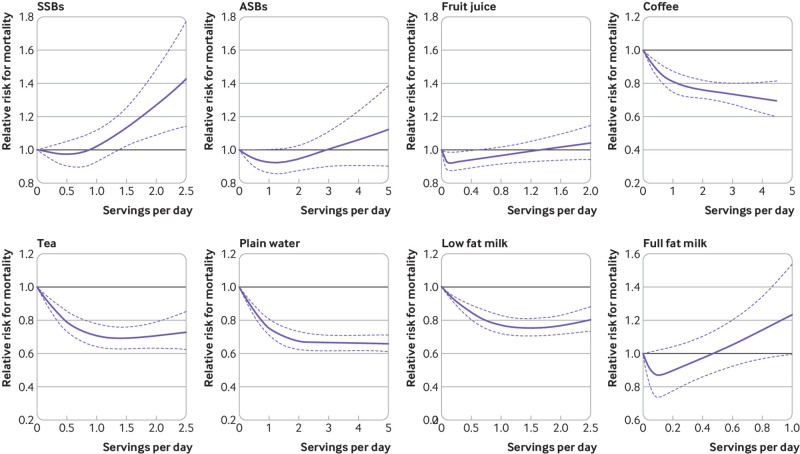
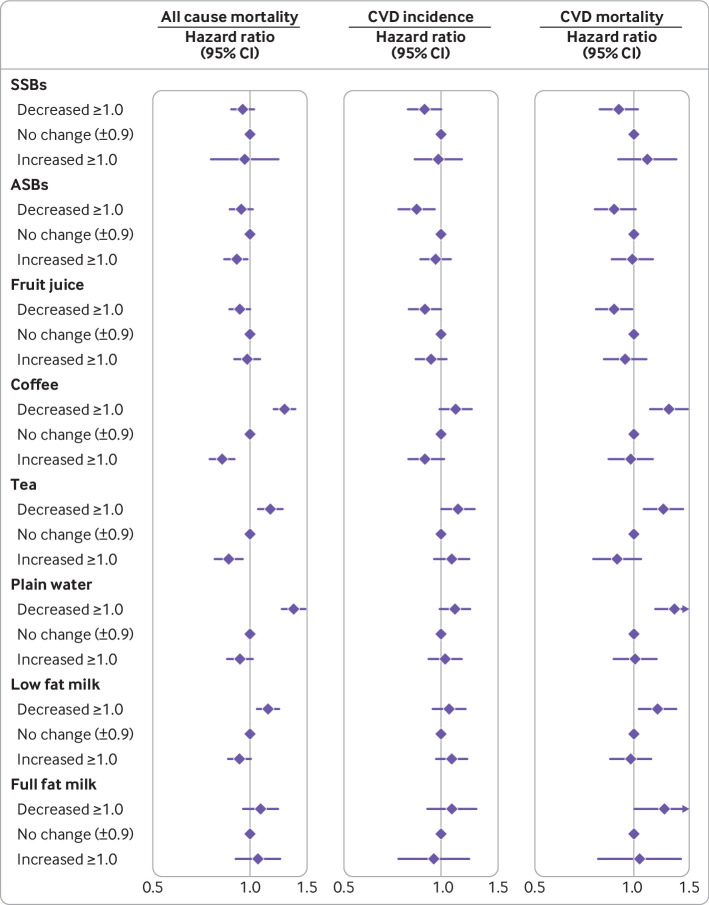
Results: During an average of 18.5 years of follow-up, 3447 (22.3%) participants with incident CVD and 7638 (49.3%) deaths were documented. After multivariable adjustment, when comparing the categories of lowest intake of beverages with the highest intake, the pooled hazard ratios for all cause mortality were 1.20 (95% confidence interval 1.04 to 1.37) for sugar sweetened beverages (SSBs), 0.96 (0.86 to 1.07) for artificially sweetened beverages (ASBs), 0.98 (0.90 to 1.06) for fruit juice, 0.74 (0.63 to 0.86) for coffee, 0.79 (0.71 to 0.89) for tea, 0.77 (0.70 to 0.85) for plain water, 0.88 (0.80 to 0.96) for low fat milk, and 1.20 (0.99 to 1.44) for full fat milk. Similar associations were observed between the individual beverages and CVD incidence and mortality. In particular, SSB intake was associated with a higher risk of incident CVD (hazard ratio 1.25, 95% confidence interval 1.03 to 1.51) and CVD mortality (1.29, 1.02 to 1.63), whereas significant inverse associations were observed between intake of coffee and low fat milk and CVD incidence. Additionally, compared with those who did not change their consumption of coffee in the period after a diabetes diagnosis, a lower all cause mortality was observed in those who increased their consumption of coffee. A similar pattern of association with all cause mortality was also observed for tea, and low fat milk. Replacing SSBs with ABSs was significantly associated with lower all cause mortality and CVD mortality, and replacing SSBs, ASBs, fruit juice, or full fat milk with coffee, tea, or plain water was consistently associated with lower all cause mortality.

Conclusions: Individual beverages showed divergent associations with all cause mortality and CVD outcomes among adults with type 2 diabetes. Higher intake of SSBs was associated with higher all cause mortality and CVD incidence and mortality, whereas intakes of coffee, tea, plain water, and low fat milk were inversely associated with all cause mortality. These findings emphasize the potential role of healthy choices of beverages in managing the risk of CVD and premature death overall in adults with type 2 diabetes.


Conflict of interest statement

Competing interests: All authors have completed the ICMJE uniform disclosure form at www.icmje.org/disclosure-of-interest/ and declare: support from the National Institutes of Health (NIH) for the submitted work; JEM has been supported by grants from NIH. FBH has been supported by grants HL60712, HL118264, and DK112940 from NIH and received research support from the California Walnut Commission, honorariums for lectures from Metagenics and Standard Process, and honorariums from Diet Quality Photo Navigation, outside the submitted work; VM has received research support from Canada Research Chairs Program, Connaught New Researcher Award, University of Toronto, and The Joannah and Brian Lawson Centre for Child Nutrition, University of Toronto, received consulting fees from the World Health Organization Nutrition Guidance Expert Advisory Group, and has held a leadership role in Canadian Institutes of Health Research Advisory Board, Institute of Nutrition, Metabolism and Diabetes. No other relationships or activities that could appear to have influenced the submitted work.

Figures

Fig 1
Fig 1
Hazard ratios (95% CIs) of all cause mortality, CVD incidence, and CVD mortality according to consumption of specific types of beverages among adults with type 2 diabetes. Hazard ratios for CVD incidence comparing extreme categories of consumption of specific types of beverages (SSB: <1 serving/month v >1 serving/day; ASB: <1 serving/month v >2 servings/day; fruit juice: <1 serving/month v >1 serving/day; coffee: <1 serving/month v >4 servings/day; tea: <1 serving/month v >2 servings/day; plain water: <1 serving/day v >5 servings/day; low fat milk: <1 serving/month v >2 servings/day; full fat milk: <1 serving/month v >1 serving/day) among individuals with type 2 diabetes were adjusted for age (continuous), duration of diabetes mellitus (years), sex (men or women), white ethnicity (yes or no), physical activity (<3.0, 3.0-8.9, 9.0-17.9, 18.0-26.9, ≥27.0 metabolic equivalents of task-hours/week), smoking status (never, former, current 1-14 cigarettes/day, current ≥15 cigarettes/day), alcohol consumption (0, 0.1-4.9, 5.0-14.9, ≥15.0 g/day), menopausal status and post-menopausal hormone use (pre-menopause, post-menopause (never, former, or current hormone use), or missing; Nurses’ Health Study only), family history of type 2 diabetes (yes or no) or myocardial infarction (yes or no), intake of total energy (continuous), the modified Alternative Healthy Eating Index score (fourths), history of hypertension (yes or no) or hypercholesterolemia (yes or no), use of antihypertensive (yes or no) or lipid lowering drug (yes or no), aspirin use (yes or no), diabetes drug use (oral drug only, insulin use, or others), and change in body mass index before to after diabetes diagnosis. Individual beverage consumption was mutually adjusted. ASB=artificially sweetened beverage; CI=confidence interval; CVD=cardiovascular disease; SSB=sugar-sweetened beverage
Fig 2
Fig 2
Restricted cubic spline analysis of association between individual beverage consumption and all cause mortality among adults with type 2 diabetes. Adjusted for age (continuous), duration of diabetes (years), sex (men or women), white ethnicity (yes or no), physical activity (<3.0, 3.0-8.9, 9.0-17.9, 18.0-26.9, ≥27.0 metabolic equivalents of task-hours/week), smoking status (never, former, current 1-14 cigarettes/day, current ≥15 cigarettes/day), alcohol consumption (0, 0.1-4.9, 5.0-14.9, ≥15.0 g/day), menopausal status and post-menopausal hormone use (pre-menopause, post-menopause (never, former, or current hormone use), or missing; Nurses’ Health Study only), family history of type 2 diabetes (yes or no) or myocardial infarction (yes or no), intake of total energy (continuous), the modified Alternative Healthy Eating Index score (fourths), history of hypertension (yes or no) or hypercholesterolemia (yes or no), use of antihypertensive (yes or no) or lipid lowering drug (yes or no), aspirin use (yes or no), diabetes drug use (oral drug only, insulin use, or others), and change in body mass index before to after diabetes diagnosis. Individual beverage consumption was mutually adjusted. ASB=artificially sweetened beverage; CI=confidence interval; CVD=cardiovascular disease; HR=hazard ratio; SSB=sugar sweetened beverage
Fig 3
Fig 3
Hazard ratios (95% CIs) of all cause mortality and CVD incidence according to changes in consumption of specific types of beverages from before to after a diagnosis of type 2 diabetes. Hazard ratios were adjusted for age (continuous), duration of diabetes (years), sex (men or women), white (yes or no), physical activity (<3.0, 3.0-8.9, 9.0-17.9, 18.0-26.9, ≥27.0 metabolic equivalents of task-hours/week), smoking status (never, former, current 1-14 cigarettes/day, current ≥15 cigarettes/day), alcohol consumption (0, 0.1-4.9, 5.0-14.9, ≥15.0 g/day), menopausal status and post-menopausal hormone use (pre-menopause, post-menopause (never, former, or current hormone use), or missing; Nurses’ Health Study only), family history of type 2 diabetes (yes or no) or myocardial infarction (yes or no), intake of total energy (continuous), the modified Alternative Healthy Eating Index score (fourths), history of hypertension (yes or no) or hypercholesterolemia (yes or no), use of antihypertensive (yes or no) or lipid lowering drug (yes or no), aspirin use (yes or no), diabetes drug use (oral drug only, insulin use, or others), and change in body mass index before to after diabetes diagnosis. Individual beverage consumption was mutually adjusted. ASBs=artificially sweetened beverages; CI=confidence interval; CVD=cardiovascular disease; HR=hazard ratio; SSBs=sugar sweetened beverages
None

Comment in

Similar articles

Cited by

References

    1. International Diabetes Federation. IDF Diabetes Atlas 9th Edition. https://www.diabetesatlas.org/en/. Accessed Feb 10 2022.
    1. Rawshani A, Rawshani A, Franzén S, et al. . Mortality and Cardiovascular Disease in Type 1 and Type 2 Diabetes. N Engl J Med 2017;376:1407-18. 10.1056/NEJMoa1608664. - DOI - PubMed
    1. Ley SH, Hamdy O, Mohan V, Hu FB. Prevention and management of type 2 diabetes: dietary components and nutritional strategies. Lancet 2014;383:1999-2007. 10.1016/S0140-6736(14)60613-9. - DOI - PMC - PubMed
    1. Lichtenstein AH, Appel LJ, Vadiveloo M, et al. . 2021 Dietary Guidance to Improve Cardiovascular Health: A Scientific Statement From the American Heart Association. Circulation 2021;144:e472-87. 10.1161/CIR.0000000000001031. - DOI - PubMed
    1. Pallazola VA, Davis DM, Whelton SP, et al. . A Clinician’s Guide to Healthy Eating for Cardiovascular Disease Prevention. Mayo Clin Proc Innov Qual Outcomes 2019;3:251-67. 10.1016/j.mayocpiqo.2019.05.001. - DOI - PMC - PubMed