. 2023 Jul 10;131(6):967-983.
doi: 10.1093/aob/mcad054.

Endosidin 5 disruption of the Golgi apparatus and extracellular matrix secretion in the unicellular charophyte Penium margaritaceum

Affiliations

Endosidin 5 disruption of the Golgi apparatus and extracellular matrix secretion in the unicellular charophyte Penium margaritaceum

Josephine G LoRicco et al. Ann Bot. .

Abstract

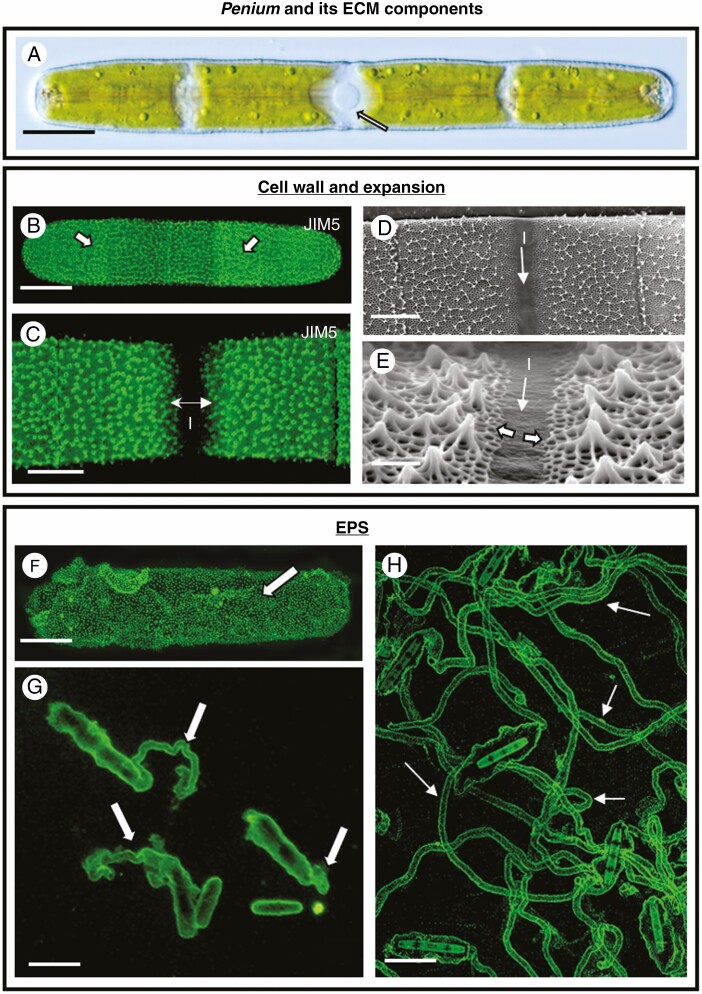
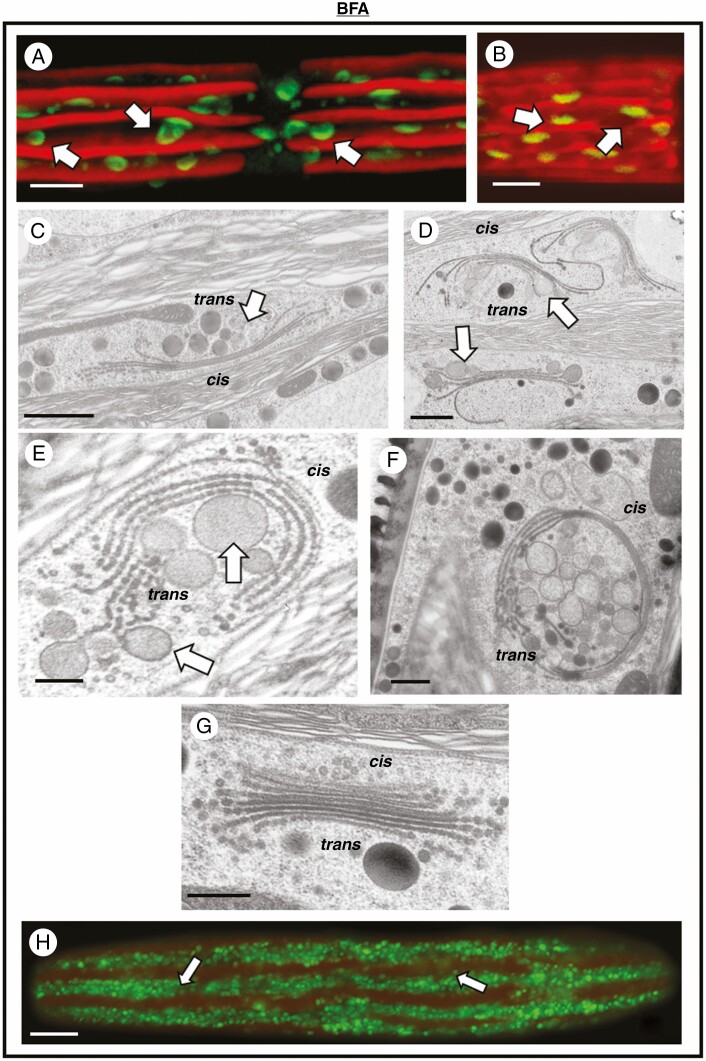
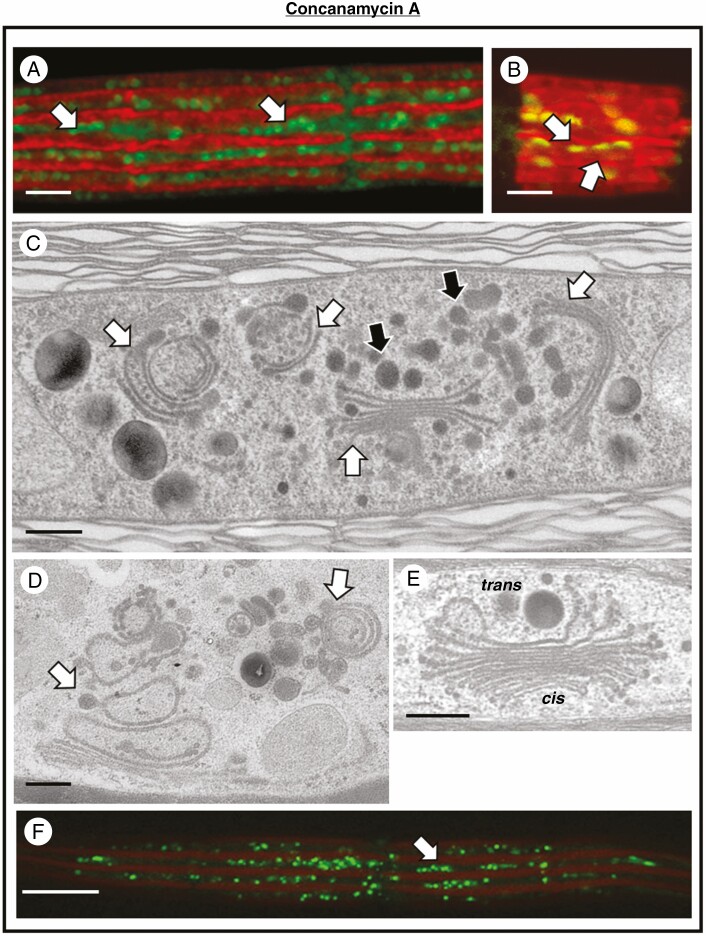
Background and aims: Endosidins are a group of low-molecular-weight compounds, first identified by 'chemical biology' screening assays, that have been used to target specific components of the endomembrane system. In this study, we employed multiple microscopy-based screening techniques to elucidate the effects of endosidin 5 (ES5) on the Golgi apparatus and the secretion of extracellular matrix (ECM) components in Penium margaritaceum. These effects were compared with those caused by treatments with brefeldin A and concanamycin A. Penium margaritaceum's extensive Golgi apparatus and endomembrane system make it an outstanding model organism for screening changes to the endomembrane system. Here we detail changes to the Golgi apparatus and secretion of ECM material caused by ES5.

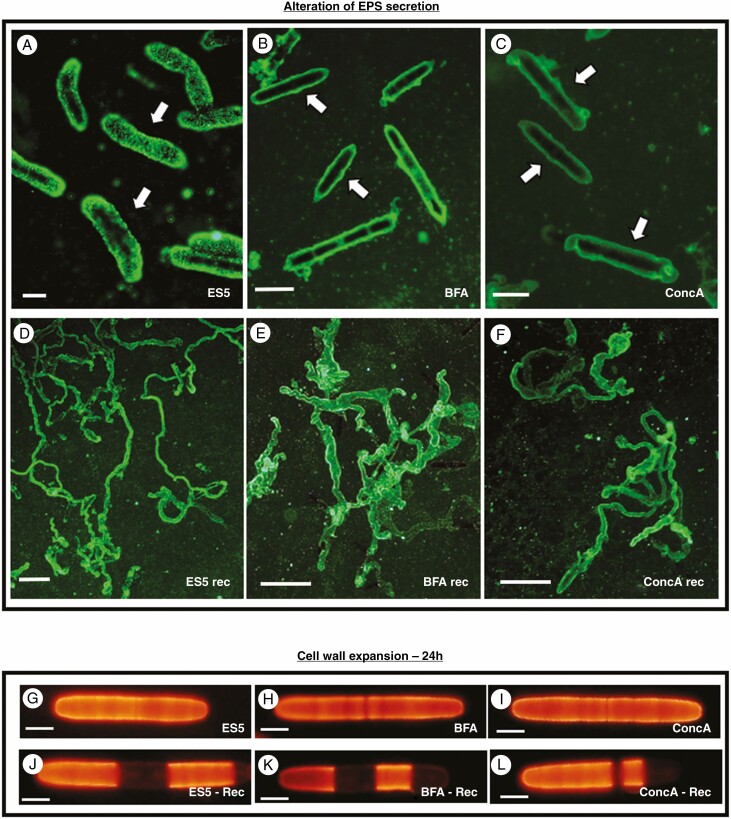
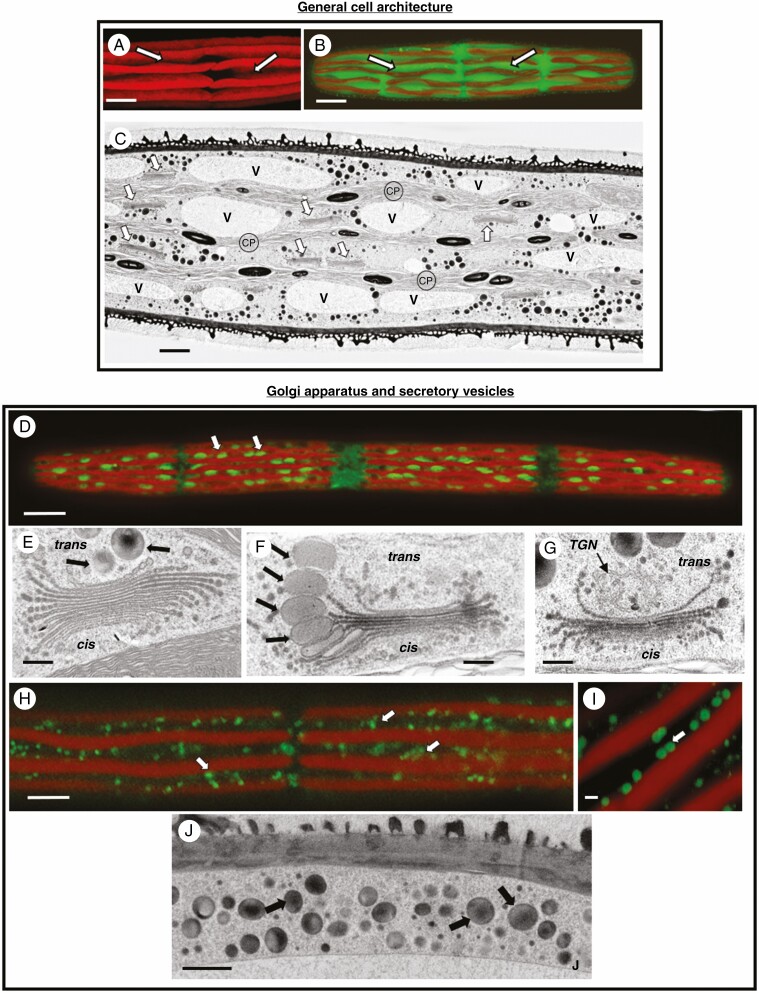
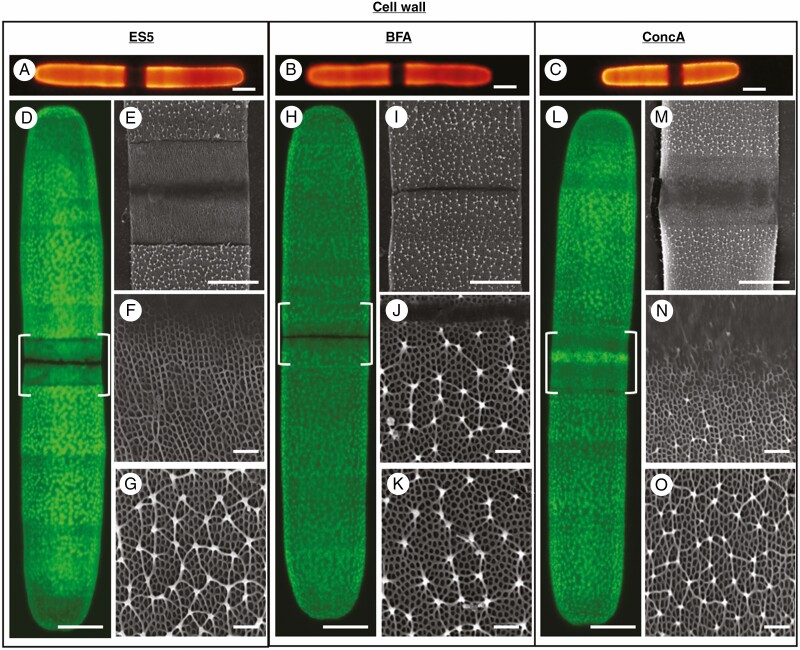
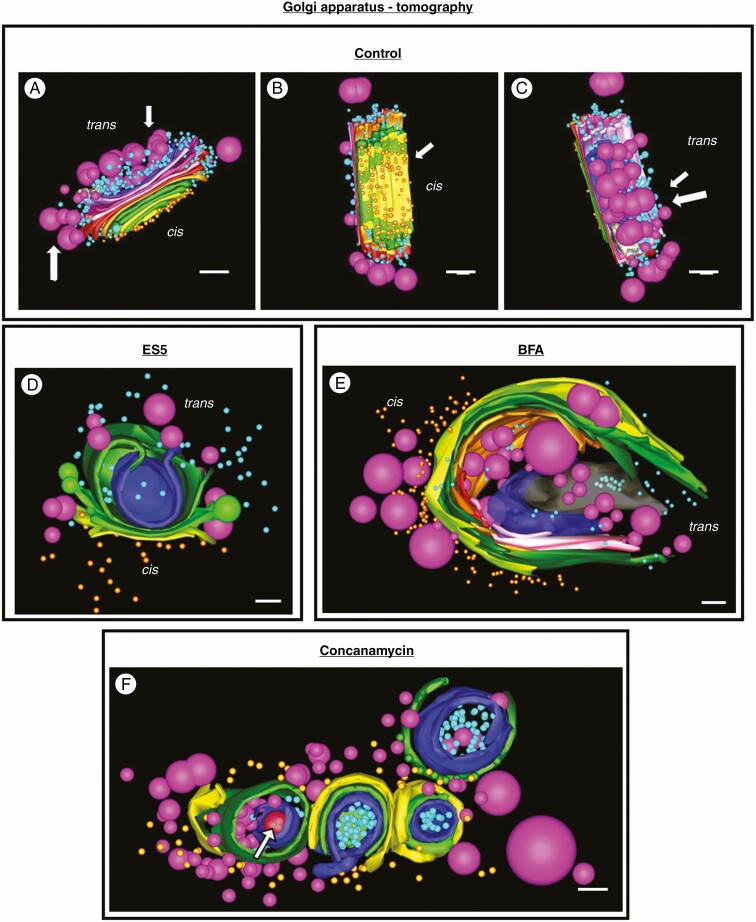
Methods: Changes to extracellular polymeric substance (EPS) secretion and cell wall expansion were screened using fluorescence microscopy. Confocal laser scanning microscopy and transmission electron microscopy were used to assess changes to the Golgi apparatus, the cell wall and the vesicular network. Electron tomography was also performed to detail the changes to the Golgi apparatus.

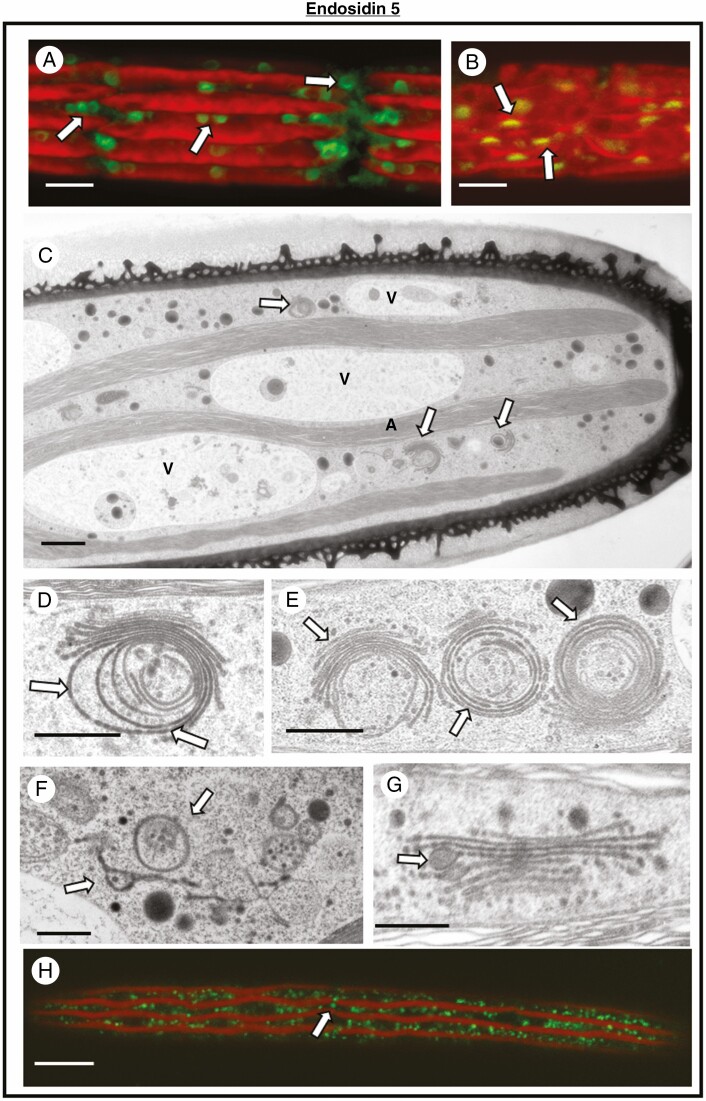
Key results: While other endosidins were able to impact EPS secretion and cell wall expansion, only ES5 completely inhibited EPS secretion and cell wall expansion over 24 h. Short treatments of ES5 resulted in displacement of the Golgi bodies from their typical linear alignment. The number of cisternae decreased per Golgi stack and trans face cisternae in-curled to form distinct elongate circular profiles. Longer treatment resulted in a transformation of the Golgi body to an irregular aggregate of cisternae. These alterations could be reversed by removal of ES5 and returning cells to culture.

Conclusions: ES5 alters secretion of ECM material in Penium by affecting the Golgi apparatus and does so in a markedly different way from other endomembrane inhibitors such as brefeldin A and concanamycin A.

Keywords: Charophytes; Golgi apparatus; brefeldin A; concanamycin A; endomembrane system; endosidin; secretion; tomography.


Figures

Fig. 1.
Fig. 1.
ECM production. (A) Differential interference contrast (DIC) image of Penium. The cell centre or isthmus (arrow) contains the nucleus and is the site of cell wall and cell expansion. Bar, 15 µm. (B) CLSM imaging of JIM5-TRITC labelling of the HG lattice (arrows) of the outer layer of the cell wall. Bar, 18 µm. (C) During cell wall expansion new HG is secreted at the isthmus (I) and displaces the older JIM5-labelled cell wall outward toward the poles (double arrow). CLSM image. Bar, 8 µm. (D, E) Scanning electron microscopy (SEM) micrographs of the cell wall near the isthmus (I). (F) Fluorescent bead labelling of the EPS surrounding a washed cell that was cultured for 2 h. The EPS forms a sheath around the cell (arrow). Bar, 13 µm. (G) Fluorescent bead labelling of the EPS now being secreted in narrow trails (arrows) in cells cultured for 4 h. Bar, 17 µm. (H) Fluorescent bead labelling of the distinct gliding trails (arrows) secreted in cells cultured overnight. Bar, 35 µm.
Fig. 2.
Fig. 2.
Treatment effects on EPS production. (A) EPS secretion in cells treated with ES5 overnight. EPS ensheaths each cell (arrows) but no gliding trails are formed. Bar, 17 µm. (B, C) EPS secretion in cells treated with BFA (B) or concanamycin (C) overnight. EPS ensheaths each cell (arrows) but no gliding trails are formed. Bars, 35 µm. (D–F) Recovery of EPS trails following removal of ES5 (D), BFA (E) or concanamycin A (F). Bars, 250 µm. Cell wall expansion of JIM5-TRITC labelled cells after 24 h of growth. (A, C, E) Inhibition of cell wall expansion after 24 h of treatment with ES5 (A), BFA (C) or ConcA (D). (B, D, F) Recovery of cell wall expansion after removal of inhibitory compound for 24 h. ES5 recovery (B), BFA recovery (D) and concanamycin recovery (F). Bars, 25 µm.
Fig. 3.
Fig. 3.
Subcellular architecture and the Golgi apparatus. (A) CLSM image of the multi-lobed chloroplast and the valleys of cytoplasm (arrows) found between each lobe. Bar, 8 µm. (B) CLSM image of a CFDA-labelled cell highlighting the cytoplasmic valleys (arrows, green) found between the lobes of the chloroplast (red). Bar, 8 µm. (C) TEM image of a longitudinal section of the cell. Linear arrays of Golgi bodies (arrows) are interspersed with the vacuolar network (V) that is positioned in lobes of cytoplasm defined by the lobes of the chloroplast (CP). Bar, 1.5 µm. (D) MDY-64 labelling of the Golgi bodies (arrows) positioned in linear arrays (arrows). CLSM images. Bar, 17 µm. (E) TEM image of a typical Golgi body. Each Golgi body consists of a stack of 12–15 cisternae. A cis region (cis) faces the chloroplast (CP) and the trans face (trans) is where vesicles emerge (arrows). Bar, 400 nm. (F) TEM image of the formation of EPS vesicles (arrows) on the Golgi body. Swellings appear at the periphery of medial to trans cisternae (arrows). These will bleb off the cisternae and become EPS-carrying vesicles. The cis (cis) and trans (trans) faces are also noted. Bar, 400 nm. (G) Trans Golgi network (TGN) found at the trans face (trans) of the Golgi body. The cis (cis) and trans (trans) faces are also noted. Bar. 450 nm. (H) CLSM image of an untreated Lysotracker-labelled cell. The fluorescent entities (arrows) are located in the peripheral cytoplasmic network. Bar, 9 µm. (I) Magnified view of Lysotracker-labelled cell. The fluorescent entities range in size from 300 to 500 nm and are probably EPS-carrying vesicles. Bar, 750 nm. (J) TEM view of the peripheral cytoplasm showing the secretory vesicles (arrows) that move in this region via cytoplasmic streaming. Bar, 1 µm.
Fig. 4.
Fig. 4.
Effects of ES5 upon the Golgi apparatus. (A) MDY-64 labelling of a cell treated with ES5 overnight. The Golgi bodies (arrows) are unevenly dispersed in the cytoplasm and take on a circular profile. Bar, 5 µm. (B) MDY-64 labelling of a cell that has recovered from ES5 treatment for 24 h. The Golgi bodies (arrows) have begun to return to their original shape and cellular distribution. (C) TEM image of a cell treated with ES5 for 4 h. Note the irregular Golgi bodies (arrows) in the cytoplasmic valleys. Large vacuoles are also present. Bar, 2 µm. (D) Magnified TEM image of a Golgi body from a cell treated with ES5 for 4 h. Note the absence of vesicles and the incurling of the trans face cisternae (arrow). Bar, 500 nm. (E) Magnified image of a cluster of Golgi bodies (arrows). Bar, 500 nm. (F) TEM image of ES5-treated Golgi bodies after 24 h. Note that the Golgi are reduced to irregular (arrows). Bar, 500 nm. (G) Golgi body from a cell that has recoveed for 24 h after application of ES5. Note the Golgi stacking has appeared. Bar, 500 nm. (H) CLSM image of an ES5-treated Lysotracker-labelled cell. The number of vesicles is approximately the same as those found in untreated cells. Bar, 15 µm.
Fig. 5.
Fig. 5.
Effects of BFA on the Golgi apparatus. (A) MDY-64 labelling of a cell treated with BFA overnight. The Golgi bodies become more dispersed in the cytoplasm (arrows) and begin to change into circular entities. Bar, 5 µm. (B) MDY-64 labelling of a cell that has recovered from BFA treatment for 24 h. The Golgi bodies (arrows) have begun to return to their original shape and cellular distribution. Bar, 5 µm. (C) TEM image of Golgi body (arrow) from a cell treated for 2 h with BFA. The number cisternae per stack decreases and cisternae elongate considerably. Secretory vesicles are apparent at the trans face (trans). Bar, 500 nm. (D) Magnified view of Golgi bodies (arrows) treated with BFA for 4 h. The cisternae elongate and incurl at the trans face (trans). Bar, 500 nm. (E, F) TEM images of a Golgi body treated with BFA for 24 h. The Golgi body consists of a small stack of curled cisternae and secretory vesicles (arrows) at the trans face (trans). Bars, 250 and 500 nm respectively. (G) Reappearance of the Golgi body stack in a cell allowed to recover for 24 h. The cis (cis) and trans (trans) faces are apparent. Bar, 400 nm. (H) CLSM image of a BFA-treated, Lysotracker-labelled cell. Note a substantial increase in vesicles (arrows) in the peripheral cytoplasm. Bar, 5 µm.
Fig. 6.
Fig. 6.
Effects of ConcA on the Golgi apparatus. (A) MDY-64 labelling of a cell treated with ConcA overnight. A large number of small, round Golgi bodies are found in the cytoplasm (arrows) and are often found in closely packed linear arrays. Bar, 5 µm. (B) MDY-64 labelling of a cell that has recovered from ConcA treatment for 24 h. The Golgi bodies (arrows) have begun to return to their original shape and cellular distribution. Bar, 5 µm. (C) TEM image of Golgi bodies from a cell treated with concanamycin for 4 h. The number of cisternae per Golgi stack decreases (white arrows) and Golgi bodies aggregate in the cytoplasm. Secretory vesicles are still produced (black arrows). Bar, 500 nm. (D) Altered Golgi bodies in a cell treated with concanamycin for 24 h. Each Golgi body (arrows) is reduced to a few cisternae. MVBs are formed (black arrows). Bar, 400 nm. (E) The typical cisternal stack returns after recovery for 24 h from concanamycin. The cis and trans faces are also apparent. Bar, 400 nm. (F) Lysotracker labelling of a cell treated with concanamycin for 24 h. The number of vesicles is approximately the same as those found in untreated cells. Bar, 15 µm.
Fig. 7.
Fig. 7.
Changes to cell wall pectin structure following 48 h of treatment. (A–C) Slight expansion in cell wall seen in JIM5-FITC-labelled cells after 48 h of treatment with ES5 (A), BFA (B) and ConcA (C). Bars, 20 µm. (D) Labelling of cell wall with anti-pectin antibody, JIM5, following 48 h of treatment with ES5. Alteration of pectin lattice of newly synthesized cell wall near the isthmus zone is indicated with brackets. Bar, 10 µm. (E–G) Scanning electron micrographs of cell wall pectin of ES5-treated cells. (E) SEM micrograph of isthmus and surrounding cell wall. Bar, 5 µm. (F) Cell wall material immediately adjacent to the isthmus. Bar, 1 µm. (G) Cell wall material far from the isthmus. Bar, 1 µm. (H) Labelling of cell wall with anti-pectin antibody, JIM5, following 48 h of treatment with BFA. Pectin lattice near the isthmus zone is indicated with brackets. Bar, 10 µm. (I–K) Scanning electron micrographs of cell wall pectin of BFA-treated cells. (I) SEM micrograph of isthmus and surrounding cell wall. Bar, 5 µm. (J) Cell wall material immediately adjacent to the isthmus. Bar, 1 µm. (K) Cell wall material far from the isthmus. Bar, 1 µm. (L) Labelling of cell wall with anti-pectin antibody, JIM5, following 48 h of treatment with ConcA. Alteration of pectin lattice of newly synthesized cell wall near the isthmus zone is indicated with brackets. Bar, 10 µm. (M–O) Scanning electron micrographs of cell wall pectin of ConcA-treated cells. (M) SEM micrograph of isthmus and surrounding cell wall. Bar, 5 µm. (N) Cell wall material immediately adjacent to the isthmus. Bar, 1 µm. (O) Cell wall material far from the isthmus. Bar, 1 µm.
Fig. 8.
Fig. 8.
Electron tomography of the Golgi body in treated and untreated cells. (A–C) 3D model of control Golgi. The stacks of cisternae are relatively flat, and the cis and trans faces are readily identifiable. The Golgi body is surrounded by small vesicles at both the cis (orange) and trans (cyan) faces. Large secretory vesicles (magenta) can be found only at the trans face. Bars, 250 nm. (D) 3D model of Golgi body after ES5 treatment. The number of cisternae is reduced compared to the control. Cisternae at the cis face remain relatively flat, whereas cisternae at the trans face curve inward and form cup-like structures. The Golgi body is surrounded by small vesicles at both the cis (orange) and trans (cyan) faces. Large secretory vesicles (magenta) are found at the trans face. Bar, 200 nm. (E) 3D model of Golgi body after BFA treatment. The number of cisternae is reduced compared to the control, and cisternae become elongated. The cisternae are relatively straight at the edges but curve tightly near their midpoint, towards the trans face, forming a ‘U’ like structure. The Golgi body is surrounded by small vesicles at both the cis (orange) and trans (cyan) faces. Large secretory vesicles (magenta) can be found at both the cis and trans faces, as well as caught between cisternae. Bar, 200 nm. (F) 3D model of Golgi bodies after concanamycin treatment. Several Golgi bodies can be found in close proximity. The number and size of cisternae is reduced, and the cisternae are curved, often forming cup- or tube-like structures. The Golgi body is surrounded by small vesicles at the outer (cis) face (orange) and filled with small vesicles (cyan) within the inner (trans) face. In some cases, multi-vesicular bodies (arrow) are formed. Many secretory vesicles (magenta) can be seen surrounding the Golgi bodies. Bar, 200 nm.

Similar articles

Cited by

References

    1. Aniento F, De Medina S, Hernandez V, Dagdas Y, Rojas-Pierce M, Russinova E.. 2022. Molecular mechanisms of endomembrane trafficking in plants. Plant Cell 34: 146–173. doi:10.1093/plcell/koab235. - DOI - PMC - PubMed
    1. Arya GC, Sarkar S, Manasherova E, Aharoni A, Cohen H.. 2021. The plant cuticle: an ancient guardian barrier set against long-standing rivals. Frontiers in Plant Science 12: 663165. doi:10.3389/fpls.2021.663165. - DOI - PMC - PubMed
    1. Bacete L, Mélida H, Miedes E, Molina A.. 2018. Plant cell wall-mediated immunity: cell wall changes trigger disease resistance responses. The Plant Journal 93: 614–636. doi:10.1111/tpj.13807. - DOI - PubMed
    1. Boney AD. 1981. Mucilage: A ubiquitous algal attribute. British Phycological Journal 16: 115–132. doi:10.1080/00071618100650101. - DOI
    1. Brüx A, Liu T-Y, Krebs M, et al. . 2008. Reduced V-ATPase activity in the trans-Golgi network causes oxylipid-dependent hypocotyl growth inhibition in Arabidopsis. The Plant Cell 20: 1088–1100. doi:10.1105/tpc.108.058362. - DOI - PMC - PubMed

Publication types