Transient elastography with controlled attenuation parameter versus two-dimensional shear wave elastography with attenuation imaging for the evaluation of hepatic steatosis and fibrosis in NAFLD
- PMID: 37076274
- PMCID: PMC10331060
- DOI: 10.14366/usg.22212
Transient elastography with controlled attenuation parameter versus two-dimensional shear wave elastography with attenuation imaging for the evaluation of hepatic steatosis and fibrosis in NAFLD
Abstract
Purpose: This study compared the controlled attenuation parameter (CAP) to attenuation imaging (ATI) in the diagnosis of steatosis and transient elastography (TE) to two-dimensional shear wave elastography (2D-SWE) for the diagnosis of fibrosis in a prospectively constructed nonalcoholic fatty liver disease (NAFLD) patient cohort.
Methods: Participants who underwent TE with CAP were included from a previously constructed NAFLD cohort with multiparametric ultrasound data. The degree of hepatic steatosis and stage of liver fibrosis were assessed. Diagnostic performance was evaluated using the area under the receiver operating characteristic curve (AUROC) for the grades of steatosis (S1-3) and fibrosis (F0-F4).
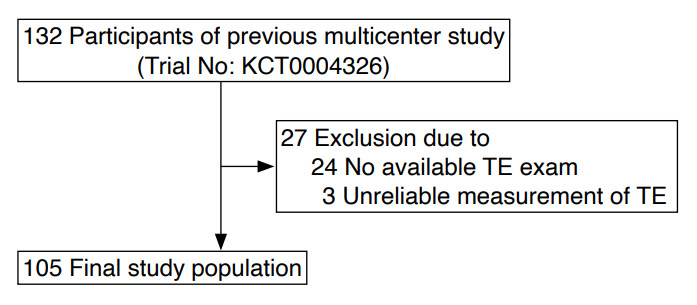
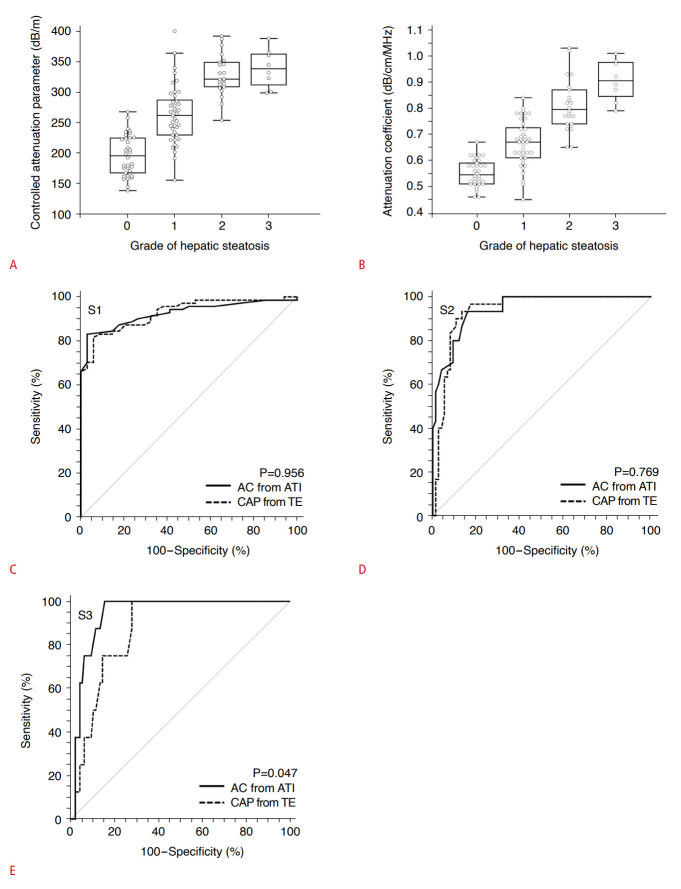
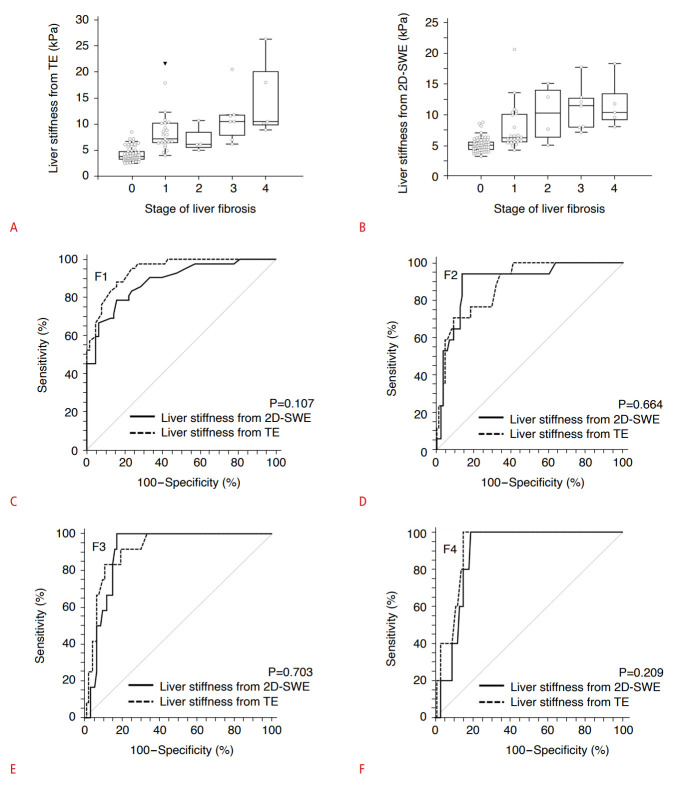
Results: There were 105 participants. The distribution of hepatic steatosis grades (S0-S3) and liver fibrosis stages (F0-F4) was as follows: S0, n=34; S1, n=41; S2, n=22; S3, n=8; F0, n=63; F1, n=25; F2, n=5; F3, n=7; and F4, n=5. No significant difference was found between CAP and ATI in detecting ≥S1 (AUROC: 0.93 vs. 0.93, P=0.956) or ≥S2 (0.94 vs. 0.94, P=0.769). However, the AUROC of ATI in detecting ≥S3 was significantly higher than that of CAP (0.94 vs. 0.87, P=0.047). Regarding the detection of liver fibrosis, no significant difference was found between TE and 2D-SWE. The AUROCs of TE and 2D-SWE were as follows: ≥F1, 0.94 vs. 0.89 (P=0.107); ≥F2, 0.89 vs. 0.90 (P=0.644); ≥F3, 0.91 vs. 0.90 (P=0.703); and ≥F4, 0.88 vs. 0.92 (P=0.209).
Conclusion: 2D-SWE and TE showed comparable diagnostic performance in assessing liver fibrosis, and ATI provided significantly better performance in detecting ≥S3 steatosis than CAP.
Keywords: Elasticity imaging techniques; Fatty liver; Liver cirrhosis.
Conflict of interest statement
Dong Ho Lee serves as Editor for the Ultrasonography, but has no role in the decision to publish this article. All remaining authors have declared no conflicts of interest.
Figures
Similar articles
-
Diagnostic performance of two-dimensional shear wave elastography and attenuation imaging for fibrosis and steatosis assessment in chronic liver disease.J Med Ultrason (2001). 2025 Jan;52(1):95-103. doi: 10.1007/s10396-024-01473-5. Epub 2024 Jun 29. J Med Ultrason (2001). 2025. PMID: 38951430 Free PMC article.
-
The effect of the skin-liver capsule distance on the accuracy of ultrasound diagnosis for liver steatosis and fibrosis.J Med Ultrason (2001). 2022 Jul;49(3):443-450. doi: 10.1007/s10396-022-01210-w. Epub 2022 May 7. J Med Ultrason (2001). 2022. PMID: 35524897
-
Magnetic Resonance Elastography vs Transient Elastography in Detection of Fibrosis and Noninvasive Measurement of Steatosis in Patients With Biopsy-Proven Nonalcoholic Fatty Liver Disease.Gastroenterology. 2017 Feb;152(3):598-607.e2. doi: 10.1053/j.gastro.2016.10.026. Epub 2016 Oct 27. Gastroenterology. 2017. PMID: 27911262 Free PMC article.
-
A meta-analysis on the diagnostic performance of magnetic resonance imaging and transient elastography in nonalcoholic fatty liver disease.Eur J Clin Invest. 2021 Feb;51(2):e13446. doi: 10.1111/eci.13446. Epub 2020 Dec 9. Eur J Clin Invest. 2021. PMID: 33128454
-
Diagnostic accuracy of ultrasound-guided attenuation parameter as a noninvasive test for steatosis in non-alcoholic fatty liver disease.J Med Ultrason (2001). 2021 Oct;48(4):471-480. doi: 10.1007/s10396-021-01123-0. Epub 2021 Aug 20. J Med Ultrason (2001). 2021. PMID: 34415481 Review.
Cited by
-
Effects of hepatic fibrosis on the quantification of hepatic steatosis using the controlled attenuation parameter in patients with chronic hepatitis B.Ultrasonography. 2025 Jan;44(1):83-91. doi: 10.14366/usg.24138. Epub 2024 Sep 27. Ultrasonography. 2025. PMID: 39604096 Free PMC article.
-
Preliminary study on determining the optimal position of region of interest for evaluating hepatic steatosis using ultrasound Attenuation imaging.Abdom Radiol (NY). 2025 Sep;50(9):4380-4388. doi: 10.1007/s00261-025-04876-1. Epub 2025 Mar 17. Abdom Radiol (NY). 2025. PMID: 40095021
-
Oxidative stress and inflammation in hemodialysis: a comparison of patients with or without advanced nonalcoholic fatty liver disease (NAFLD).Ren Fail. 2025 Dec;47(1):2455523. doi: 10.1080/0886022X.2025.2455523. Epub 2025 Jan 22. Ren Fail. 2025. PMID: 39842820 Free PMC article.
-
Attenuation Based Quantitative Evaluation of Hepatic Steatosis Using US: Current Status and Future Perspective.J Korean Soc Radiol. 2025 May;86(3):321-334. doi: 10.3348/jksr.2025.0024. Epub 2025 May 26. J Korean Soc Radiol. 2025. PMID: 40502475 Free PMC article. Review.
-
Diagnostic accuracy of two-dimensional shear wave elastography and point shear wave elastography in identifying different stages of liver fibrosis in patients with metabolic dysfunction-associated steatotic liver disease: A meta-analysis.Biomol Biomed. 2025 Mar 7;25(4):810-821. doi: 10.17305/bb.2024.11577. Biomol Biomed. 2025. PMID: 39831901 Free PMC article.
References
-
- Younossi ZM, Koenig AB, Abdelatif D, Fazel Y, Henry L, Wymer M. Global epidemiology of nonalcoholic fatty liver disease-Meta-analytic assessment of prevalence, incidence, and outcomes. Hepatology. 2016;64:73–84. - PubMed
-
- Estes C, Anstee QM, Arias-Loste MT, Bantel H, Bellentani S, Caballeria J, et al. Modeling NAFLD disease burden in China, France, Germany, Italy, Japan, Spain, United Kingdom, and United States for the period 2016-2030. J Hepatol. 2018;69:896–904. - PubMed
LinkOut - more resources
Full Text Sources
Miscellaneous