

Endothelial shear stress computed from coronary computed tomography angiography: A direct comparison to intravascular ultrasound
- PMID: 37076326
- PMCID: PMC10993230
- DOI: 10.1016/j.jcct.2023.03.009
Endothelial shear stress computed from coronary computed tomography angiography: A direct comparison to intravascular ultrasound
Abstract
Introduction: Intravascular ultrasound (IVUS) studies have shown that biomechanical variables, particularly endothelial shear stress (ESS), add synergistic prognostic insight when combined with anatomic high-risk plaque features. Non-invasive risk assessment of coronary plaques with coronary computed tomography angiography (CCTA) would be helpful to enable broad population risk-screening.
Aim: To compare the accuracy of ESS computation of local ESS metrics by CCTA vs IVUS imaging.
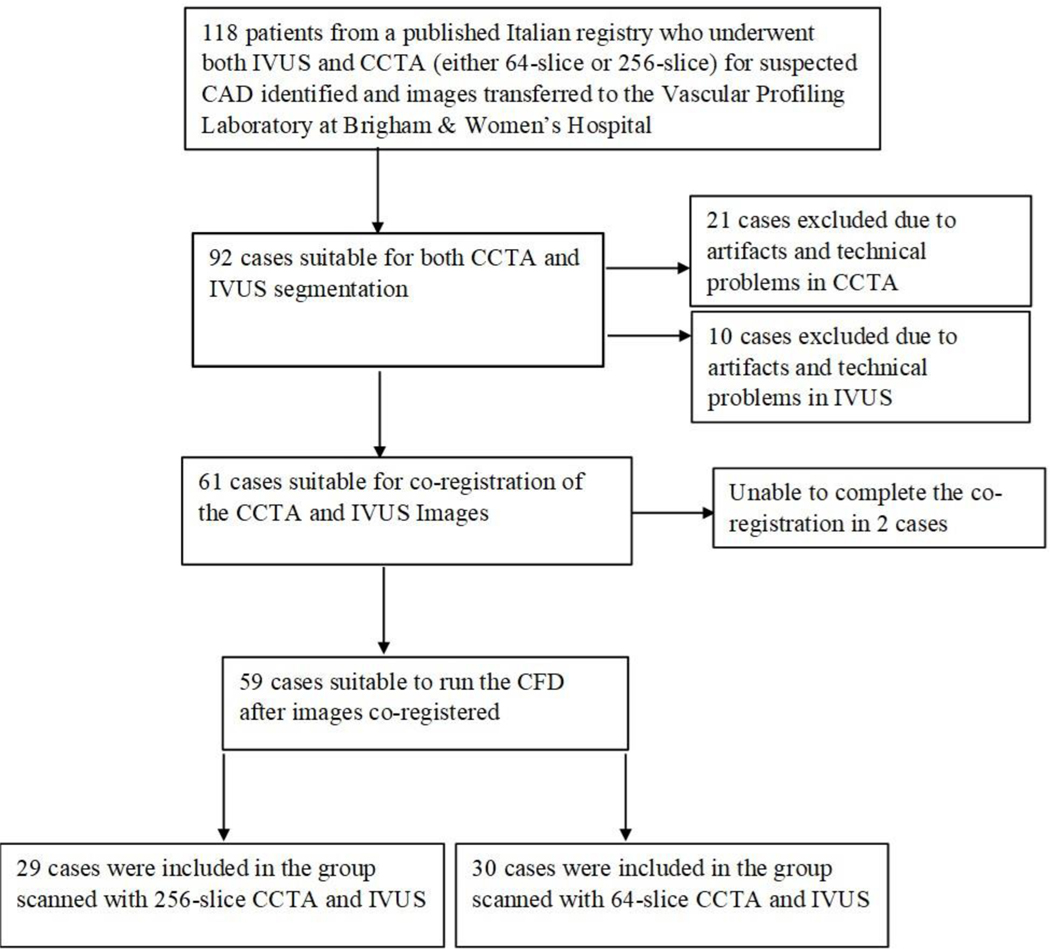
Methods: We analyzed 59 patients from a registry of patients who underwent both IVUS and CCTA for suspected CAD. CCTA images were acquired using either a 64- or 256-slice scanner. Lumen, vessel, and plaque areas were segmented from both IVUS and CCTA (59 arteries, 686 3-mm segments). Images were co-registered and used to generate a 3-D arterial reconstruction, and local ESS distribution was assessed by computational fluid dynamics (CFD) and reported in consecutive 3-mm segments.
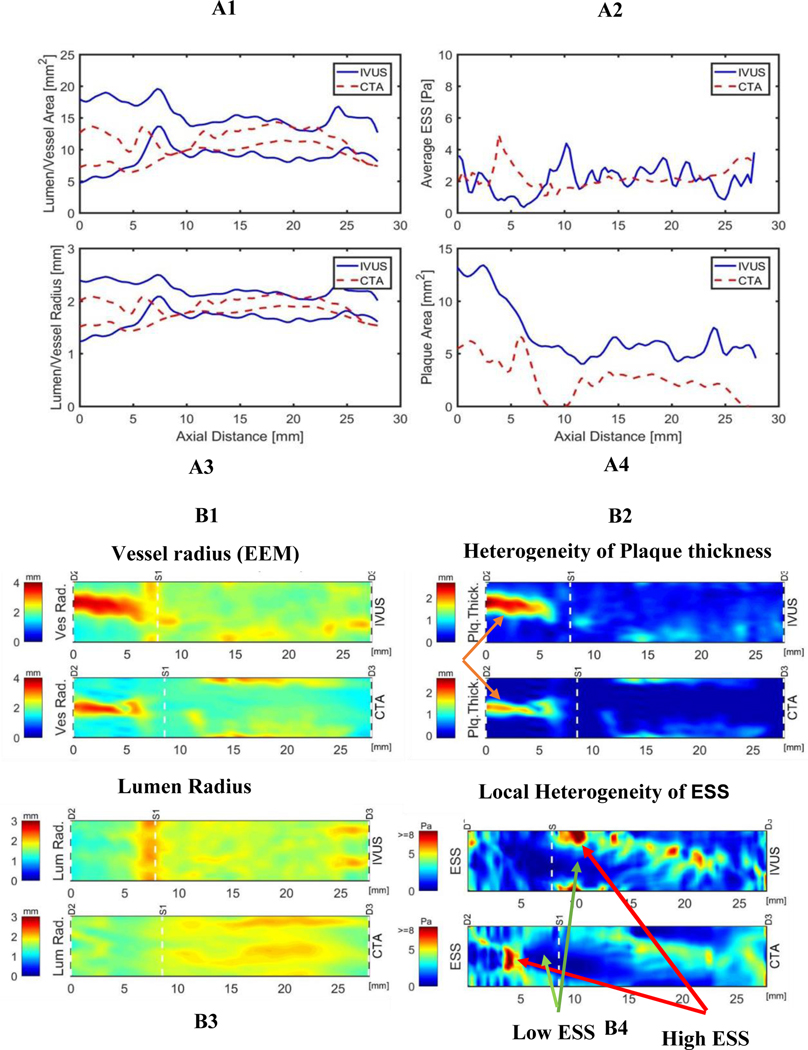
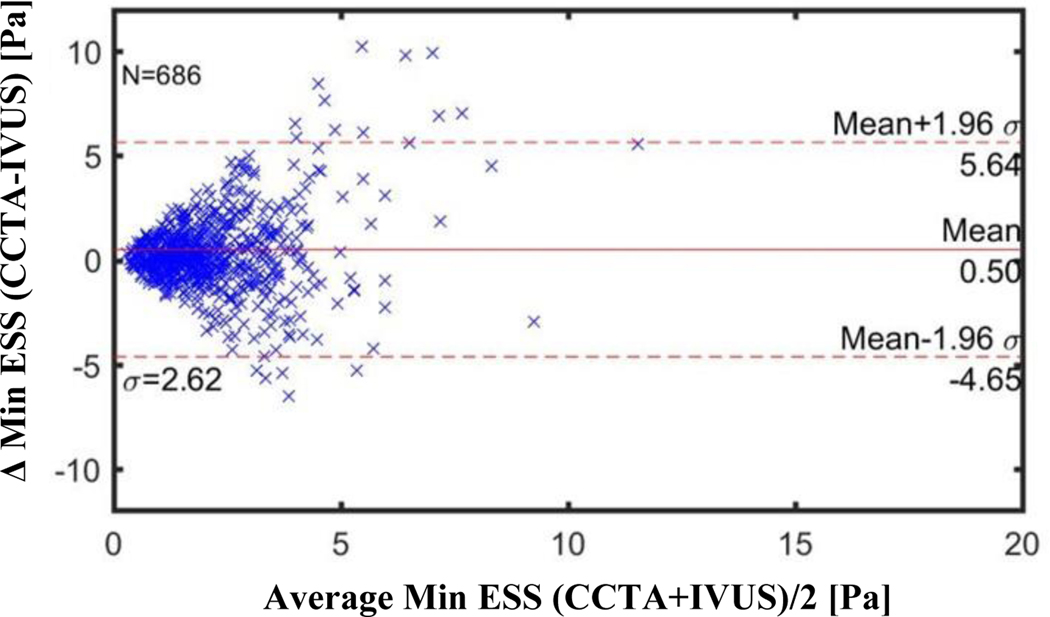
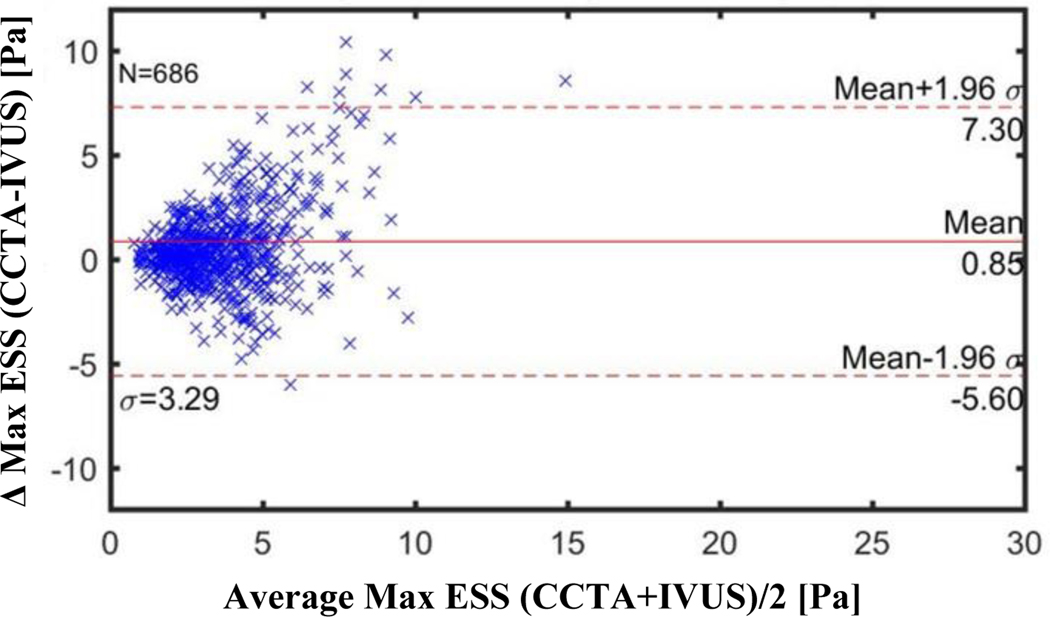
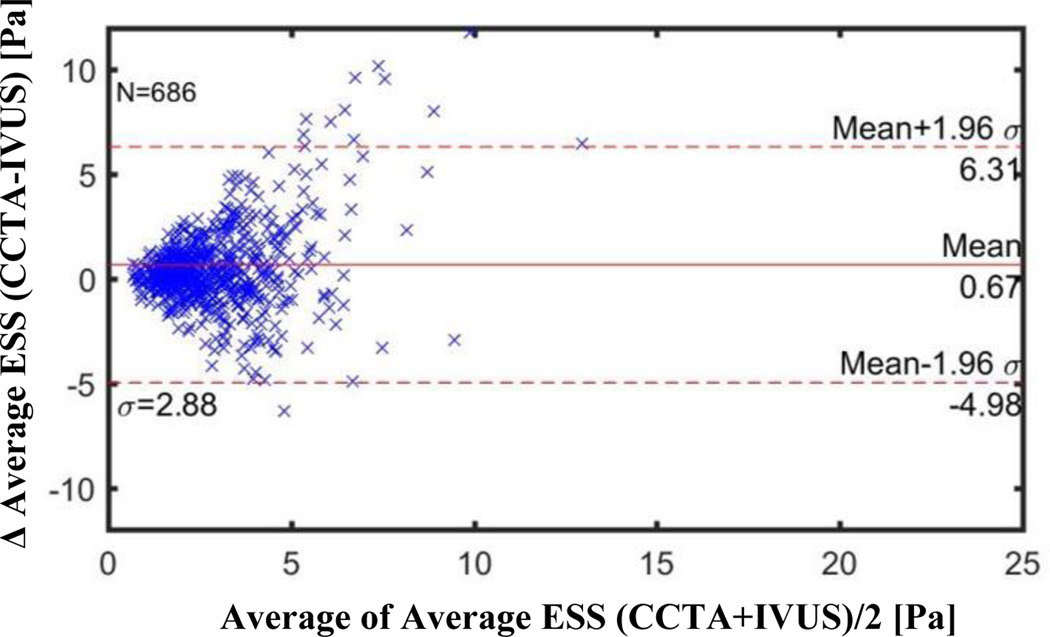
Results: Anatomical plaque characteristics (vessel, lumen, plaque area and minimal luminal area [MLA] per artery) were correlated when measured with IVUS and CCTA: 12.7 ± 4.3 vs 10.7 ± 4.5 mm2, r = 0.63; 6.8 ± 2.7 vs 5.6 ± 2.7 mm2, r = 0.43; 5.9 ± 2.9 vs 5.1 ± 3.2 mm2, r = 0.52; 4.5 ± 1.3 vs 4.1 ± 1.5 mm2, r = 0.67 respectively. ESS metrics of local minimal, maximal, and average ESS were also moderately correlated when measured with IVUS and CCTA (2.0 ± 1.4 vs 2.5 ± 2.6 Pa, r = 0.28; 3.3 ± 1.6 vs 4.2 ± 3.6 Pa, r = 0.42; 2.6 ± 1.5 vs 3.3 ± 3.0 Pa, r = 0.35, respectively). CCTA-based computation accurately identified the spatial localization of local ESS heterogeneity compared to IVUS, with Bland-Altman analyses indicating that the absolute ESS differences between the two CCTA methods were pathobiologically minor.
Conclusion: Local ESS evaluation by CCTA is possible and similar to IVUS; and is useful for identifying local flow patterns that are relevant to plaque development, progression, and destabilization.
Keywords: CCTA; Coronary computed tomography angiography; ESS; Endothelial shear stress; IVUS; Intravascular ultrasound.
Copyright © 2023 Society of Cardiovascular Computed Tomography. Published by Elsevier Inc. All rights reserved.
Conflict of interest statement
Declaration of competing interest The authors declare the following financial interests/personal relationships which may be considered as potential competing interests: Peter H Stone reports financial support was provided by the National Institute of Health. Mona Ahmed reports financial support was provided by Swedish Heart and Lung Association. Mona Ahmed reports financial support was provided by Swedish Research Council. Peter H Stone reports financial support was provided by Schaubert Family..
Figures
Similar articles
-
Estimation of endothelial shear stress in atherosclerotic lesions detected by intravascular ultrasound using computational fluid dynamics from coronary CT scans with a pulsatile blood flow and an individualized blood viscosity.Clin Hemorheol Microcirc. 2021;79(4):505-518. doi: 10.3233/CH-201025. Clin Hemorheol Microcirc. 2021. PMID: 33459702
-
Implications of computed tomography reconstruction algorithms on coronary atheroma quantification: Comparison with intravascular ultrasound.J Cardiovasc Comput Tomogr. 2023 Jan-Feb;17(1):43-51. doi: 10.1016/j.jcct.2022.09.004. Epub 2022 Sep 21. J Cardiovasc Comput Tomogr. 2023. PMID: 36270952
-
Utility of Multimodality Intravascular Imaging and the Local Hemodynamic Forces to Predict Atherosclerotic Disease Progression.JACC Cardiovasc Imaging. 2020 Apr;13(4):1021-1032. doi: 10.1016/j.jcmg.2019.02.026. Epub 2019 Jun 12. JACC Cardiovasc Imaging. 2020. PMID: 31202749
-
Should CT replace IVUS for evaluation of CAD in large-scale clinical trials: Effects of medical therapy on atherosclerotic plaque.J Cardiovasc Comput Tomogr. 2019 Sep-Oct;13(5):248-253. doi: 10.1016/j.jcct.2019.06.017. Epub 2019 Jul 10. J Cardiovasc Comput Tomogr. 2019. PMID: 31351840 Review.
-
Coronary CT angiography versus intravascular ultrasound for estimation of coronary stenosis and atherosclerotic plaque burden: a meta-analysis.J Cardiovasc Comput Tomogr. 2013 Jul-Aug;7(4):256-66. doi: 10.1016/j.jcct.2013.08.006. Epub 2013 Aug 23. J Cardiovasc Comput Tomogr. 2013. PMID: 24148779 Review.
Cited by
-
Cardiovascular computed tomography in cardiovascular disease: An overview of its applications from diagnosis to prediction.J Geriatr Cardiol. 2024 May 28;21(5):550-576. doi: 10.26599/1671-5411.2024.05.002. J Geriatr Cardiol. 2024. PMID: 38948894 Free PMC article.
-
The plaque hypothesis: understanding mechanisms of plaque progression and destabilization, and implications for clinical management.Curr Opin Cardiol. 2023 Nov 1;38(6):496-503. doi: 10.1097/HCO.0000000000001077. Epub 2023 Aug 28. Curr Opin Cardiol. 2023. PMID: 37767898 Free PMC article. Review.
References
-
- Samady H, Eshtehardi P, McDaniel MC, Suo J, Dhawan SS, Maynard C, Timmins LH, Quyyumi AA, Giddens DP. Coronary artery wall shear stress is associated with progression and transformation of atherosclerotic plaque and arterial remodeling in patients with coronary artery disease. Circulation. 2011;124:779–788. - PubMed
-
- Stone PH, Maehara A, Coskun AU, Maynard CC, Zaromytidou M, Siasos G, Andreou I, Fotiadis D, Stefanou K, Papafaklis M, et al. Role of Low Endothelial Shear Stress and Plaque Characteristics in the Prediction of Nonculprit Major Adverse Cardiac Events: The PROSPECT Study. JACC Cardiovasc Imaging. 2018;11:462–471. - PubMed
-
- Yamamoto E, Siasos G, Zaromytidou M, Coskun AU, Xing L, Bryniarski K, Zanchin T, Sugiyama T, Lee H, Stone PH, et al. Low Endothelial Shear Stress Predicts Evolution to High-Risk Coronary Plaque Phenotype in the Future: A Serial Optical Coherence Tomography and Computational Fluid Dynamics Study. Circ Cardiovasc Interv. 2017;10:e005455. - PubMed
-
- Oemrawsingh RM, Cheng JM, García-García HM, van Geuns R-J, de Boer SPM, Simsek C, Kardys I, Lenzen MJ, van Domburg RT, Regar E, et al. Near-infrared spectroscopy predicts cardiovascular outcome in patients with coronary artery disease. J Am Coll Cardiol. 2014;64:2510–2518. - PubMed
-
- Waksman R, Di Mario C, Torguson R, Ali ZA, Singh V, Skinner WH, Artis AK, Cate TT, Powers E, Kim C, et al. Identification of patients and plaques vulnerable to future coronary events with near-infrared spectroscopy intravascular ultrasound imaging: a prospective, cohort study. Lancet. 2019;394:1629–1637. - PubMed
MeSH terms
Grants and funding
LinkOut - more resources
Full Text Sources
Medical
Miscellaneous
