. 2023 Apr 19;14(1):2150.
doi: 10.1038/s41467-023-37464-2.

Disrupting the α-synuclein-ESCRT interaction with a peptide inhibitor mitigates neurodegeneration in preclinical models of Parkinson's disease

Affiliations

Disrupting the α-synuclein-ESCRT interaction with a peptide inhibitor mitigates neurodegeneration in preclinical models of Parkinson's disease

Satra Nim et al. Nat Commun. .

Abstract

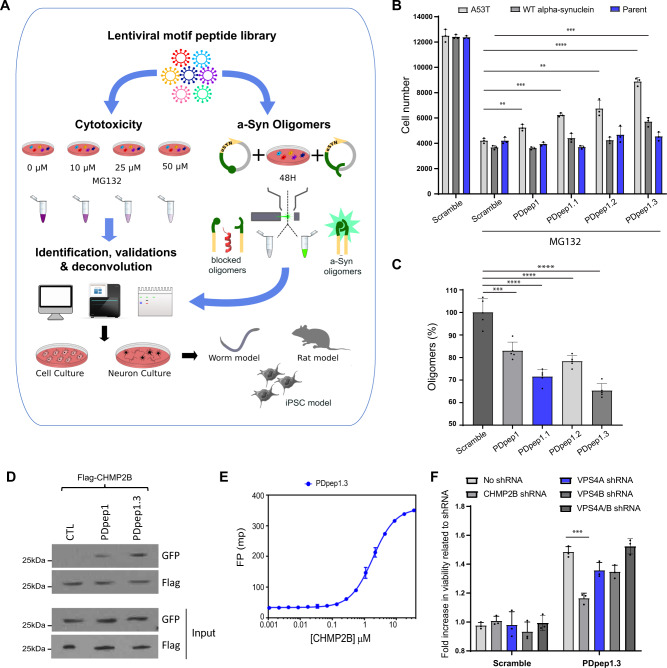
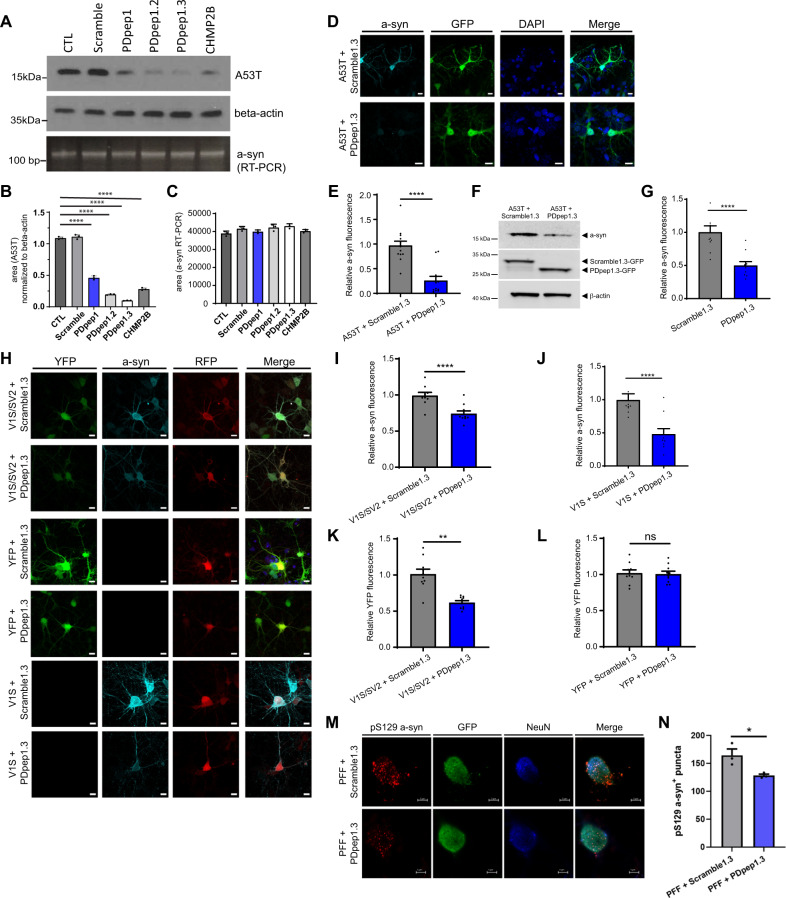
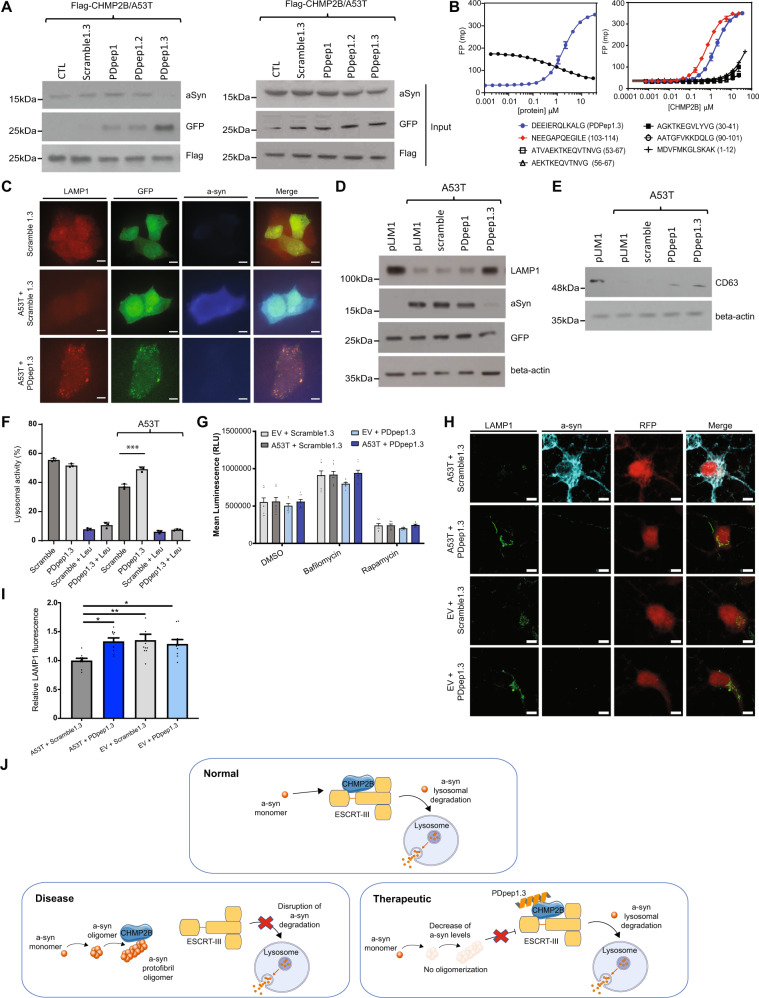
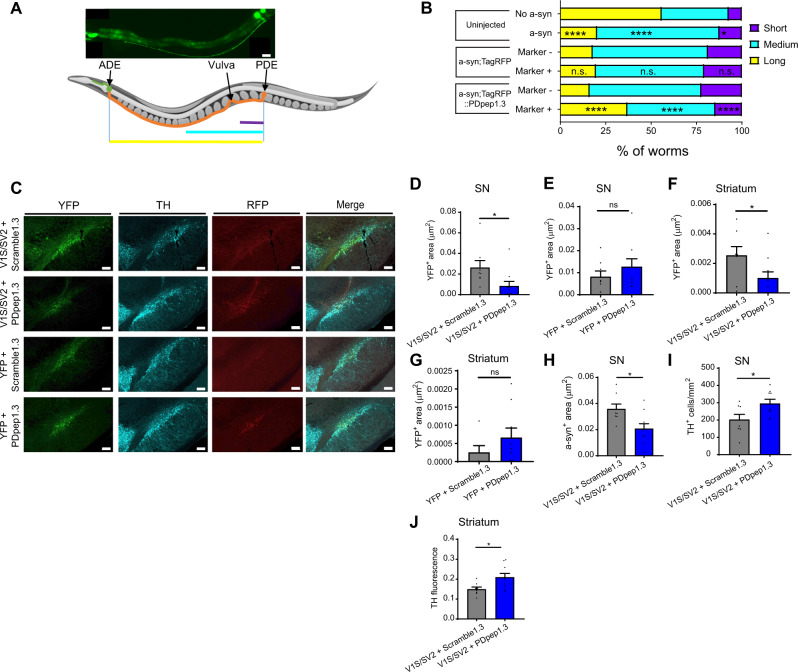
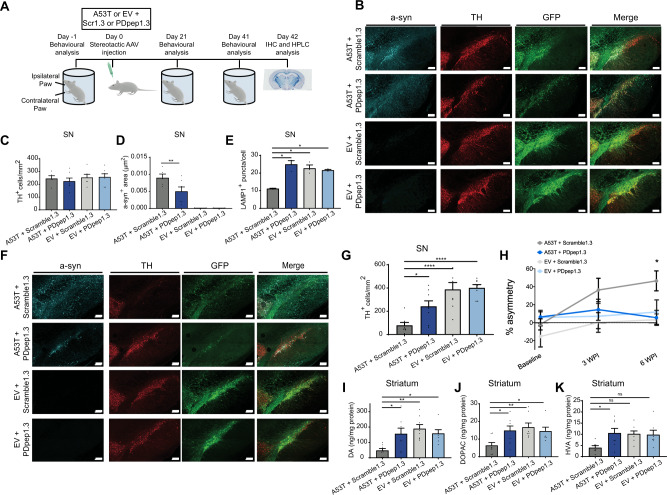
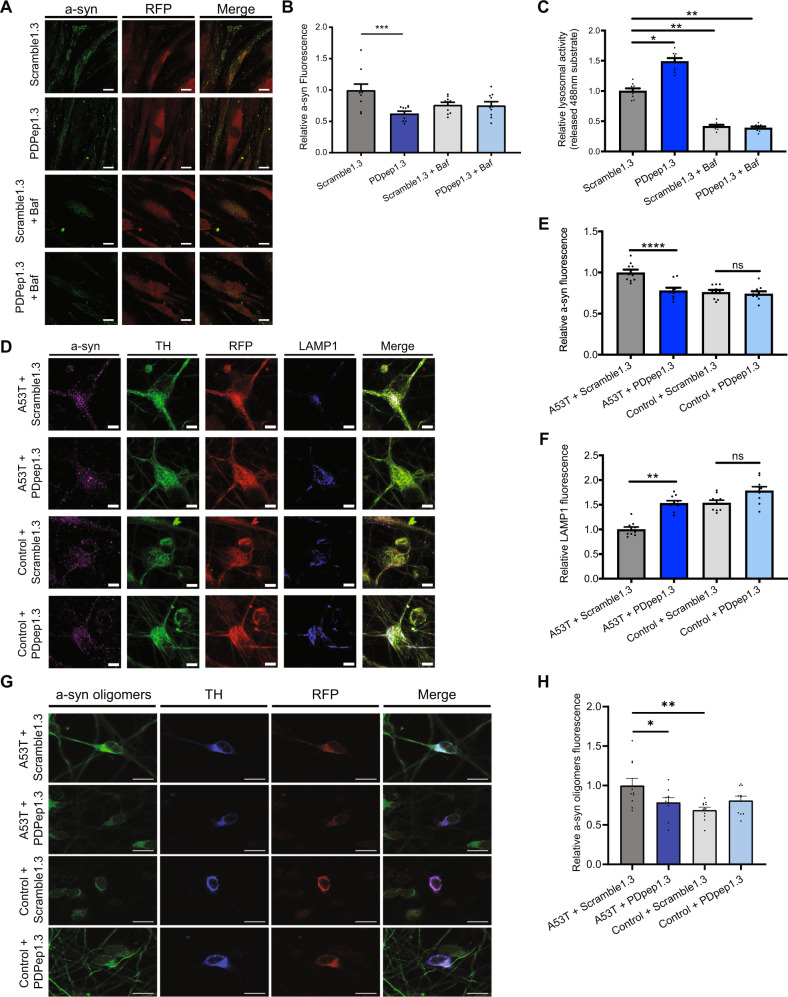
Accumulation of α-synuclein into toxic oligomers or fibrils is implicated in dopaminergic neurodegeneration in Parkinson's disease. Here we performed a high-throughput, proteome-wide peptide screen to identify protein-protein interaction inhibitors that reduce α-synuclein oligomer levels and their associated cytotoxicity. We find that the most potent peptide inhibitor disrupts the direct interaction between the C-terminal region of α-synuclein and CHarged Multivesicular body Protein 2B (CHMP2B), a component of the Endosomal Sorting Complex Required for Transport-III (ESCRT-III). We show that α-synuclein impedes endolysosomal activity via this interaction, thereby inhibiting its own degradation. Conversely, the peptide inhibitor restores endolysosomal function and thereby decreases α-synuclein levels in multiple models, including female and male human cells harboring disease-causing α-synuclein mutations. Furthermore, the peptide inhibitor protects dopaminergic neurons from α-synuclein-mediated degeneration in hermaphroditic C. elegans and preclinical Parkinson's disease models using female rats. Thus, the α-synuclein-CHMP2B interaction is a potential therapeutic target for neurodegenerative disorders.


Conflict of interest statement

University of Toronto has submitted a patent application covering composition and use of the peptides, as well as the screening methods (US Patent 63/289,912, currently pending with PCT filed) with S.N., C.C.V., S.K.K., L.V.K., and P.M.K. as inventors. S.K.K., L.V.K., and P.M.K. have co-founded Synepark Therapeutics Inc to commercialize aspects of this research. The remaining authors declare no competing interests.

Figures

Fig. 1
Fig. 1. Proteomic screens and in vitro validation of hits.
A Schematic of the experimental design including proteomic screens, identification and validation of hits, target deconvolution, and evaluation in cell and animal models (created using Servier Medical Art at https://smart.servier.com/). For the cytotoxicity screen, we employed our peptide library to identify peptides that rescue cytotoxicity induced by a-syn overexpression and proteostatic stress (due to MG132 administration). To screen our library for peptides that inhibit a-syn oligomers, we used FACS with a split YFP-a-syn system (cells co-expressing V1S and SV2). B Validation of cell viability effect of peptides in A53T and WT a-syn expressing cells under proteostatic stress as well as controls. MG132 was used at a concentration of 10 μM. Experiments were done in triplicate. Data represent means ± s.d. (unpaired two-tailed t-tests; A53T PDpep1, P = 0.0051; A53T PDpep1.1, P = 0.0002; A53T PDpep1.2, P = 0.0035; A53T PDpep1.3, P < 0.0001; WT a-syn PDpep1.3, P = 0.0008; n = 3). C WT a-syn oligomers as measured by luciferase activity. All four peptides showed significant reduction in a-syn oligomers from cells stably expressing split luciferase-a-syn constructs. Experiments were done in triplicate. Data represent means ± s.d. (unpaired two-tailed t-tests; PDpep1, P = 0.0008; PDpep1.1, PDpep1.2, PDpep1.3, P < 0.0001; n = 3). D Co-immunoprecipitation experiment with Flag-CHMP2B and GFP-peptides (n = 3). PDpep1 and PDpep1.3 peptides interacted with Flag-CHMP2B whereas GFP alone (CTL) did not. E Fluorescence polarization (FP) binding assay of a FITC-labeled PDpep1.3 peptide against CHMP2B. Error bars represent ± s.d. of the fit (n = 5). F Knockdown of CHMP2B or VPS4 in A53T a-syn expressing cells under proteostatic stress. Cell viabilities were measured with cells stably expressing different shRNAs and transfected with Scramble or PDpep1.3 peptide. Experiments were done in triplicate. Data represent means ± s.d. (unpaired two-tailed t-tests; PDpep1.3, P = 0.0005; n = 3). **P < 0.01; ***P < 0.001; ****P < 0.0001. Source data are provided as a Source Data file.
Fig. 2
Fig. 2. PDpep1.3 reduces a-syn levels in cell lines and primary cortical neurons.
A Representative immunoblots of a-syn levels in HEK293 cells expressing A53T a-syn plus GFP alone (CTL), peptides, or full-length CHMP2B (top panel). Loading control was beta-actin (middle panel). RT-PCR shows no change in a-syn mRNA levels (bottom panel). B Quantification of A53T a-syn protein level (normalized to beta-actin) from immunoblot data represented in (A). Bars represent means ± s.d. (unpaired two-tailed t-tests; PDpep1, PDpep1.2, PDpep1.3, CHMP2B, P < 0.0001; n = 3). C Quantification of a-syn mRNA from RT-PCR data represented in (A). Bars represent means ± s.d. (n = 3). D Representative images of rat cortical neurons transduced with A53T a-syn plus Scramble1.3-GFP or PDpep1.3-GFP (scale bars = 5 µm). E Quantification of relative a-syn fluorescence in GFP-positive neurons. Bars represent means ± s.e.m. (two-tailed nested t-tests, t(55) = 6.545; P < 0.0001; n = 3). F Representative immunoblot of human a-syn (top panel) and GFP (middle panel) of lysates from cortical neurons transduced with A53T a-syn plus Scramble1.3-GFP or PDpep1.3-GFP. Loading control was beta-actin (bottom panel). G Quantification of relative endogenous a-syn fluorescence in GFP-positive neurons transduced with Scramble1.3-GFP or PDpep1.3-GFP. Bars represent means ± s.e.m. (two-tailed nested t-test, t(55) = 5.504; P < 0.0001; n = 3). H Representative images of rat cortical neurons transduced with V1S/SV2 or YFP plus Scramble1.3-RFP or PDpep1.3-RFP to assess for a-syn oligomer levels. Quantification of relative a-syn fluorescence in RFP-positive cortical neurons transduced with I V1S/SV2 plus Scramble1.3-RFP or PDpep1.3-RFP (two-tailed nested t-test, t(51) = 4.915; P < 0.0001; n = 3) or J V1S alone plus Scramble1.3-RFP or PDpep1.3-RFP (two-tailed nested t-test, t(36) = 3.468; P = 0.0014; n = 3). Quantification of relative YFP fluorescence in RFP-positive cortical neurons transduced with K V1S/SV2 plus Scramble1.3-RFP or PDpep1.3-RFP (two-tailed nested t-test, t(54) = 5.455; P = 0.0055; n = 3) or L YFP plus Scramble1.3-RFP or PDpep1.3-RFP (two-tailed nested t-test, t(56) = 0.092; P = 0.93; n = 3). M Representative images of cortical neurons treated with human a-syn PFFs plus Scramble1.3-GFP or PDpep1.3-GFP (scale bars = 5 μm). N Quantification of number of pS129 a-syn+ puncta per GFP-positive neuron (unpaired two-tailed t-test, t(4) = 3.099; P = 0.0362; n = 3). *P < 0.05; **P < 0.01; ****P < 0.0001; ns indicates P > 0.05. Source data are provided as a Source Data file.
Fig. 3
Fig. 3. PDpep1.3 outcompetes a-syn binding to CHMP2B to enhance endolysosomal-mediated clearance of a-syn.
A Validation of PPI disruption using co-immunoprecipitation assays. Flag-CHMP2B was immunoprecipitated in the presence of HA-tagged A53T a-syn and GFP-tagged peptides. Negative controls were GFP alone (CTL) and a GFP-tagged scrambled version of PDpep1.3 (Scramble1.3); neither markedly co-immunoprecipitated with CHMP2B nor disrupted the interaction between CHMP2B and A53T a-syn. B Fluorescence polarization (FP) binding assay of FITC-labeled PDpep1.3 (blue) and displacement of the fluorescent peptide with increasing concentrations of a-syn (black). Error bars represent ± s.d. of the fit (n = 3) (left panel). FP binding assay of FITC-labeled a-syn peptides. Error bars represent ± s.d. of the fit (n = 3) (right panel). C PDpep1.3 restores reduced LAMP1 expression due to A53T a-syn in HEK293 cells as shown by confocal micrographs (scale bars = 15 μm). Representative immunoblots of D LAMP1 levels or E CD63 levels in HEK293 cells upon co-transfection of A53T a-syn and peptides. Controls were GFP alone (pLJM1) and a GFP-tagged scrambled version of the initial peptide (scramble). Loading control was beta-actin. Experiments were done in triplicate. F Endolysosomal flux assay using flow cytometry in HEK293 cells co-transfected with A53T a-syn or control vector plus Scramble1.3 or PDpep1.3. Cells were treated with the lysosomal inhibitor Leupeptin (Leu) as indicated. Data represent means ± s.d. (unpaired two-tailed t-test, t(4) = 2.776; A53T+PDpep1.3, P = 0.0010; n = 3). G Autophagy flux assay in HEK293 cells stably expressing a luminescent LC3-HiBiT reporter co-transfected with A53T a-syn or empty vector (EV) plus Flag-Scramble1.3 or Flag-PDpep1.3. Cells were treated with the lysosomal inhibitor Bafilomycin A1 or the autophagy inducer Rapamycin as indicated. Bars represent means ± s.e.m. (n = 3). H Representative images of cortical neurons transduced with A53T a-syn or EV plus Scramble1.3-RFP or PDpep1.3-RFP (scale bars = 5 μm). I Quantification of LAMP1 fluorescence in RFP-positive neurons. Bars represent means ± s.e.m. (nested one-way ANOVA, F(3, 102) = 4.430; P = 0.0057; n = 3). J The proposed mechanism of PDpep1.3 is that the peptide disrupts the a-syn-CHMP2B interaction to restore degradation of a-syn by the endolysosomal pathway (created using Servier Medical Art at https://smart.servier.com/). *P < 0.05; **P < 0.01; ***P < 0.001. Source data are provided as a Source Data file.
Fig. 4
Fig. 4. PDpep1.3 reduces a-syn-mediated neurodegeneration in C. elegans and an a-syn oligomer rat model.
A Representative image of an adult C. elegans with PDE neuron visualized using dat-1p::gfp(egIs1) (scale bar = 20 μm) (top panel). Neurite length for each PDE neuron was categorized as: Short (does not extend past the vulva; purple), Medium (extends past the vulva but not beyond halfway to ADE neuron; cyan), or Long (extends to ADE neuron; yellow) (created using an image from somersault1824 at https://somersault1824.gumroad.com/). B Frequencies of PDE neurite lengths were compared for C. elegans expressing no a-syn versus a-syn alone (Pearson Chi-Square test, χ2(2, 1252) = 169.0; P < 0.0001), a-syn with RFP (a-syn;TagRFP Marker+) versus a-syn without RFP (a-syn;TagRFP Marker-) (Pearson Chi-Square test, χ2(2, 910) = 1.332; P = 0.5137), and a-syn with RFP-PDpep1.3 (a-syn;TagRFP::PDpep1.3 Marker+) versus a-syn without RFP-PDpep1.3 (a-syn;TagRFP::PDpep1.3 Marker-) (Pearson Chi-Square test, χ2(2, 1528) =  86.1729; P < 0.0001). C Representative images of native YFP and RFP fluorescence and immunostaining with anti-tyrosine hydroxylase (TH) antibody in substantia nigra (SN) of rats injected with V1S/SV2 or YFP plus Scramble1.3-RFP or PDpep1.3-RFP (scale bars = 200 μm). Quantification of YFP+ area in SN of rats injected with D V1S/SV2 (unpaired two-tailed t-test, t(16) = 2.317; P = 0.0341; Scramble1.3, n = 8 rats; PDpep1.3, n = 10 rats) or E full-length YFP (unpaired two-tailed t-test, t(15) = 1.003; P = 0.3317; Scramble1.3, n = 8 rats; PDpep1.3, n = 9 rats). Quantification of YFP+ area in striatum of rats injected with F V1S/SV2 (unpaired two-tailed t-test, t(16) = 2.193; P = 0.0434; Scramble1.3, n = 8 rats; PDpep1.3, n = 10 rats) or G full-length YFP (unpaired two-tailed t-test, t(13) = 1.140; P = 0.2749; Scramble1.3, n = 6 rats; PDpep1.3, n = 9 rats). H Quantification of a-syn+ area in SN (unpaired two-tailed t-test, t(16) = 2.843; P = 0.0118; Scramble1.3, n = 8 rats; PDpep1.3, n = 10 rats), I TH+ cell counts in SN (unpaired two-tailed t-test, t(15) = 2.421; P = 0.0286; Scramble1.3, n = 8 rats; PDpep1.3, n = 9 rats), and J TH fluorescence in striatum (unpaired two-tailed t-test, t(16) = 2.664; P = 0.0170; Scramble1.3, n = 8 rats; PDpep1.3, n = 10 rats) at 6 weeks post-injection of V1S/SV2 plus Scramble1.3-RFP or PDpep1.3-RFP. Bars represent means ± s.e.m. *P < 0.05; ****P < 0.0001; ns indicates P > 0.05. Source data are provided as a Source Data file.
Fig. 5
Fig. 5. PDpep1.3 reduces a-syn levels and a-syn-mediated neurodegeneration in a preclinical rat model of PD.
A Experimental design for testing PDpep1.3 versus Scramble1.3 in AAV-A53T a-syn rat model (created using an image from Biorender at http://www.biorender.com/). B Representative images of immunostaining (with anti-a-syn or anti-TH antibodies) and native GFP fluorescence in substantia nigra (SN) of rats injected with low titer A53T a-syn or empty vector (EV) plus Scramble1.3-GFP or PDpep1.3-GFP (scale bars = 200 μm). C TH+ cell counts (A53T+Scramble1.3, n = 5 rats; A53T+PDpep1.3, n = 7 rats; EV+Scramble1.3, n = 6 rats; EV+PDpep1.3, n = 7 rats), D quantification of a-syn+ area (one-way ANOVA, F(3, 21) = 24.89; P < 0.0001 followed by Dunnett’s post-test; A53T+Scramble1.3, n = 5 rats; A53T+PDpep1.3, n = 7 rats; EV+Scramble1.3, n = 6 rats; EV+PDpep1.3, n = 7 rats), and E LAMP1+ puncta counts in SN at 6 weeks post-injection of low titer A53T a-syn or EV plus Scramble1.3-GFP or PDpep1.3-GFP (nested one-way ANOVA, F(3, 8) = 5.780; P = 0.0211 followed by Dunnett’s post-test; n = 3 rats per group). F Representative images of immunostaining (with anti-a-syn or anti-TH antibodies) and native GFP fluorescence in SN of rats injected with high titer A53T a-syn or EV plus Scramble1.3-GFP or PDpep1.3-GFP (scale bars = 200 µm). G TH+ cell counts in SN at 6 weeks post-injection of high titer A53T a-syn or EV plus Scramble1.3-GFP or PDpep1.3-GFP (one-way ANOVA, F(3, 28) = 12.82; P < 0.0001 followed by Dunnett’s post-test; n = 8 rats per group). H Forelimb asymmetry in cylinder test at baseline (prior to injection), 3 weeks post-injection (WPI), and 6 WPI (repeated measures ANOVA, F(1.635, 37.61) = 5.185; P = 0.0147 followed by Tukey’s post-test; A53T+Scramble1.3, n = 7 rats; A53T+PDpep1.3, n = 7 rats; EV+Scramble1.3, n = 8 rats; EV+PDpep1.3, n = 7 rats). Quantification of I dopamine (one-way ANOVA, F(3, 27) = 5.659; P = 0.0038 followed by Dunnett’s post-test; A53T+Scramble1.3, n = 8 rats; A53T+PDpep1.3, n = 8 rats; EV+Scramble1.3, n = 8 rats; EV+PDpep1.3, n = 7 rats), J DOPAC (one-way ANOVA, F(3, 27) = 4.434; P = 0.0117 followed by Dunnett’s post-test; A53T+Scramble1.3, n = 8 rats; A53T+PDpep1.3, n = 8 rats; EV+Scramble1.3, n = 8 rats; EV+PDpep1.3, n = 7 rats), and K HVA (one-way ANOVA, F(3, 26) = 3.400; P = 0.0326 followed by Dunnett’s post-test; A53T+Scramble1.3, n = 7 rats; A53T+PDpep1.3, n = 8 rats; EV+Scramble1.3, n = 8 rats; EV+PDpep1.3, n = 7 rats) in striatum. Data in all graphs represent means ± s.e.m. *P < 0.05; **P < 0.01; ****P < 0.0001; ns indicates P > 0.05. Source data are provided as a Source Data file.
Fig. 6
Fig. 6. PDpep1.3 reduces endogenous a-syn levels and rescues lysosomal activity in human PD cell models.
A Representative images of fibroblasts from a PD patient with SNCA triplication transduced with Scramble1.3-RFP or PDpep1.3-RFP (scale bars = 10 µm). B Quantification of relative a-syn fluorescence in RFP-positive fibroblasts. Bars represent means ± s.e.m. (one-way ANOVA, F(3, 36) = 6.159; P = 0.0017 followed by Dunnett’s post-test; n = 3). C Endolysosomal flux assay using confocal microscopy in SNCA triplication fibroblasts transduced with AAV-Scramble1.3-RFP or AAV-PDpep1.3-RFP. Cells were treated as indicated with Bafilomycin A1 (Baf). Bars represent means ± s.e.m. (nested one-way ANOVA, F(3, 10) =  = 23.70; P < 0.0001 followed by Dunnett’s post-test; n = 3). D Representative images of human iPSC-derived dopaminergic neurons with A53T a-syn mutation or isogenic controls without a-syn mutation. These iPSC-derived dopaminergic neurons were transduced with Scramble1.3-RFP or PDpep1.3-RFP and immunostained with anti-a-syn, anti-TH, or anti-LAMP1 antibodies (scale bars = 5 μm). E Quantification of relative a-syn fluorescence intensity in RFP-positive A53T mutant and control iPSC-derived dopaminergic neurons. Bars represent means ± s.e.m. (two-tailed nested t-tests; A53T, t(78) = 5.096, P < 0.001; Control, t(75) = 0.2708, P = 0.80; n = 3). F Quantification of relative LAMP1 fluorescence intensity in RFP-positive A53T mutant and control iPSC-derived dopaminergic neurons. Bars represent means ± s.e.m. (two-tailed nested t-tests; A53T, t(55) = 4.748, P = 0.009; Control, t(54) = 0.7178, P = 0.51; n = 3). G Representative images of human iPSC-derived dopaminergic neurons with A53T a-syn mutation or isogenic controls without a-syn mutation. These iPSC-derived dopaminergic neurons were transduced with Scramble1.3-RFP or PDpep1.3-RFP and immunostained with anti-a-syn oligomer or anti-TH antibodies. H Quantification of relative a-syn oligomer fluorescence intensity in RFP-positive A53T mutant and control iPSC-derived dopaminergic neurons. Bars represent means ± s.e.m. (nested one-way ANOVA, F(3, 115) = 4.715, P = 0.0039 followed by Dunnett’s post-test, n = 3).*P < 0.05; **P < 0.01; ***P < 0.001; ****P < 0.0001; ns indicates P > 0.05. Source data are provided as a Source Data file.

References

    1. Corbi-Verge C, Kim PM. Motif mediated protein-protein interactions as drug targets. Cell Commun. Signal. 2016;14:8. doi: 10.1186/s12964-016-0131-4. - DOI - PMC - PubMed
    1. Mullard A. Protein-protein interaction inhibitors get into the groove. Nat. Rev. Drug Discov. 2012;11:173–175. doi: 10.1038/nrd3680. - DOI - PubMed
    1. Corbi-Verge C, Garton M, Nim S, Kim PM. Strategies to develop inhibitors of motif-mediated protein-protein interactions as drug leads. Annu. Rev. Pharm. Toxicol. 2017;57:39–60. doi: 10.1146/annurev-pharmtox-010716-104805. - DOI - PubMed
    1. Nero TL, Morton CJ, Holien JK, Wielens J, Parker MW. Oncogenic protein interfaces: small molecules, big challenges. Nat. Rev. Cancer. 2014;14:248–262. doi: 10.1038/nrc3690. - DOI - PubMed
    1. O’Hara DM, Kalia SK, Kalia LV. Emerging disease-modifying strategies targeting α-synuclein for the treatment of Parkinson’s disease. Br. J. Pharm. 2018;175:3080–3089. doi: 10.1111/bph.14345. - DOI - PMC - PubMed

Publication types

Substances