. 2023 Apr 19;13(1):6359.
doi: 10.1038/s41598-023-33444-0.

Estimation of silent phenotypes of calf antibiotic dysbiosis

Affiliations

Estimation of silent phenotypes of calf antibiotic dysbiosis

Shunnosuke Okada et al. Sci Rep. .

Abstract

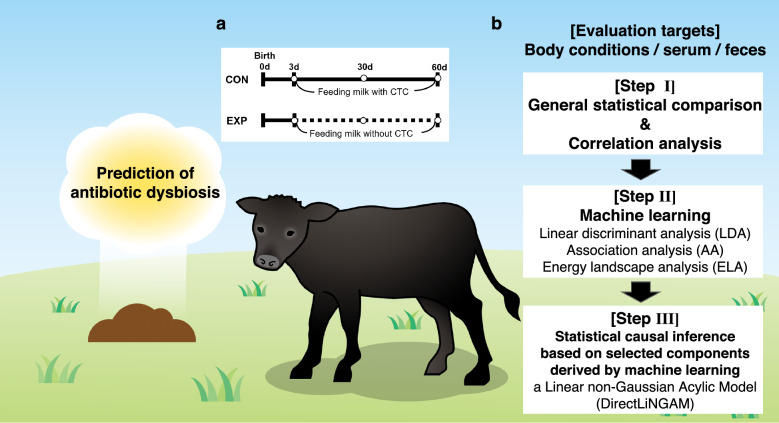
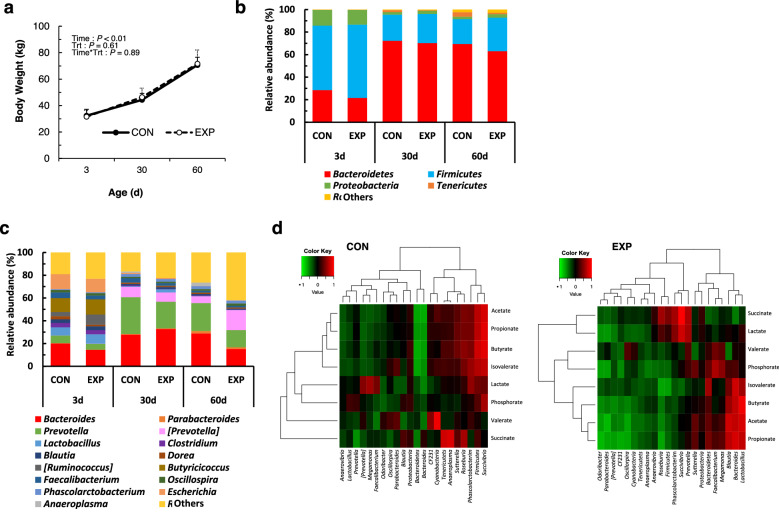
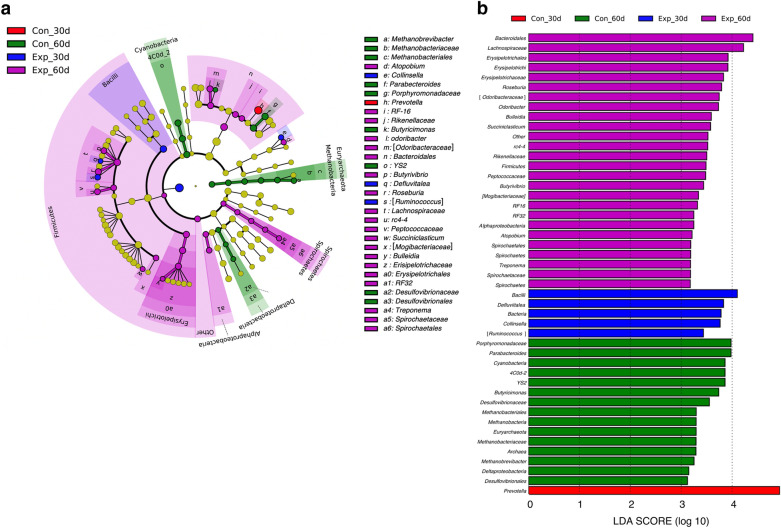
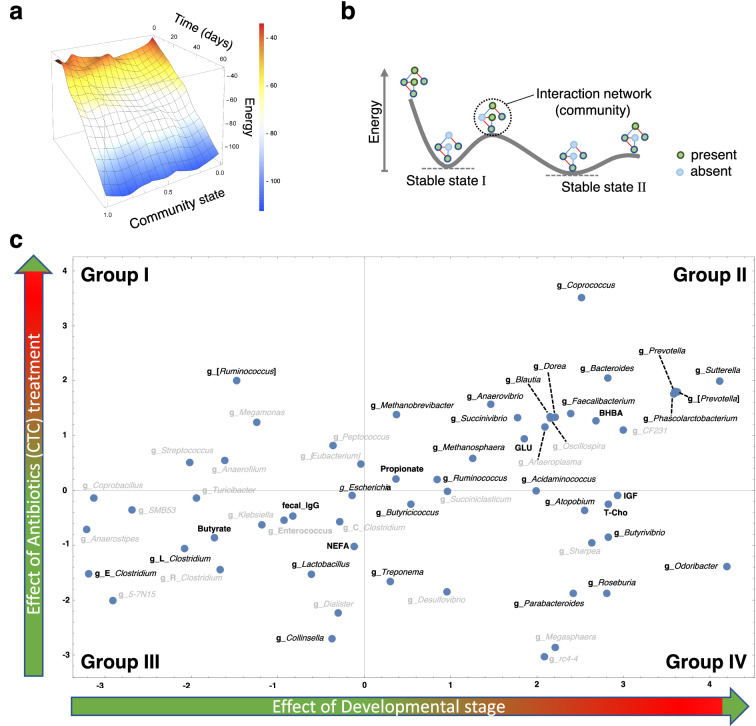
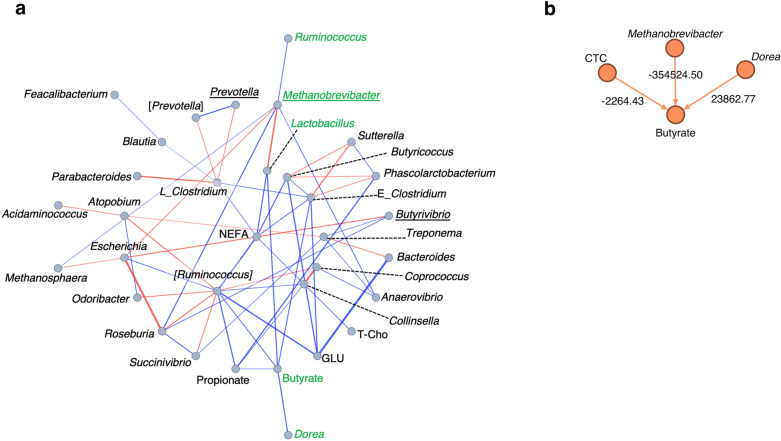
Reducing antibiotic usage among livestock animals to prevent antimicrobial resistance has become an urgent issue worldwide. This study evaluated the effects of administering chlortetracycline (CTC), a versatile antibacterial agent, on the performance, blood components, fecal microbiota, and organic acid concentrations of calves. Japanese Black calves were fed with milk replacers containing CTC at 10 g/kg (CON group) or 0 g/kg (EXP group). Growth performance was not affected by CTC administration. However, CTC administration altered the correlation between fecal organic acids and bacterial genera. Machine learning (ML) methods such as association analysis, linear discriminant analysis, and energy landscape analysis revealed that CTC administration affected populations of various types of fecal bacteria. Interestingly, the abundance of several methane-producing bacteria at 60 days of age was high in the CON group, and the abundance of Lachnospiraceae, a butyrate-producing bacterium, was high in the EXP group. Furthermore, statistical causal inference based on ML data estimated that CTC treatment affected the entire intestinal environment, potentially suppressing butyrate production, which may be attributed to methanogens in feces. Thus, these observations highlight the multiple harmful impacts of antibiotics on the intestinal health of calves and the potential production of greenhouse gases by calves.


Conflict of interest statement

The authors declare no competing interests.

Figures

Figure 1
Figure 1
Experimental design, experimental procedure, and research objectives. (a) Illustration of the experimental design. In the early postnatal period [from day (d) 3 to d 60], when the rumen had not yet developed, the antibiotic treatment group (CON) and the nontreatment group (EXP) were established. (b) The analysis target and its procedure are shown. In Step I, general statistical comparisons and correlation analyses were performed; in Step II, to screen for potential relationships among factors, supervised linear discriminant analysis (LDA), unsupervised association analysis (AA), and energy landscape analysis (ELA) were performed as machine learning (ML). In Step III, to statistically determine the causal relationship between the factors narrowed down by ML, linear non-Gaussian acyclic model (DirectLiNGAM) analysis, which can be applied to non-Gaussian distributions, was implemented to statistically estimate the causal relationship between factors refined by ML. These three steps allowed us to infer the mechanism of intestinal disturbance induced by antibiotics (dysbiosis) in calves.
Figure 2
Figure 2
General statistical comparisons and correlation analyses. (a) Changes in BW during the period. Relative abundance of the fecal microbiota at the (b) phylum and (c) genus levels in calves fed milk replacer containing chlortetracycline (CTC) at 10 g/kg (CON) or 0 g/kg (EXP). (d) Correlation between fecal organic acids and bacterial genera during the period based on the sampling data at 30 and 60 d.
Figure 3
Figure 3
Screening for potential relationships among factors by linear discriminant analysis (LDA). (a) LDA effect size (LEfSe) cladogram visualized based on the significant changes in the bacterial population calculated by LDA (p < 0.05; > threefold change). (b) Significant changes in the bacterial population calculated by LDA (p < 0.05; > threefold change). CON group: group treated with antibiotics (n = 6); EXP group: group treated without antibiotics (n = 6).
Figure 4
Figure 4
Screening for potential relationships among factors for energy landscape analysis (ELA) and refinement by other machine learning (ML) approaches. (a) The ELAassociated with antibiotic treatment is visualized. The axis formed the energy landscape with compositional energy, community state, and treatment time (days). (b) The concept of the stable state in ELA is shown. Each green circle indicates a constituent element (component) within an interaction network (community). The blue and red lines show positive and negative effects between the components, respectively. Each interaction network was different depending on the energy state. (c) Response to environmental ε. Dependencies on the developmental stage (gid) (X axis) and responsiveness to antibiotic treatment (gia) (Y axis) are plotted. Four categories are shown as Groups I-IV. The bacteria categorized within Group I had low population levels at 30–60 d that increased after with antibiotic treatment. Those within Group II had high population levels at 30–60 d that increased with antibiotic treatment. Those within Group III had low population levels at 30–60 d that decreased with antibiotic treatment. Those within Group IV had high population levels at 30–60 d and/or an independent population at this stage, but the population levels decreased with antibiotic treatment. The black letters indicate the bacterial genera and the other physiological components selected by LDA and AA.
Figure 5
Figure 5
(a) The ELA interaction network shows the significant relationships in the extended pairwise maximum entropy model fitted to the observational data. Components were selected by linear discriminant analysis and association analysis. The bacteria selected by both analyses are underlined. The blue and red lines show positive and negative relationships, respectively. The abbreviations are as follows: E: family Erysipelotrichaceae; L: family Lachnospiraceae; GLU: serum glucose; NEFA: serum nonesterified free fatty acid; butyrate: fecal butyric acid; propionate: fecal propionic acid; T-Cho: serum total cholesterol. (b) The calculated causal relationship of the components strongly linked with butyrate is visualized by linear non-Gaussian acyclic model (DirectLiNGAM) analysis. The amounts of change (d 3, 30, and 60) with respect to the values at d 3 of the components aligned with butyrate (green letters) (a) were used for the calculation. The arrow shows the trend of the causal relationship. The number shows the value of the causal contribution calculated by the DirectLiNGAM analysis. The minus and plus values show negative and positive causal contributions, respectively.

References

    1. Moore PR, Evenson A, et al. Use of sulfasuxidine, streptothricin, and streptomycin in nutritional studies with the chick. J. Biol. Chem. 1946;165:437–441. doi: 10.1016/S0021-9258(17)41154-9. - DOI - PubMed
    1. Cromwell GL. Why and how antibiotics are used in swine production. Anim. Biotechnol. 2002;13:7–27. doi: 10.1081/ABIO-120005767. - DOI - PubMed
    1. Barlow GM, Yu A, Mathur R. Role of the gut microbiome in obesity and diabetes mellitus. Nutr. Clin. Pract. 2015;30:787–797. doi: 10.1177/0884533615609896. - DOI - PubMed
    1. Bartley EE, Fountaine FC, Atkeson FW, Fryer HC. Antibiotics in dairy cattle nutrition. I. The effect of an aureomycin product (Aurofac) on the growth and well-being of young dairy calves. J. Dairy Sci. 1953;36:103–111. doi: 10.3168/jds.S0022-0302(53)91466-0. - DOI
    1. Woolhouse ME, Ward MJ. Microbiology. Sources of antimicrobial resistance. Science. 2013;341:1460–1461. doi: 10.1126/science.1243444. - DOI - PubMed