. 2023 May;617(7959):139-146.
doi: 10.1038/s41586-023-05940-w. Epub 2023 Apr 19.

PI3Kβ controls immune evasion in PTEN-deficient breast tumours

Affiliations

PI3Kβ controls immune evasion in PTEN-deficient breast tumours

Johann S Bergholz et al. Nature. 2023 May.

Abstract

Loss of the PTEN tumour suppressor is one of the most common oncogenic drivers across all cancer types1. PTEN is the major negative regulator of PI3K signalling. The PI3Kβ isoform has been shown to play an important role in PTEN-deficient tumours, but the mechanisms underlying the importance of PI3Kβ activity remain elusive. Here, using a syngeneic genetically engineered mouse model of invasive breast cancer driven by ablation of both Pten and Trp53 (which encodes p53), we show that genetic inactivation of PI3Kβ led to a robust anti-tumour immune response that abrogated tumour growth in syngeneic immunocompetent mice, but not in immunodeficient mice. Mechanistically, PI3Kβ inactivation in the PTEN-null setting led to reduced STAT3 signalling and increased the expression of immune stimulatory molecules, thereby promoting anti-tumour immune responses. Pharmacological PI3Kβ inhibition also elicited anti-tumour immunity and synergized with immunotherapy to inhibit tumour growth. Mice with complete responses to the combined treatment displayed immune memory and rejected tumours upon re-challenge. Our findings demonstrate a molecular mechanism linking PTEN loss and STAT3 activation in cancer and suggest that PI3Kβ controls immune escape in PTEN-null tumours, providing a rationale for combining PI3Kβ inhibitors with immunotherapy for the treatment of PTEN-deficient breast cancer.


Conflict of interest statement

Competing interests

J.S.B. is a scientific consultant for Geode Therapeutics Inc. J.S.B., G.J.F., T.M.R. and J.J.Z. are co-inventors of DFCI 2180.001 (DFS-166.25) related to this work. Qiwei W. is a scientific consultant for Crimson Biopharm Inc. Qi W. is currently an employee at Geode Therapeutics Inc. S.P. is currently an employee at Takeda Pharmaceuticals. S.X. is currently an employee at HiFiBiO Therapeutics. T.V. is currently an employee at MarvelBiome Inc. G.J.F. has patents/pending royalties on the PD-1/PD-L1 pathway from Roche, Merck MSD, Bristol-Myers-Squibb, Merck KGA, Boehringer-Ingelheim, AstraZeneca, Dako, Leica, Mayo Clinic, Eli Lilly and Novartis. G.J.F. has served on advisory boards for Roche, Bristol-Myers-Squibb, Xios, Origimed, Triursus, iTeos, NextPoint, IgM, Jubilant, Trillium, IOME, Geode, Bright Peak, and GV20. G.J.F. has equity in Nextpoint, Triursus, Xios, iTeos, IgM, Trillium, Invaria, Geode, and GV20. H-J.K. is currently an employee at Genentech. A.K.S. has received compensation for consulting and/or SAB membership from Merck, Honeycomb Biotechnologies, Cellarity, Repertoire Immune Medicines, Hovione, Third Rock Ventures, Ochre Bio, FL82, Empress Therapeutics, Relation Therapeutics, Senda Biosciences, IntrECate biotherapeutics, Santa Ana Bio, and Dahlia Biosciences unrelated to this work. T.M.R. is a SAB member for Shiftbio and K2B Therapeutics and is a co-founder of Geode Therapeutics Inc. J.J.Z. is a co-founder and board director of Crimson Biotech Inc. and Geode Therapeutics Inc. All other authors declare no competing interests.

Figures

Extended Data Figure 1 |
Extended Data Figure 1 |. Characterization of breast cancer GEM models.
a, H&E staining of primary PP (n = 4), PPA (n = 3) and PPB (n = 4) tumors. Representative images shown. b, Genetic alterations in PTEN and TP53 in patient samples of PAM50 basal breast cancer from The Cancer Genome Atlas (TCGA). c-e, Characterization of PP, PPA and PPB primary tumor cells by western blotting (c) and RNA-Seq (d; n = 5 biological replicates for MMEC; n = 3 biological replicates for PP, PPA and PPB), compared to positive controls for PTEN (MCF7 and HCC1954) and Trp53 (mouse mammary epithelial cells; MMEC). Data in (d) presented as mean values and s.d. e, Tumor cells were treated with 1.0 μM pan-PI3K inhibitor (BKM-120), PI3Kα inhibitor (BYL719) or PI3Kβ inhibitor (AZD6482) for one hour in complete growth media containing 10% FBS. Whole-cell lysates were analyzed by western blotting. Immunoblot representative of two independent experiments. f, Western blot analysis of primary tumor cells. Immunoblot representative of three independent experiments. g, H&E staining of transplanted tumors or remaining tumor bed from nude and FVB mice. Scale bars = 100 μm. Representative images shown (nude; PP, n = 8 tumors; PPA and PPB, n = 4 tumors; FVB, n = 8 tumors per group). h, Tumor-free survival of Rag1+/− (n = 4 mice) and Rag1−/− (n = 8 mice) FVB mice injected with PPB tumor cells. Statistical analysis by Log-rank (Mantel-Cox) test. i-k, PPB tumor cells were stably transfected with a vector control or mouse PI3Kβ. i, Western blot analysis. j, Tumor growth in immunocompetent syngeneic FVB mice (n = 5 tumors per group). Data presented as mean values and s.e.m. k, Tumors after necropsy. l, PPB tumor volume after transplanting into FVB mice treated with or without CD4 or CD8 depleting antibodies (n = 10 tumors per group). Inset shows magnified view of early time points. Data presented as mean values and s.e.m. Apparent molecular weights in kDa are indicated for immunoblots.
Extended Data Figure 2 |
Extended Data Figure 2 |. PPB tumor cells exhibit reduced levels of proliferation in vitro and in vivo.
a, Cell proliferation in vitro under reduced serum/nutrient conditions. Data shown as mean and s.d. (n = 6 biological replicates per condition). b-c, Analysis of GFP-tagged PP, PPA and PPB tumors harvested five days after tumor cell transplantation into nude mice. Representative sections (b) and quantification (c) are shown (n = 6 tumors for PP and PPB; n = 3 tumors for PPA). GFP was added via lentiviral transduction in vitro prior to transplantations. Scale bars: 100 μm (left) and 50 μm (right). Box plots represent median and inter-quartile range, and min-to-max error bars (whiskers). For comparison of multiple mean values (a and c), one-way ANOVA followed by Tukey’s multiple comparisons tests.
Extended Data Figure 3 |
Extended Data Figure 3 |. Single-cell RNA-Seq analysis of immune infiltrate in PTEN/p53-null breast tumors with catalytic isoform-specific PI3K deletion.
Single-cell RNA-Seq (scRNA-Seq) analysis of immune infiltrate from PP, PPA and PPB tumors (n = 3 mice per group). Tumors were harvested and dissociated into single cells, followed by FACS sorting for viable immune (CD45+) cells prior to scRNA-Seq analysis via Seq-Well technology. a, Heatmap showing gene expression for top 10% differentially-expressed genes (DEGs) for each cell type cluster. Selected genes for each cluster are indicated on the right. Genotype of the tumor of origin is indicated on top. b, tSNE of all CD45+ cells analyzed denoting experimental replicate and cell type. c, Genotype representation per cell type. Complete list of DEGs per cell type is available in the source data linked to this article.
Extended Data Figure 4 |
Extended Data Figure 4 |. Single-cell RNA-Seq analysis of monocytes/macrophages cluster in PTEN/p53-null breast tumors with catalytic isoform-specific PI3K deletion.
Single-cell RNA-Seq analysis of monocytes/macrophages (MoMϕ) cluster from PP, PPA and PPB tumors (n = 3 mice per group). a, Heatmap showing gene expression for top 10% differentially-expressed genes (DEGs) for each MoMϕ sub-cluster. Selected genes are indicated on the right. Genotype of the tumor of origin is indicated on top. b, tSNE of all MoMϕ analyzed denoting sub-cluster. c, MoMϕ sub-cluster representation per genotype. d, Genotype representation per MoMϕ sub-cluster. e, GSEA of MoMϕ sub-clusters. Statistical significance of enrichment scores (p-values) were calculated by GSEA using a phenotype-based permutation test. Complete list of DEGs per MoMϕ sub-cluster is available in the source data linked to this article.
Extended Data Figure 5 |
Extended Data Figure 5 |. Enhanced immune cell activation in PPB tumors.
a-g, Flow cytometry analysis of PP, PPA and PPB tumors harvested five days after tumor cell transplantation into FVB mice (n = 10 tumors per group). Box plots represent median and inter-quartile range, and min-to-max error bars (whiskers). Representative gating profiles to demonstrate that myeloid-derived IFNɣ is primarily produced by inflammatory monocytes are shown on (f). h, PP, PPA and PPB tumor cells were treated with 100 ng/mL IFNɣ in vitro for 48 hours. MHC class I (MHC-I) expression was analyzed by flow cytometry (n = 3 biological replicates per condition). Data shown as median and min-to-max error bars. i, PP, PPA and PPB tumor cells were treated with IFNɣ in vitro for 72 hours. Cell viability was analyzed by CellTiter-Glo. Data shown as mean values and s.d. (n = 4 biological replicates per condition). For comparison of two means (h), unpaired, two-tail t-test with Welch’s correction assuming unequal variance. For multiple comparisons (a-e, g and i), one-way ANOVA followed by Tukey’s multiple comparisons tests. Flow cytometry gating profiles available on SI Fig. S1.
Extended Data Figure 6 |
Extended Data Figure 6 |. PPB tumor cells enhance immune cell activation ex vivo, and show enhanced inflammatory signaling and reduced STAT3 pathway activation.
a-d, Flow cytometry analyses of immune cells from co-culture experiments ex vivo. a, Analysis of bone marrow-derived cells (BMCs) co-cultured with tumor cells (n = 5 biological replicates per group). b, Analysis of bone marrow-derived dendritic cells (BMDCs) co-cultured with tumor cells (n = 4 biological replicates per group). c, Analysis of CD8+ T-cells co-cultured with tumor cells (n = 4 biological replicates per group). d, Analysis of CD8+ T-cells co-cultured with dendritic cells (DCs) that had previously been co-cultured with tumor cells (n = 4 biological replicates per group). Box plots represent median and inter-quartile range, and min-to-max error bars (whiskers). Flow cytometry gating profiles available on SI Fig. S2. e, Heatmap of gene expression for immune-related genes in primary tumor cells (n = 3 biological replicates per group). f, Analysis by Q-PCR (left) and ELISA (right) of GM-CSF expression by PP and PPB cells. Data presented as mean values and s.d. (n = 3 biological replicates per group). g, Analysis by Q-PCR (left; n = 4 biological replicates per group) and ELISA (right; n = 3 biological replicates per group) of IL-6 expression by PP and PPB cells. Data presented as mean values and s.d. h-i, Immunofluorescence analysis of PP, PPA and PPB tumors harvested five days after tumor cell transplantation into FVB mice, including representative sections (h; n = 3 tumors per group) and quantification of STAT3Y705 phosphorylation in tumor cells as assessed by fluorescence intensity (i). Results correspond to further analysis of samples in Fig. 2a. Tumor cells show positive P-AKT staining (red color). Blue and red-lined arrows point to examples of PP and PPA tumor cells with high P-STAT3. Green-lined arrows point to PPB tumor cell clusters highlighted with white dashed line. For comparison of two means (a-g), unpaired, two-tail t-test with Welch’s correction assuming unequal variance. OD, optical density; TNF, tumor necrosis factor; TLR, toll-like receptor.
Extended Data Figure 7 |
Extended Data Figure 7 |. The PI3Kβ-STAT3 pathway mediates immune suppressive signaling in PTEN/p53-null breast tumor cells.
a-d, Analysis of PPB cells stably expressing an empty vector control (vector) or constitutively-active STAT3A661C, N663C (STAT3-CA) by western blotting (a), gene expression (b; n = 3 biological replicates per group), GSEA (c; n = 3 biological replicates per group), and ELISA (d; n = 3 biological replicates per group). e, Flow cytometry analysis of dendritic cells (DCs) co-cultured with tumor cells (n = 4 biological replicates per group). f-i, Analysis of PP cells transduced with shRNA against GFP (shGFP) or Stat3 (shStat3; two independent constructs) by western blotting (f), gene expression (g; n = 3 biological replicates per group), GSEA (h; n = 3 biological replicates per group), and ELISA (i; n = 3 per group). j, Flow cytometry analysis of DCs co-cultured with tumor cells (n = 8 biological replicates per group). k, Tumor volume after transplantation into immunodeficient mice (nude; n = 10 tumors per group) or syngeneic immunocompetent mice (FVB; n = 8 tumors for PP-shGFP and PP-shStat3(1); n = 6 tumors for PP-shStat3(2)). Data presented as mean values and s.e.m. l, Flow cytometry analysis of immune infiltrate after tumor transplantation into FVB mice. Apparent molecular weights in kDa are indicated for immunoblots. Data on (b), (d), (g) and (i) are presented as mean values and s.d. Box plots represent median and inter-quartile range, and min-to-max error bars (whiskers). For comparison of two means (b, d-e), unpaired, two-tail t-test with Welch’s correction assuming unequal variance. For multiple comparisons (g, i, j and l), one-way ANOVA followed by Tukey’s multiple comparisons tests. Flow cytometry gating profiles available on SI Fig. S4. CR, complete regression.
Extended Data Figure 8 |
Extended Data Figure 8 |. PI3Kβ regulates STAT3 signaling via TEC Family Kinase BMX.
a, Western blot analysis of PP cells treated with AZD6482 or DMSO as a control in complete growth media or under serum/nutrient starvation conditions. Immunoblot representative of two independent experiments. b-c, Analysis of PP cells treated with AZD6482 under serum/nutrient starvation by gene expression (b; n = 3 biological replicates per condition), and Q-PCR (GM-CSF, n = 3 biological replicates per group; IL-6, n = 4 biological replicates per group) and ELISA (GM-CSF, n = 4 biological replicates per group; IL-6, n = 6 biological replicates per group) (c). For comparison of two means, unpaired, two-tail t-test with Welch’s correction assuming unequal variance. Data in (c) presented as mean values and s.d. d, PP tumor-bearing nude mice were treated with a vehicle control or AZD6482. RNA from isolated tumor cells was analyzed by RNA-Seq. Results from GSEA for AZD6482 compared to vehicle are shown (n = 3 tumors per group). e, Western blot analysis of PTEN-deficient human breast cancer cells treated with AZD6482 or DMSO as a control under reduced nutrient/serum conditions. Immunoblots representative of two biological replicates per condition. f, Immunohistochemistry analysis of HCC70 xenografts from nude mice treated with AZD6482 or a vehicle control. Representative images shown (n = 5 tumors per condition). Scale bars = 100 μm and 50 μm (inset). g-i, Western blot analysis of PP cells treated with the AKT inhibitor MK2206 (g), the TEC Kinase family inhibitor LFM-A13 (h) or the BMX inhibitor BMX-IN-1 (i) under serum/nutrient starvation conditions. Immunoblots representative of two independent experiments performed in duplicate. j, Molecular mechanisms working model. k, Summary of PDX models denoting PTEN genomic status and PTEN protein levels as assessed by IHC. Representative IHC sections are shown (n = 2 tumors per model). Scale bars, 300 μm. Apparent molecular weights in kDa are indicated for immunoblots.
Extended Data Figure 9 |
Extended Data Figure 9 |. PD-1 blockade potentiates anti-tumor immune response induced by PI3Kβ inhibition in PTEN-null mouse mammary tumors.
a-b, Flow cytometry analysis of tumor cells and immune infiltrate from PP (a) or HER2/Neu+ (b) tumors harvested from FVB mice treated with AZD6482 or a vehicle control (n = 10 tumors per condition). c, H&E stain of representative tumor samples from mice (Exp. 1) treated with vehicle (n = 8) or combined AZD6482 and PD-1 blockade (αPD-1), including cases showing complete response (CR; n = 3) and delayed progressive disease (PD; n = 3). Scale bars = 100 μm. d-f, Flow cytometry analysis of tumor cells and immune infiltrate from PP tumor-bearing FVB mice treated with AZD6482 or αPD-1 as single agents or in combination (n = 10 tumors per group). Box plots represent median and inter-quartile range, and min-to-max error bars (whiskers). For comparison of two means (a-b), unpaired, two-tail t-test with Welch’s correction assuming unequal variance. For multiple comparisons (d-f), one-way ANOVA followed by Tukey’s multiple comparisons tests. g-h, RNA from bulk PP tumor fragments was analyzed by RNA-Seq (n = 6 per group). Results from GSEA compared to the vehicle control (g) and heatmap denoting expression of immune-related genes (h) are shown. Flow cytometry gating profiles available on SI Fig. S5–S6. MFI, mean fluorescence intensity; IFN, interferon; NES, normalized enrichment score; PRRs, pattern recognition receptors.
Extended Data Figure 10 |
Extended Data Figure 10 |. Mice with complete response to combined PI3Kβ inhibition and PD-1 blockade exhibit robust anti-tumor immunity to tumor re-challenge.
a-c, Flow cytometry analysis of tumor immune infiltrate (a; n = 12 tumors for naïve; n = 10 tumors for re-challenged), draining lymph nodes (b; n = 12 lymph nodes for naïve; n = 10 lymph nodes for re-challenged) and spleens (c; n = 6 spleens for naïve; n = 5 spleens for re-challenged) from age-matched FVB mice challenged for the first time (naïve; n = 6 mice) and in mice with complete response to combined treatment and challenged for a second time (re-challenged; n = 5 mice). Tissues were harvested two weeks after re-challenging. Box plots represent median and inter-quartile range, and min-to-max error bars (whiskers). For comparison of two means, unpaired, two-tail t-test with Welch’s correction assuming unequal variance. Flow cytometry gating profiles available on SI Fig. S7. MFI, mean fluorescence intensity; Tregs, regulatory T-cells.
Extended Data Figure 11 |
Extended Data Figure 11 |. PTEN loss sensitizes tumors to enhancement of anti-tumor immune response by pharmacological PI3Kβ-specific inhibition.
a, Western blot analysis of RCT-E302 mouse mammary tumor cells with deleted Pten (RCT-E302-sgPten) and parental RCT-E302 cells. b-c, Flow cytometry analysis of tumor cells and immune infiltrate from RCT-E302-sgPten (b) or RCT-E302 (c) tumors harvested from FVB mice treated with AZD6482 or a vehicle control (n = 10 tumors per group). d, Western blot analysis of BPP (Brca1/Trp53/Pten triple-null) and BP (Brca1/Trp53 double-null) mouse mammary tumor cells. e-f, Flow cytometry analysis of tumor cells and immune infiltrate from BPP (e) or BP (f) tumors harvested from FVB mice treated with AZD6482 or a vehicle control (n = 10 tumors per group). Apparent molecular weights in kDa are indicated for immunoblots. For comparison of two means (b-c and e-f), unpaired, two-tail t-test with Welch’s correction assuming unequal variance. Flow cytometry gating profiles available on SI Fig. S8.
Extended Data Figure 12 |
Extended Data Figure 12 |. Combined PI3Kβ inhibition and immunotherapy inhibit tumor growth in mouse models of PTEN-null breast cancer.
a-b, Tumor-bearing mice were treated with AZD6482 or a monoclonal antibody against mouse PD-1 (αPD-1) alone or in combination, as shown. Tumor growth curves (left panels) and tumor growth inhibition (TGI; right panels) are shown (n = 8 tumors for AZD6482 in (a); n = 10 tumors for other conditions in (a) and (b)). c, Western blot analysis of 4T1 mouse mammary tumor cells with deleted Pten (4T1-sgPten) and parental 4T1 cells. Image is representative of two independent immunoblots. Apparent molecular weights in kDa are indicated. d, Ratio of M2-like polarized (CD206High MHC-II-) to M1-like polarized (CD206- MHC-IIHigh) macrophages (CD11b+ F4/80+) as determined by flow cytometry (n = 10 tumors per group). e, 4T1-sgPten tumor-bearing mice were treated with AZD6482, αPD-1 or the STING agonist MSA2 alone or in combination. Tumor growth curves (left panels) and TGI (right panels) are each shown as two separate plots for clarity, with all plots including the same vehicle and AZD6482 groups for easier comparison (n = 8 tumors for MSA; n = 10 tumors for other conditions). Data for tumor growth curves presented as mean values and s.e.m. Box plots represent median and inter-quartile range, and min-to-max error bars (whiskers). For comparison of multiple mean values (a-b and d-e), one-way ANOVA followed by Tukey’s multiple comparisons tests. Statistical analysis on (e) was performed including all groups in the comparisons, with results shown in two different graphs for easier visual assessment. Flow cytometry gating profiles are available on Supplementary Information Fig. S9.
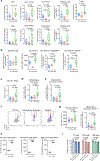
Figure 1 |
Figure 1 |. PI3Kβ is required for immune evasion in PTEN/p53-deficient invasive breast cancer.
a, Summary of genetically engineered mouse (GEM) models used in this study. b, Strategy for generating K14-Cre; PtenL/L; Trp53L/L (PP), K14-Cre; PtenL/L; Trp53L/L; Pik3caL/L (PPA) and K14-Cre; PtenL/L; Trp53L/L; Pik3cbL/L (PPB) mammary tumors from GEMs. c-e, PP, PPA and PPB tumor volume after transplanting into immunodeficient mice (nude; PP, n = 8 tumors; PPA and PPB, n = 4 tumors) or syngeneic immunocompetent mice (FVB; n = 8 tumors per group). Data presented as mean values and s.e.m.
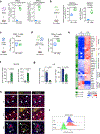
Figure 2 |
Figure 2 |. PI3Kβ mediates formation of an immunosuppressive microenvironment in PTEN/p53-null breast tumors.
a-i, Analysis of PP, PPA and PPB tumors harvested five days after tumor cell transplantation into FVB mice. a, H&E and immunofluorescence analysis of representative sections (n = 3 tumors per group). Tumor cells show positive P-AKT staining (red color). Arrows point to PPB tumor cell clusters. Scale bars, 500 μm (left) and 100 μm (right). b-f, Single-cell RNA-Seq analysis of the immune infiltrate (n = 3 mice per group). b, Global representation of all cells in the analysis, including tSNE plots denoting cell type and genotype of the tumor of origin, and cell type representation per genotype (stacked columns). c, Analysis of T-cell cluster, including heatmap showing gene expression for top 10% differentially-expressed genes (DEGs) for each sub-cluster with selected genes indicated on the right, tSNE of all T-cells analyzed denoting sub-cluster, and sub-cluster representation (absolute numbers of T-cells in analysis) per genotype (stacked columns). Complete list of DEGs per T-cell sub-cluster is available in the source data linked to this article. d, GSEA of T-cell sub-clusters. Statistical significance of enrichment scores (p-values) was calculated by GSEA using a phenotype-based permutation test. e-f, Analysis of classical dendritic cells (cDCs) from PPB tumors. e, Differential gene expression analysis. Statistical significance was calculated using a two-sided Wald test and adjusted for multiple testing using the Benjamini-Hochberg procedure. f, Ingenuity pathway analysis of DEGs. Statistical significance was calculated by a right-tailed Fisher’s Exact Test.
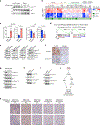
Figure 3 |
Figure 3 |. PI3Kβ mediates pro-tumor immune signaling in PTEN-deficient breast tumor cells in a STAT3-dependent manner.
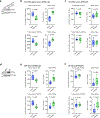
a, IPA of differentially-expressed genes (DEGs) in PPB compared to PP cells (n = 3 biological replicates per group) in vitro. b, GSEA of PPB compared to PP cells (n = 3 biological replicates per group) in vitro. c-d, Transcriptomic analysis of PP and PPB tumor cells obtained from tumors in vivo (n = 4 tumors per group). c, IPA of DEGs in PPB compared to PP tumor cells. d, GSEA of PPB tumor cells compared to PP. e-f, Western blot analysis of primary PP, PPA and PPB cells, including immunoblot image (e) and densitometry analysis of P-STAT3Y705 levels (f; n = 4 biological replicates per group with all samples run on the same immunoblot). Data on (f) presented as mean values and s.d. g, Flow cytometry analysis of GFP-tagged PP, PPA and PPB tumors harvested from FVB mice five days after inoculation. GFP was added via lentiviral transduction in vitro prior to transplantations. Box plots represent median and inter-quartile range, and min-to-max error bars (whiskers). h-i, Analysis of PP cells treated with AZD6482 in vitro under serum/nutrient starvation by western blotting (h) and GSEA (i; n = 3 biological replicates per group). Immunoblots representative of three (left) and two (right) independent experiments. Apparent molecular weights in kDa are indicated for immunoblots. Statistical significance for IPA on (a) and (c) was calculated by a right-tailed Fisher’s Exact Test. For comparison of multiple mean values (f-g), one-way ANOVA followed by Tukey’s multiple comparisons tests. Flow cytometry gating profiles available on SI Fig. S3. MFI, mean fluorescence intensity; NES, normalized enrichment score; WCL, whole-cell lysate.
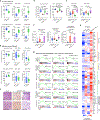
Figure 4 |
Figure 4 |. Identification of biomarkers of resistance to PI3Kβ inhibition-induced immunity in PTEN-deficient patient-derived xenografts (PDXs).
Mice bearing PTEN-deficient PDXs were treated with AZD6482 for four days. Tumors were harvested and snap-frozen for RNA-Seq analysis (n = 4 tumors per condition for each model). a, GSEA comparing AZD6482 treatment to the vehicle control for each individual model. Plots show up- or down-regulation for the AZD6482-treated condition. b, GSEA between PDX models (vehicles only). Statistical significance of enrichment scores (p-values) was calculated by GSEA using a phenotype-based permutation test. EMT, epithelial-to-mesenchymal transition; FGF, fibroblast growth factor; FGFR, FGF receptor; GO, gene ontology; IGF1R, insulin-like growth factor 1 receptor; MMPs, matrix metalloproteinases; NES, normalized enrichment score; OP, oncogenic pathways; RTKs, receptor tyrosine kinases; TGFβ, transforming growth factor β; WP, wikipathways
Figure 5 |
Figure 5 |. Combined PI3Kβ inhibition and PD-1 blockade synergize to inhibit PTEN/p53-null breast tumor growth.
a, PP tumor volume in FVB mice treated with BYL719, AZD6482 or a monoclonal antibody against mouse PD-1 (αPD-1) alone or in combination (Exp. 1). Data shown as growth curve for each individual tumor. Vehicle, n = 8; BYL719, n = 6; AZD6482, n = 10; αPD-1, n = 6; BYL719 + αPD-1, n = 6; AZD6482 + αPD-1, n = 6. b, Summary of response for multiple cohorts of mice treated with combined AZD6482 and αPD-1 (Exp. 1–4). Exp. 1, n = 6; Exp. 2, n = 6; Exp. 3, n = 10; Exp. 4, n = 8. c, Flow cytometry analysis of PP tumors treated with AZD6482 or αPD-1 as single agents or in combination for 4 days (n = 10 tumors per group). d, PP tumor growth in mice challenged for the first time (naïve; n = 10 tumors) and in mice with CR to combined treatment (re-challenged; n = 8 tumors). Data presented as mean values and s.e.m. e, Flow cytometry analysis of tumor immune infiltrate from an independent cohort of naïve and re-challenged mice. Tissues were harvested two weeks after re-challenging (naïve, n = 12 tumors; re-challenged, n = 10). Box plots represent median and inter-quartile range, and min-to-max error bars (whiskers). For comparison of two means (e), unpaired, two-tail t-test with Welch’s correction assuming unequal variance. For multiple comparisons (c), one-way ANOVA followed by Tukey’s multiple comparisons tests. Flow cytometry gating profiles available on SI Fig. S6–7. CR, complete response; PD, progressive disease; PR, partial response; SD, stable disease.

Comment in

Similar articles

Cited by

References

    1. Lawrence MS et al. Discovery and saturation analysis of cancer genes across 21 tumour types. Nature 505, 495–501, doi:10.1038/nature12912 (2014). - DOI - PMC - PubMed
    1. Dong Y et al. PTEN functions as a melanoma tumor suppressor by promoting host immune response. Oncogene 33, 4632–4642, doi:10.1038/onc.2013.409 (2014). - DOI - PubMed
    1. Li S et al. The tumor suppressor PTEN has a critical role in antiviral innate immunity. Nature immunology 17, 241–249, doi:10.1038/ni.3311 (2016). - DOI - PubMed
    1. George S et al. Loss of PTEN Is Associated with Resistance to Anti-PD-1 Checkpoint Blockade Therapy in Metastatic Uterine Leiomyosarcoma. Immunity 46, 197–204, doi:10.1016/j.immuni.2017.02.001 (2017). - DOI - PMC - PubMed
    1. Parsa AT et al. Loss of tumor suppressor PTEN function increases B7-H1 expression and immunoresistance in glioma. Nature medicine 13, 84–88, doi:10.1038/nm1517 (2007). - DOI - PubMed

Additional references

    1. Simond AM, Rao T, Zuo D, Zhao JJ & Muller WJ ErbB2-positive mammary tumors can escape PI3K-p110α loss through downregulation of the Pten tumor suppressor. Oncogene 36, 6059--6066, doi:10.1038/onc.2017.264 (2017). - DOI - PMC - PubMed
    1. Reardon DA et al. Glioblastoma Eradication Following Immune Checkpoint Blockade in an Orthotopic, Immunocompetent Model. Cancer Immunology Research 4, 124--135, doi:10.1158/2326-6066.cir-15-0151 (2016). - DOI - PubMed
    1. Palechor-Ceron N et al. Radiation induces diffusible feeder cell factor(s) that cooperate with ROCK inhibitor to conditionally reprogram and immortalize epithelial cells. The American journal of pathology 183, 1862–1870, doi:10.1016/j.ajpath.2013.08.009 (2013). - DOI - PMC - PubMed
    1. Takahashi K & Yamanaka S Induction of pluripotent stem cells from mouse embryonic and adult fibroblast cultures by defined factors. Cell 126, 663–676, doi:10.1016/j.cell.2006.07.024 (2006). - DOI - PubMed
    1. Lin J-R et al. Highly multiplexed immunofluorescence imaging of human tissues and tumors using t-CyCIF and conventional optical microscopes. eLife 7, doi:10.7554/eLife.31657 (2018). - DOI - PMC - PubMed

Publication types

MeSH terms

Substances