. 2023 May;617(7959):170-175.
doi: 10.1038/s41586-023-05959-z. Epub 2023 Apr 19.

Lesion recognition by XPC, TFIIH and XPA in DNA excision repair

Affiliations

Lesion recognition by XPC, TFIIH and XPA in DNA excision repair

Jinseok Kim et al. Nature. 2023 May.

Abstract

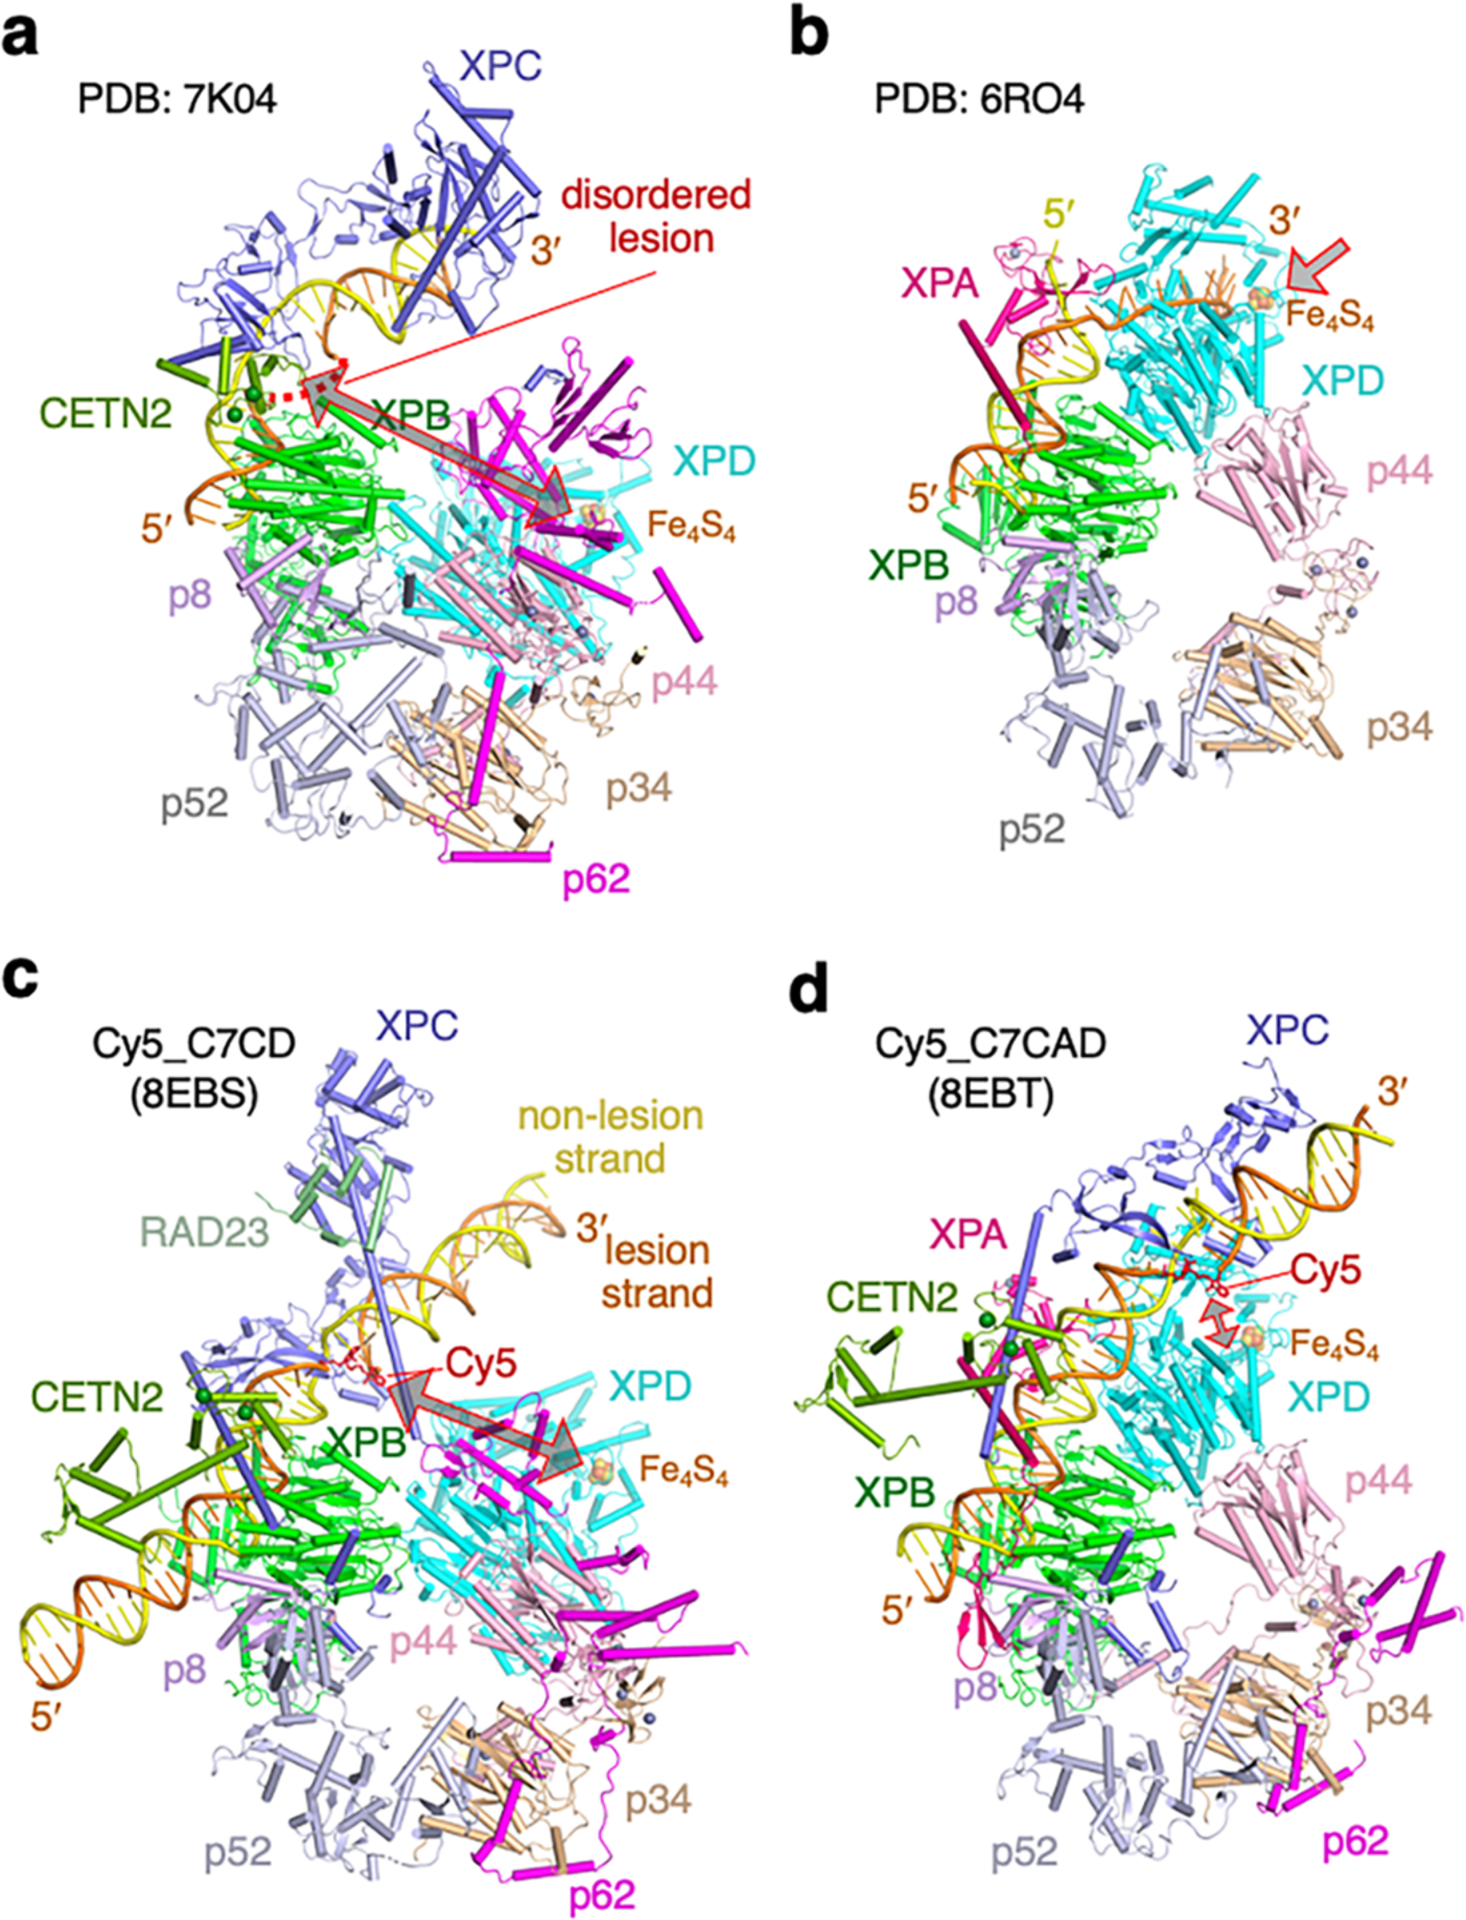
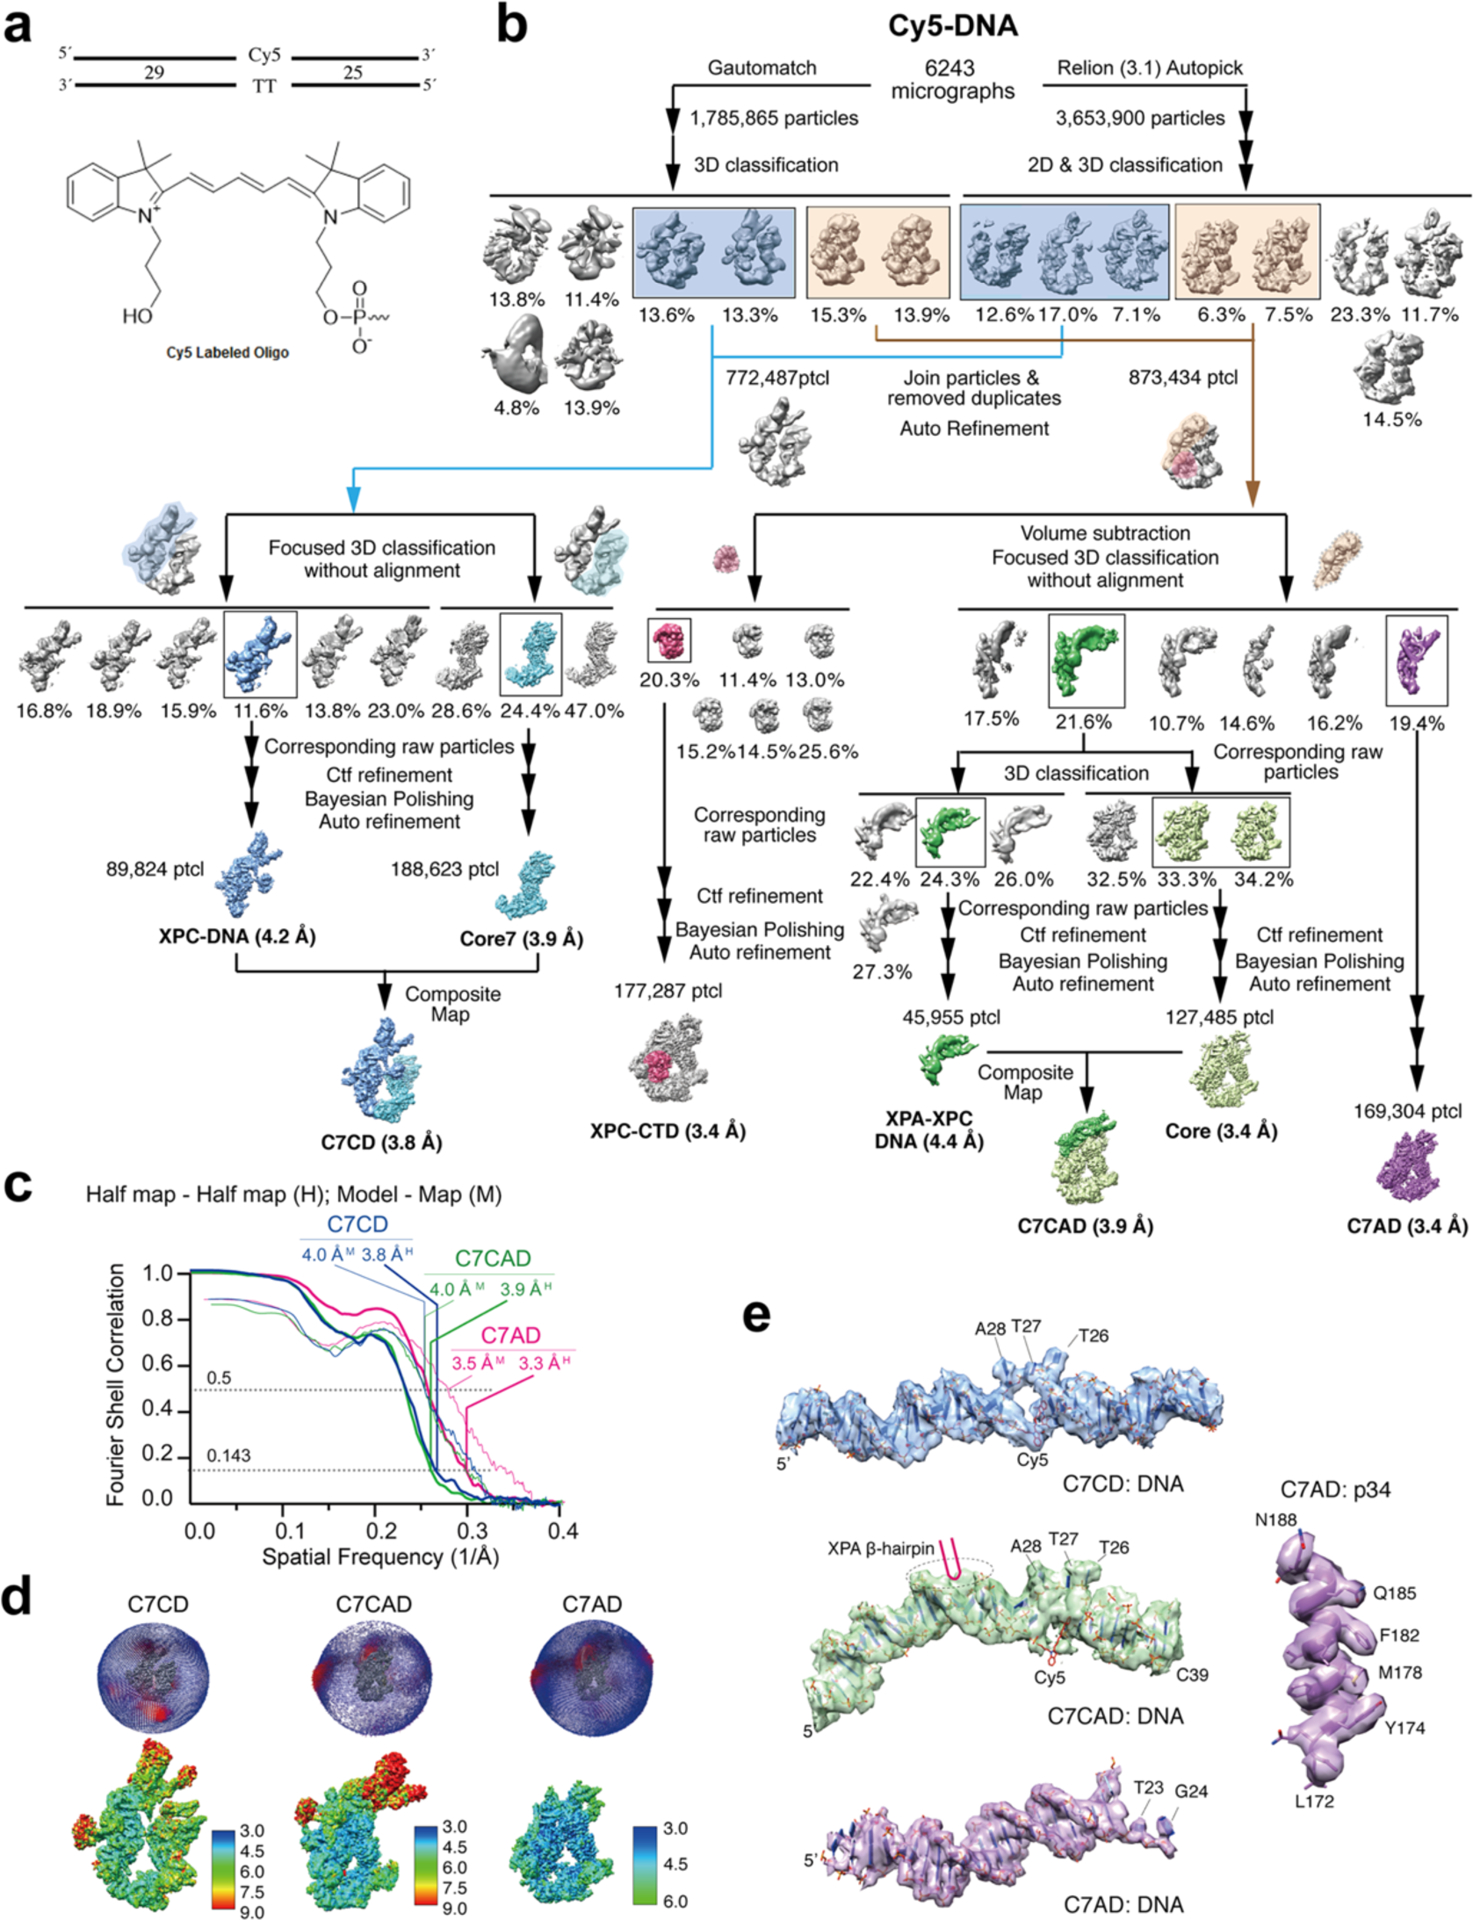
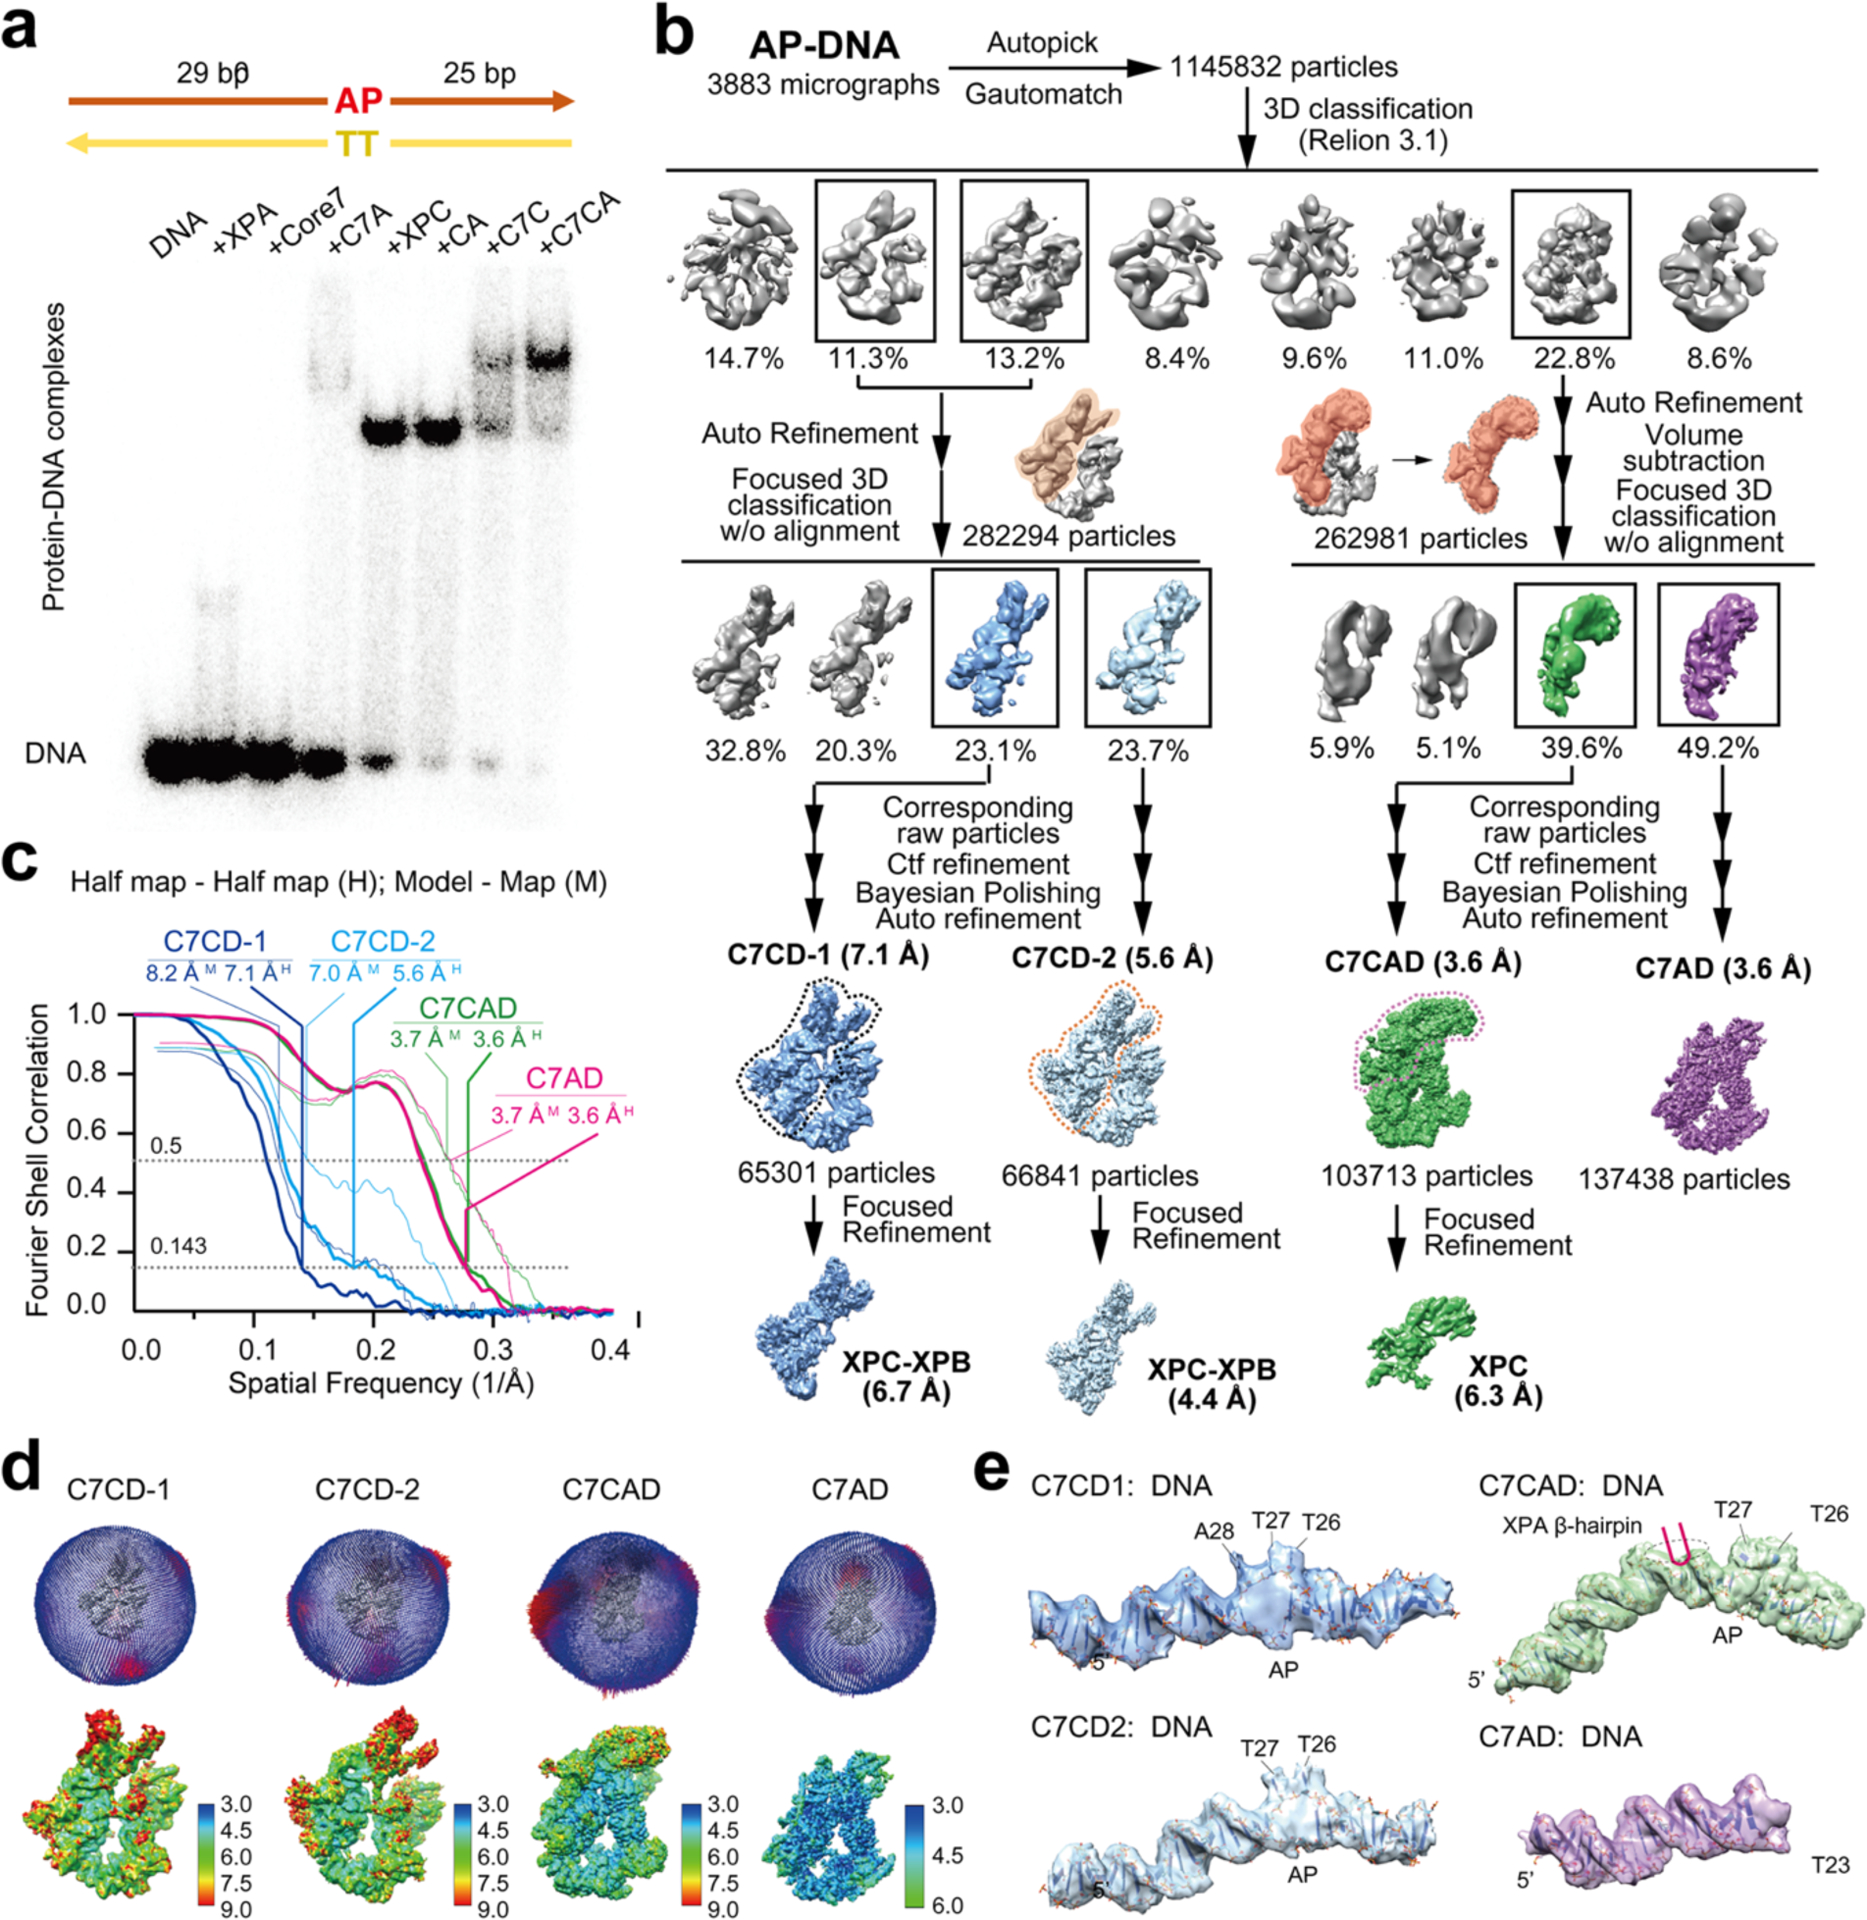
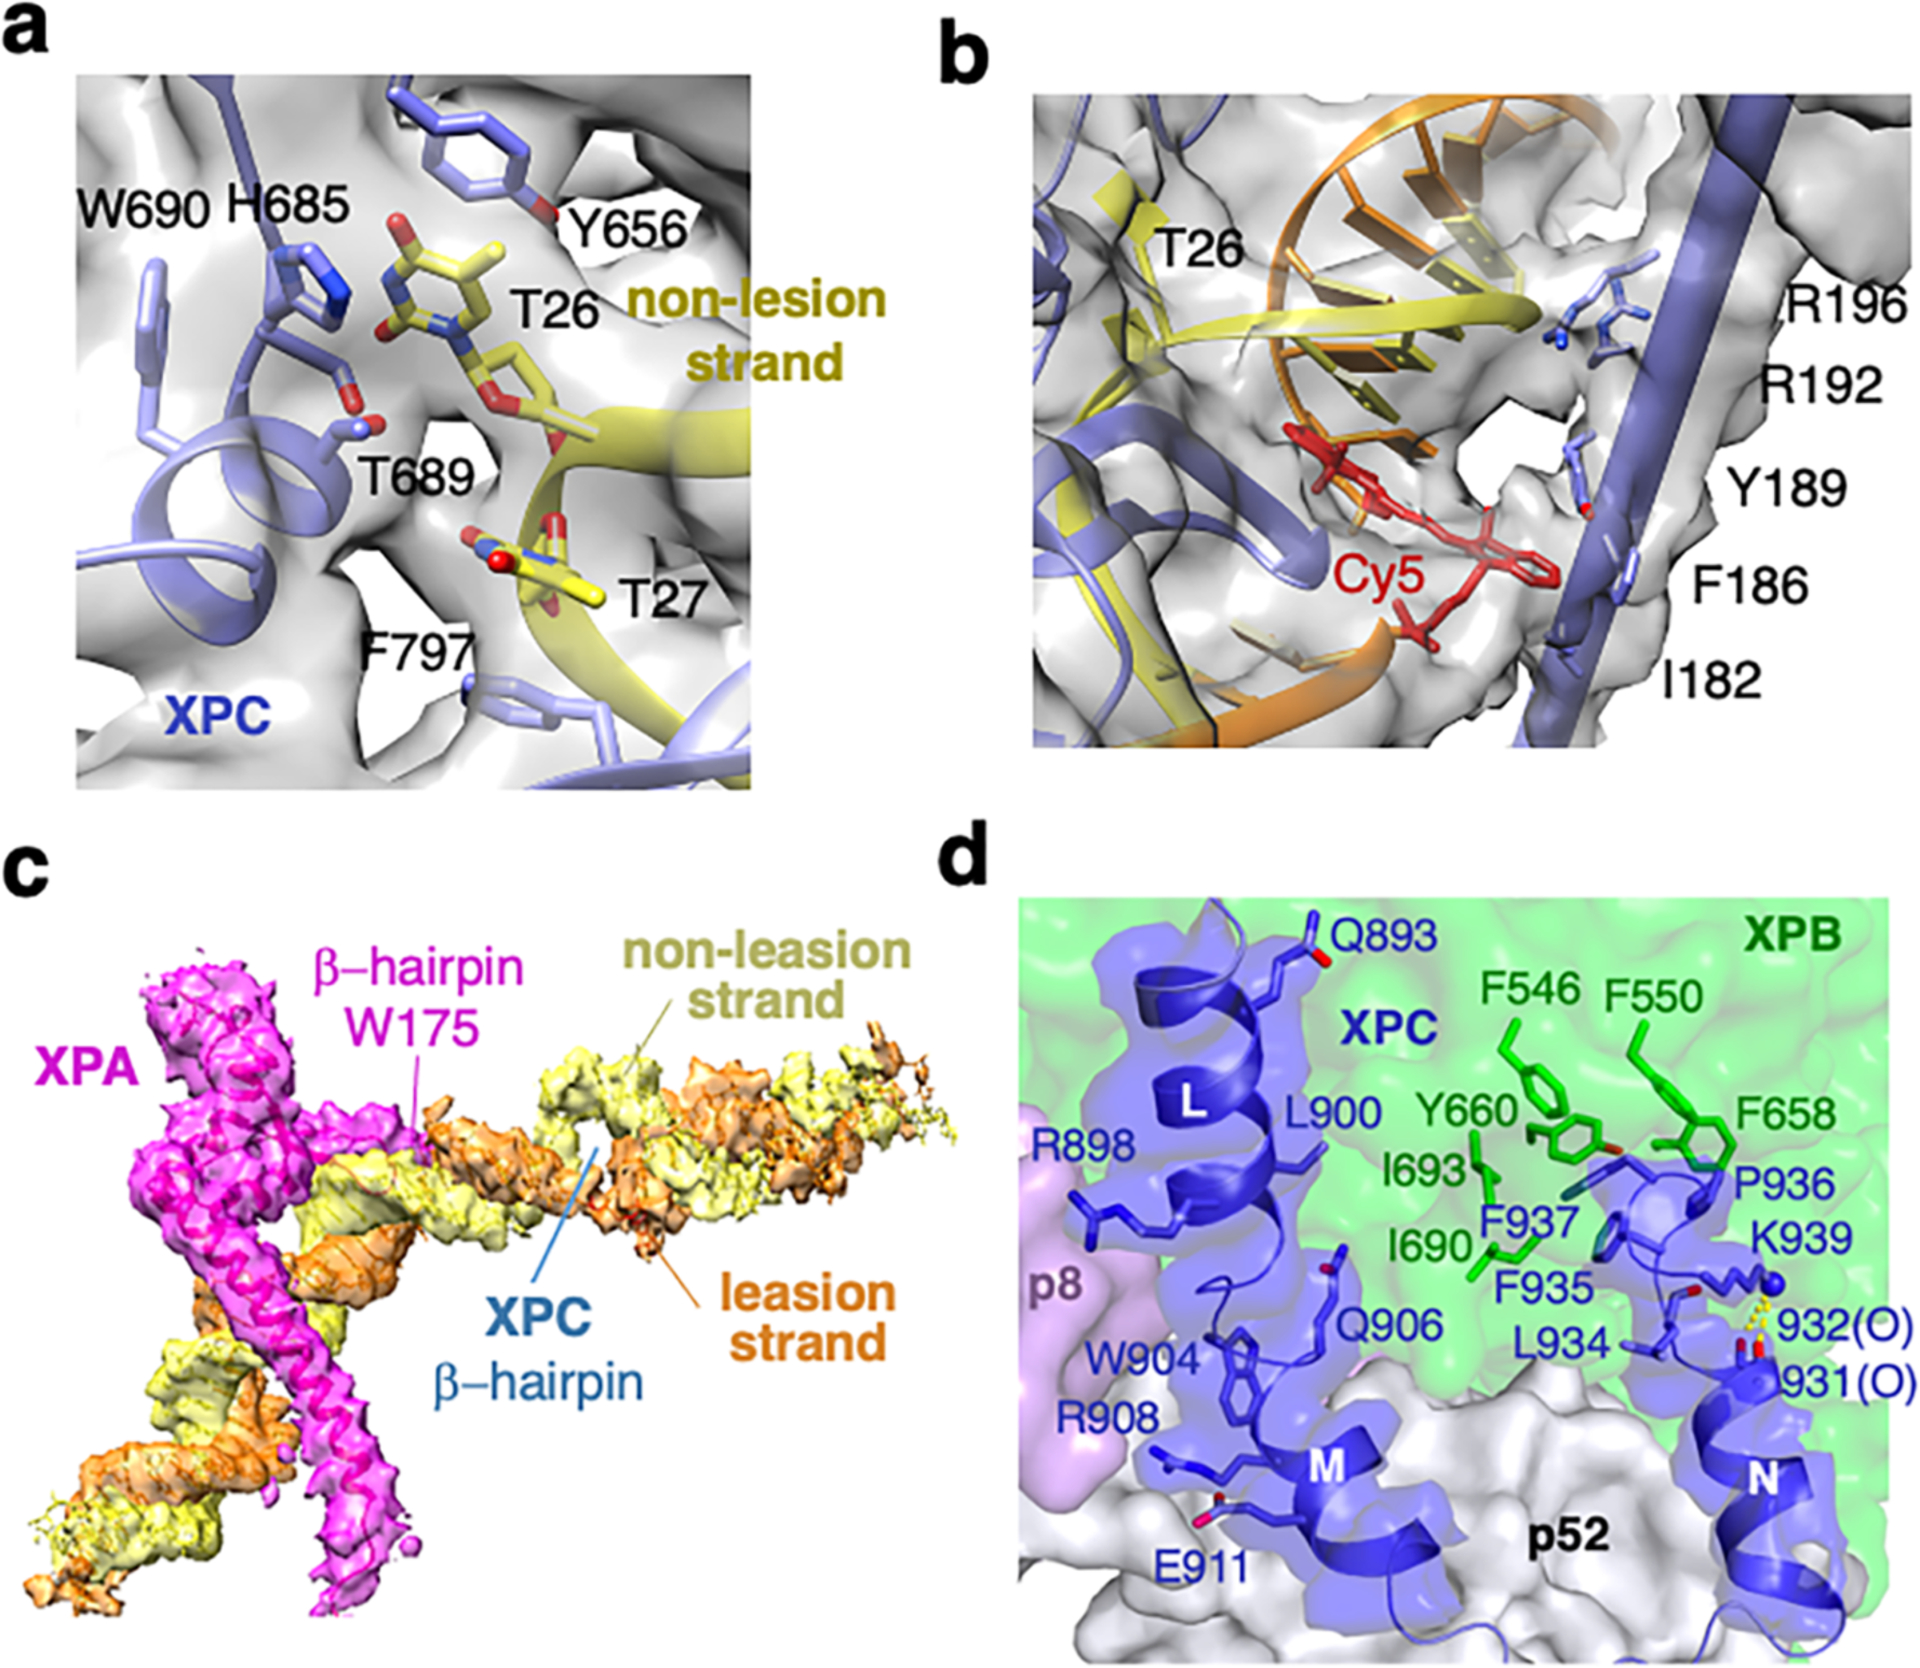
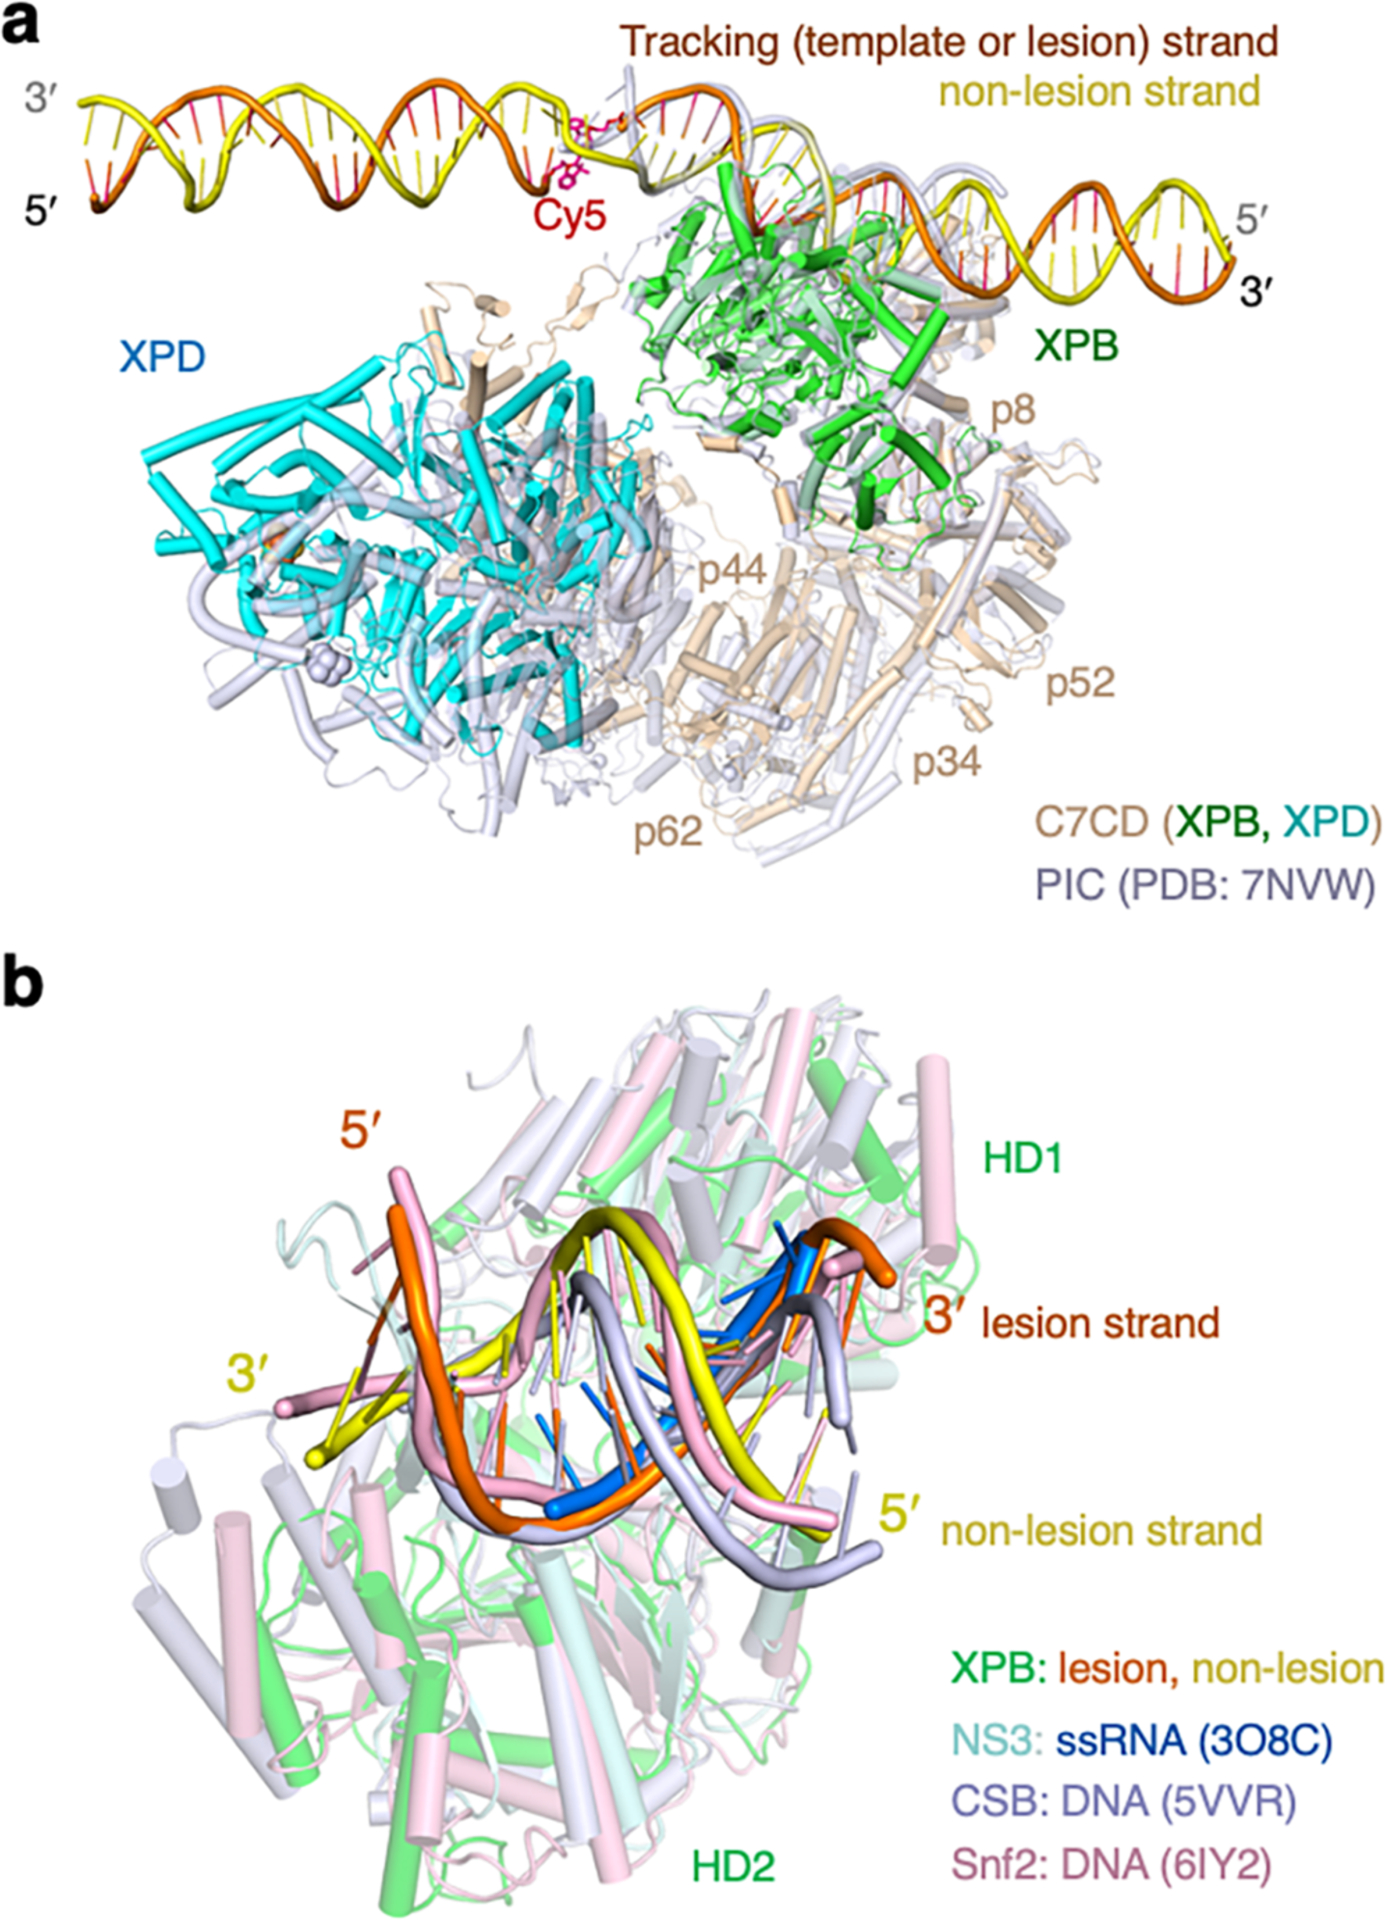
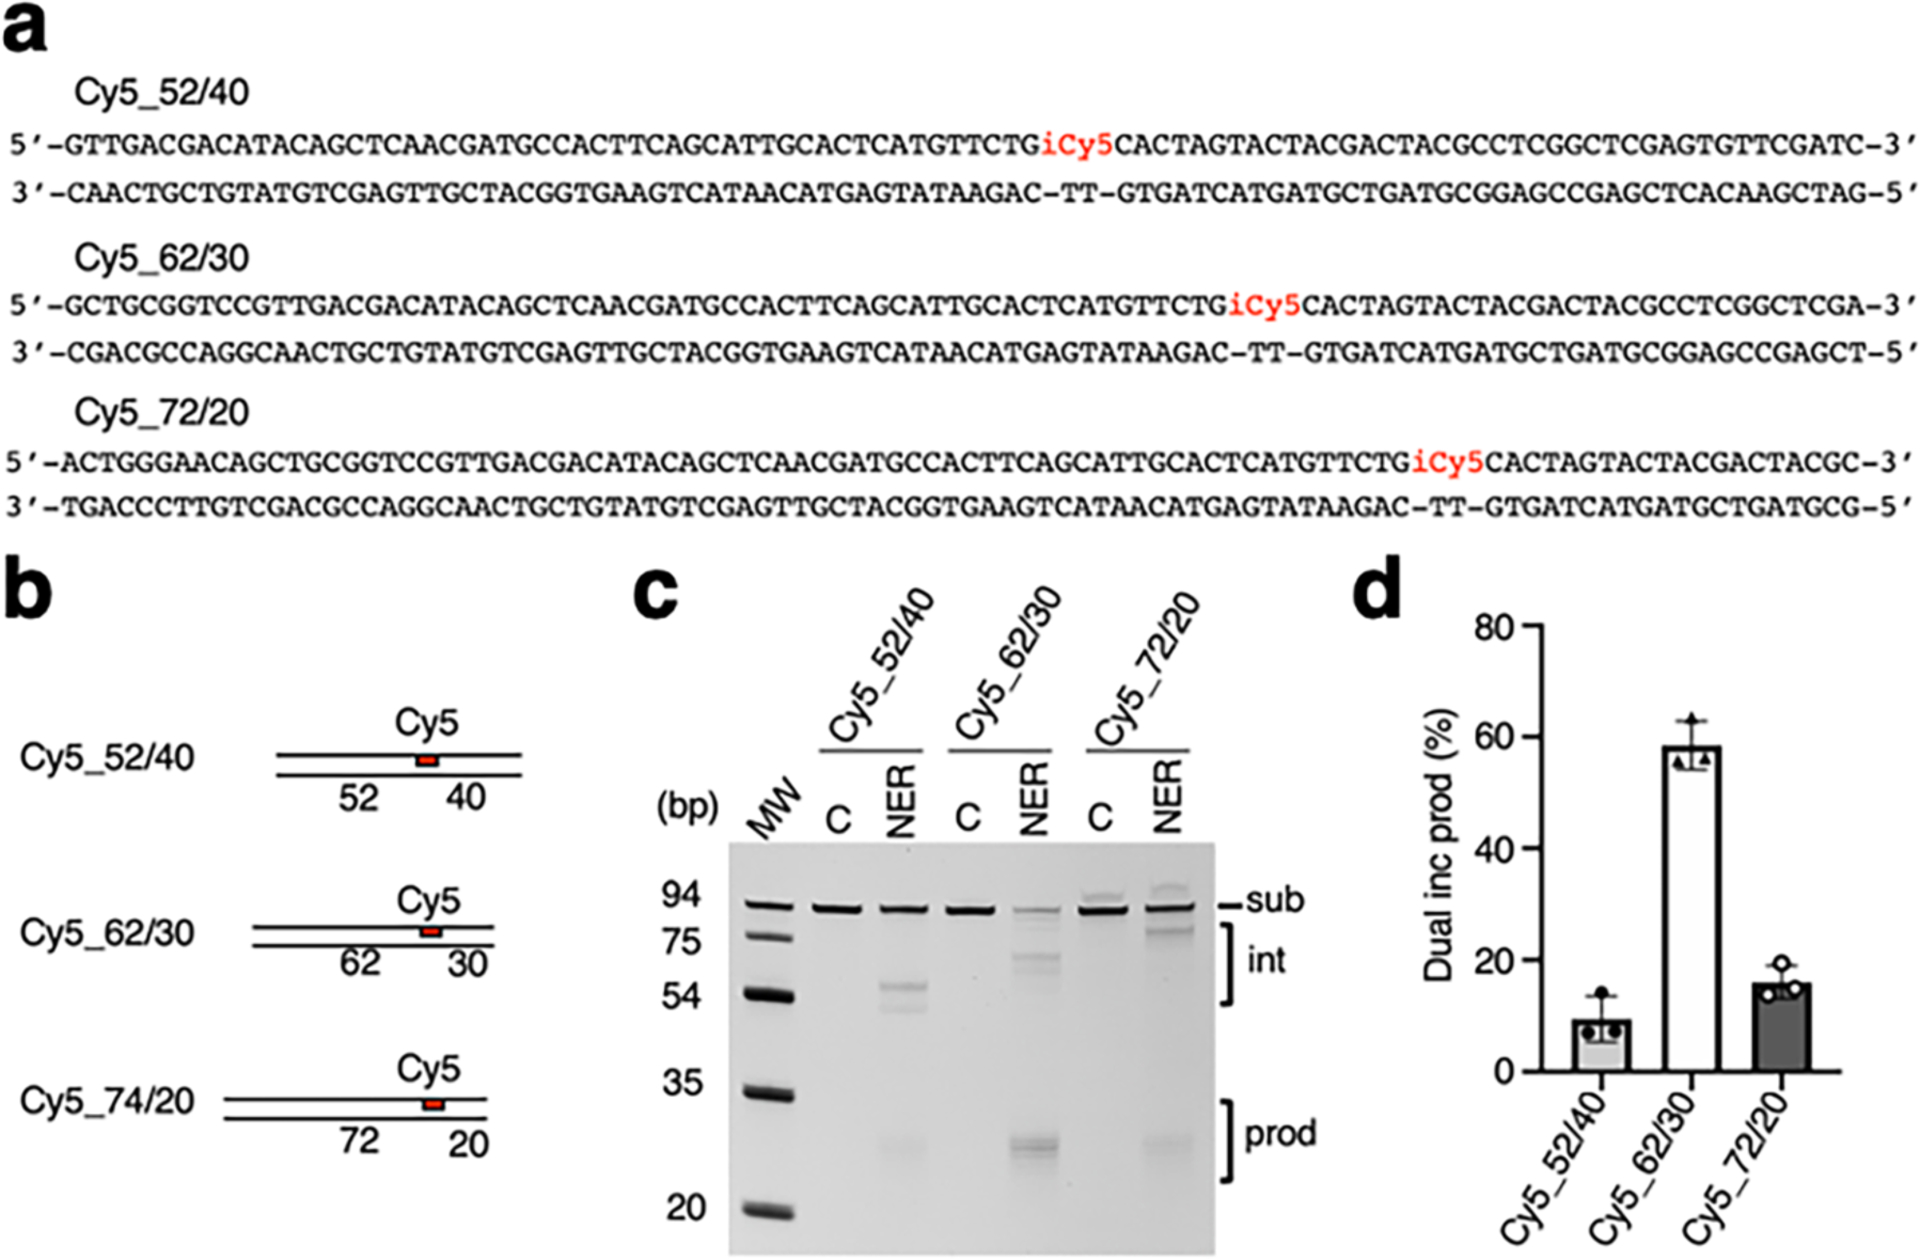
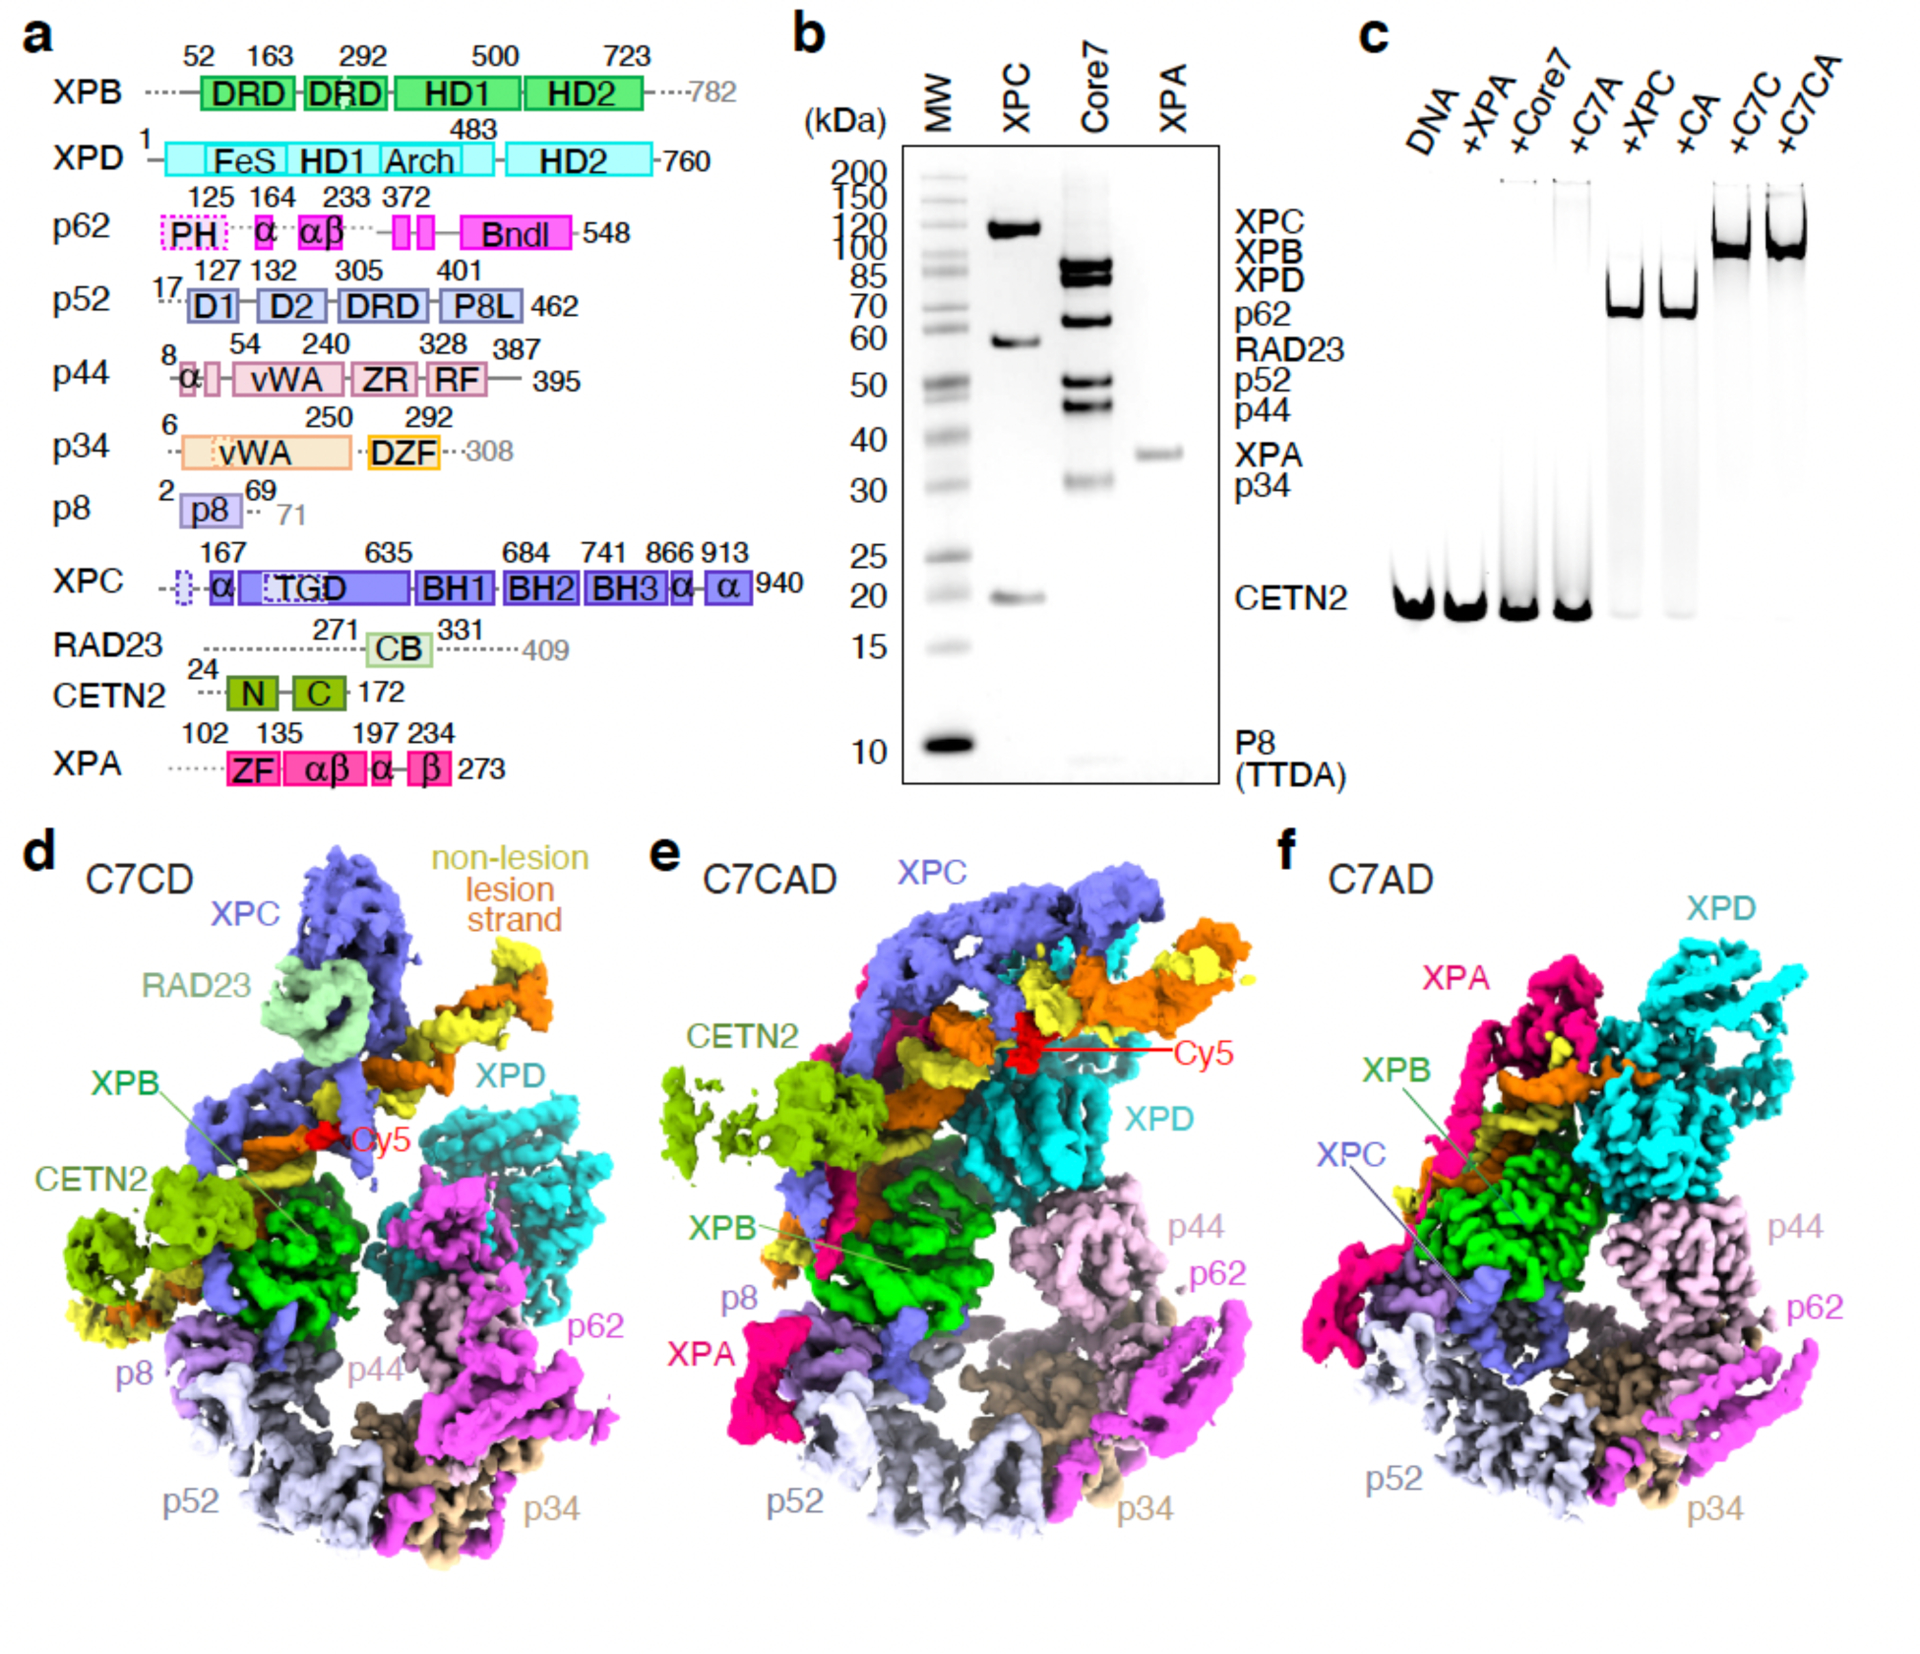
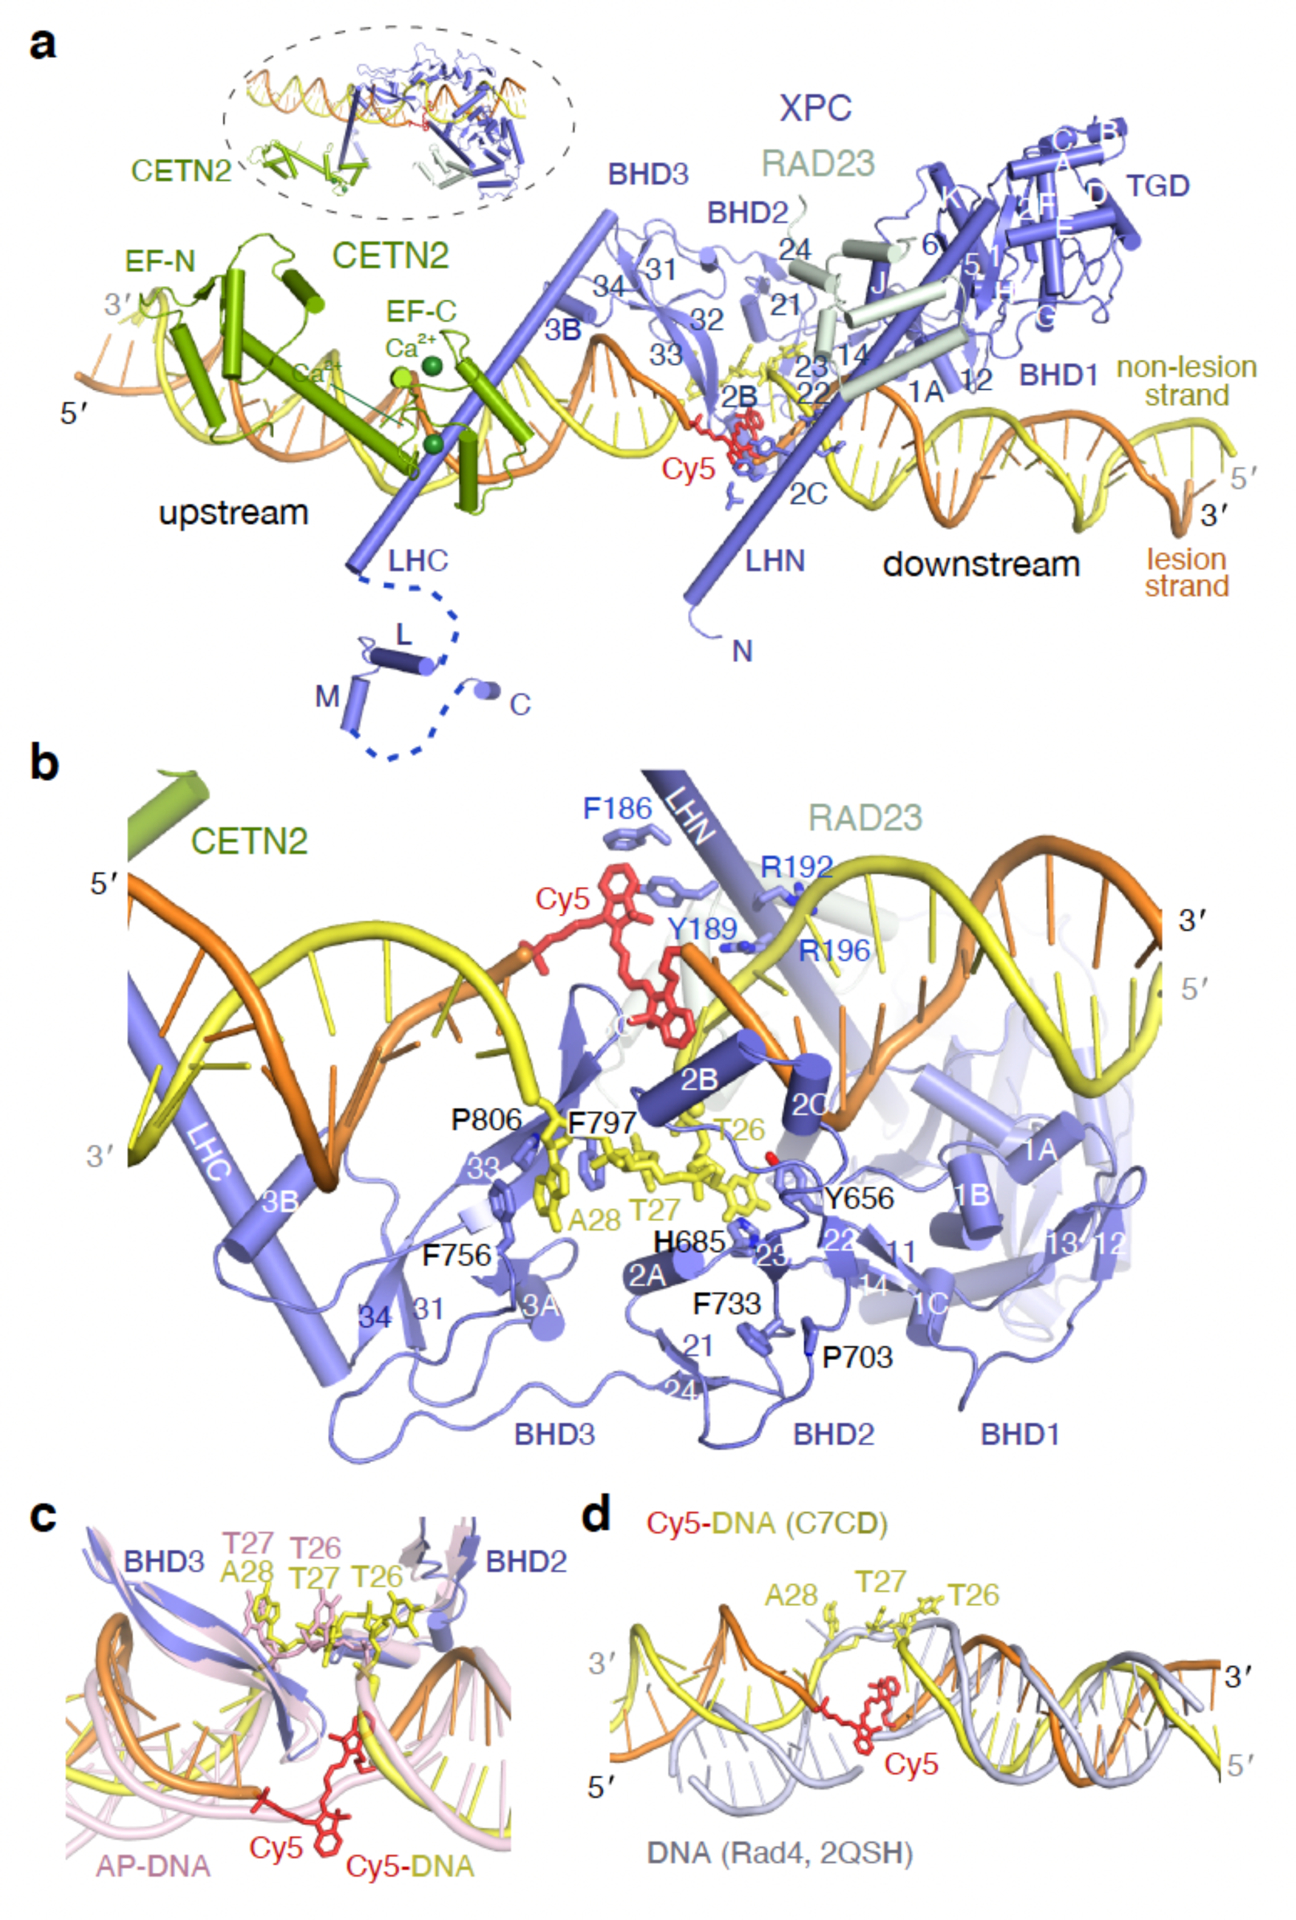
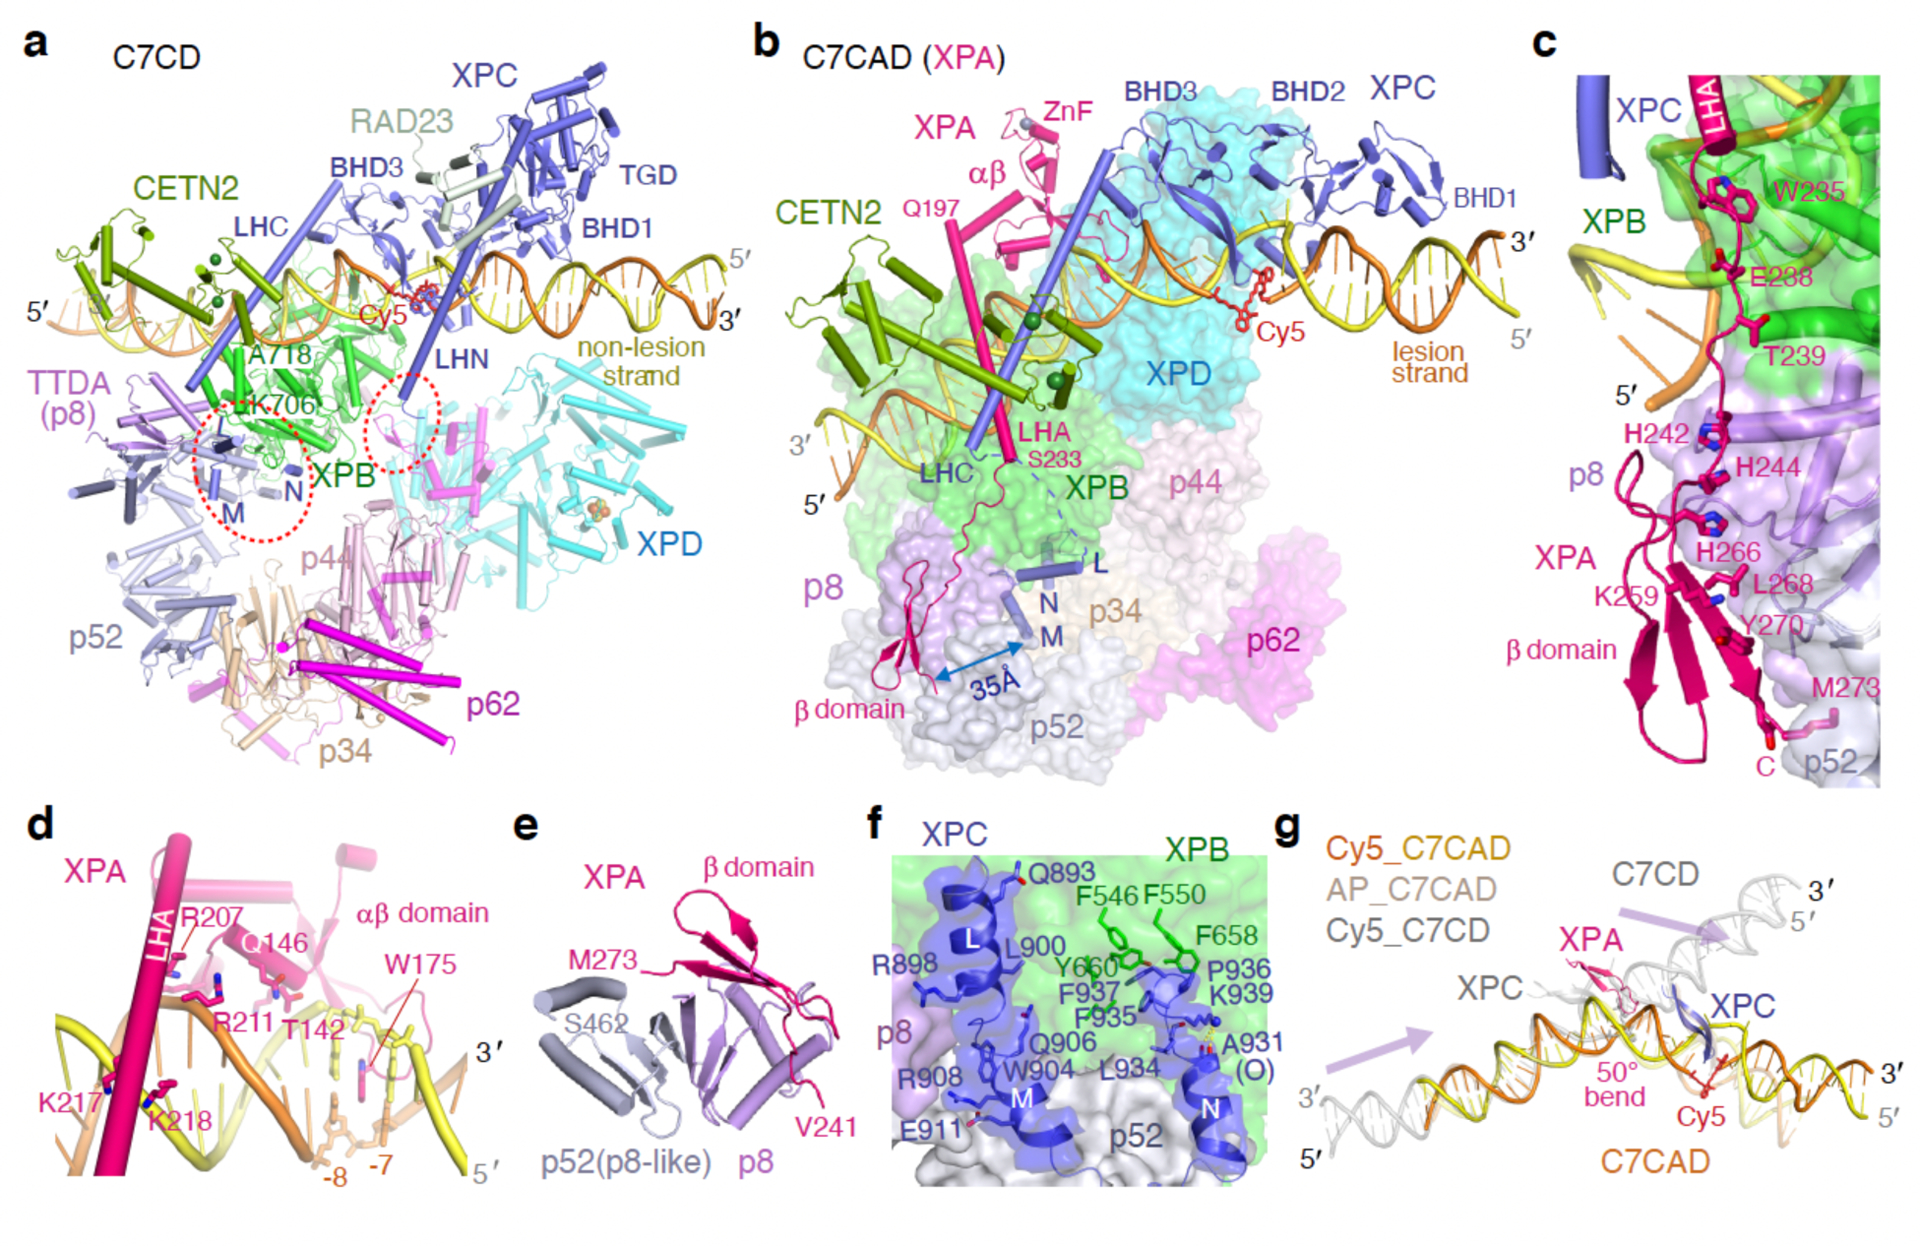
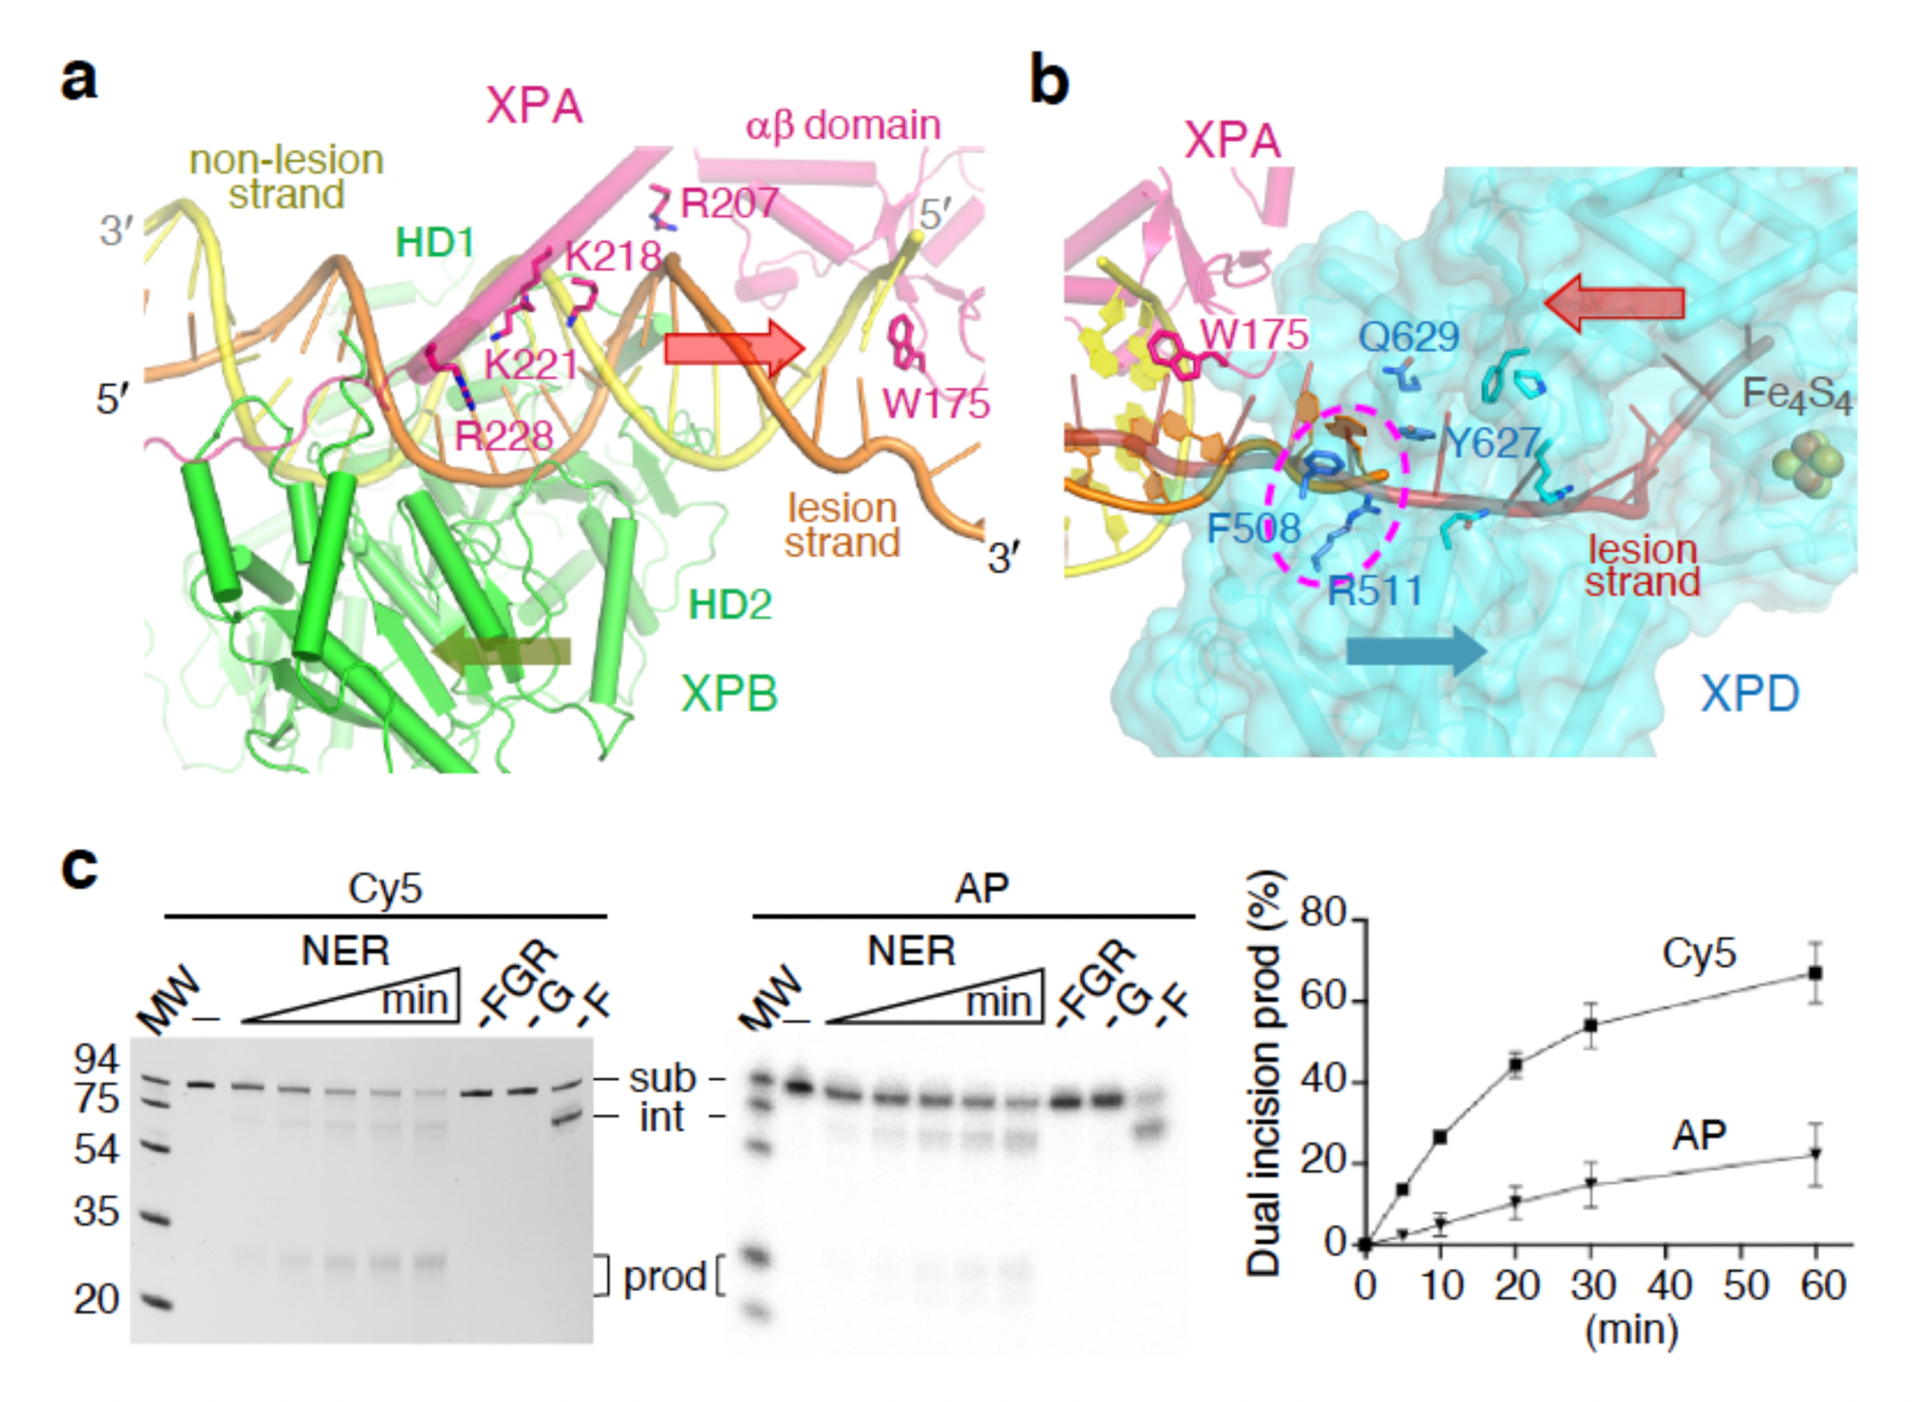
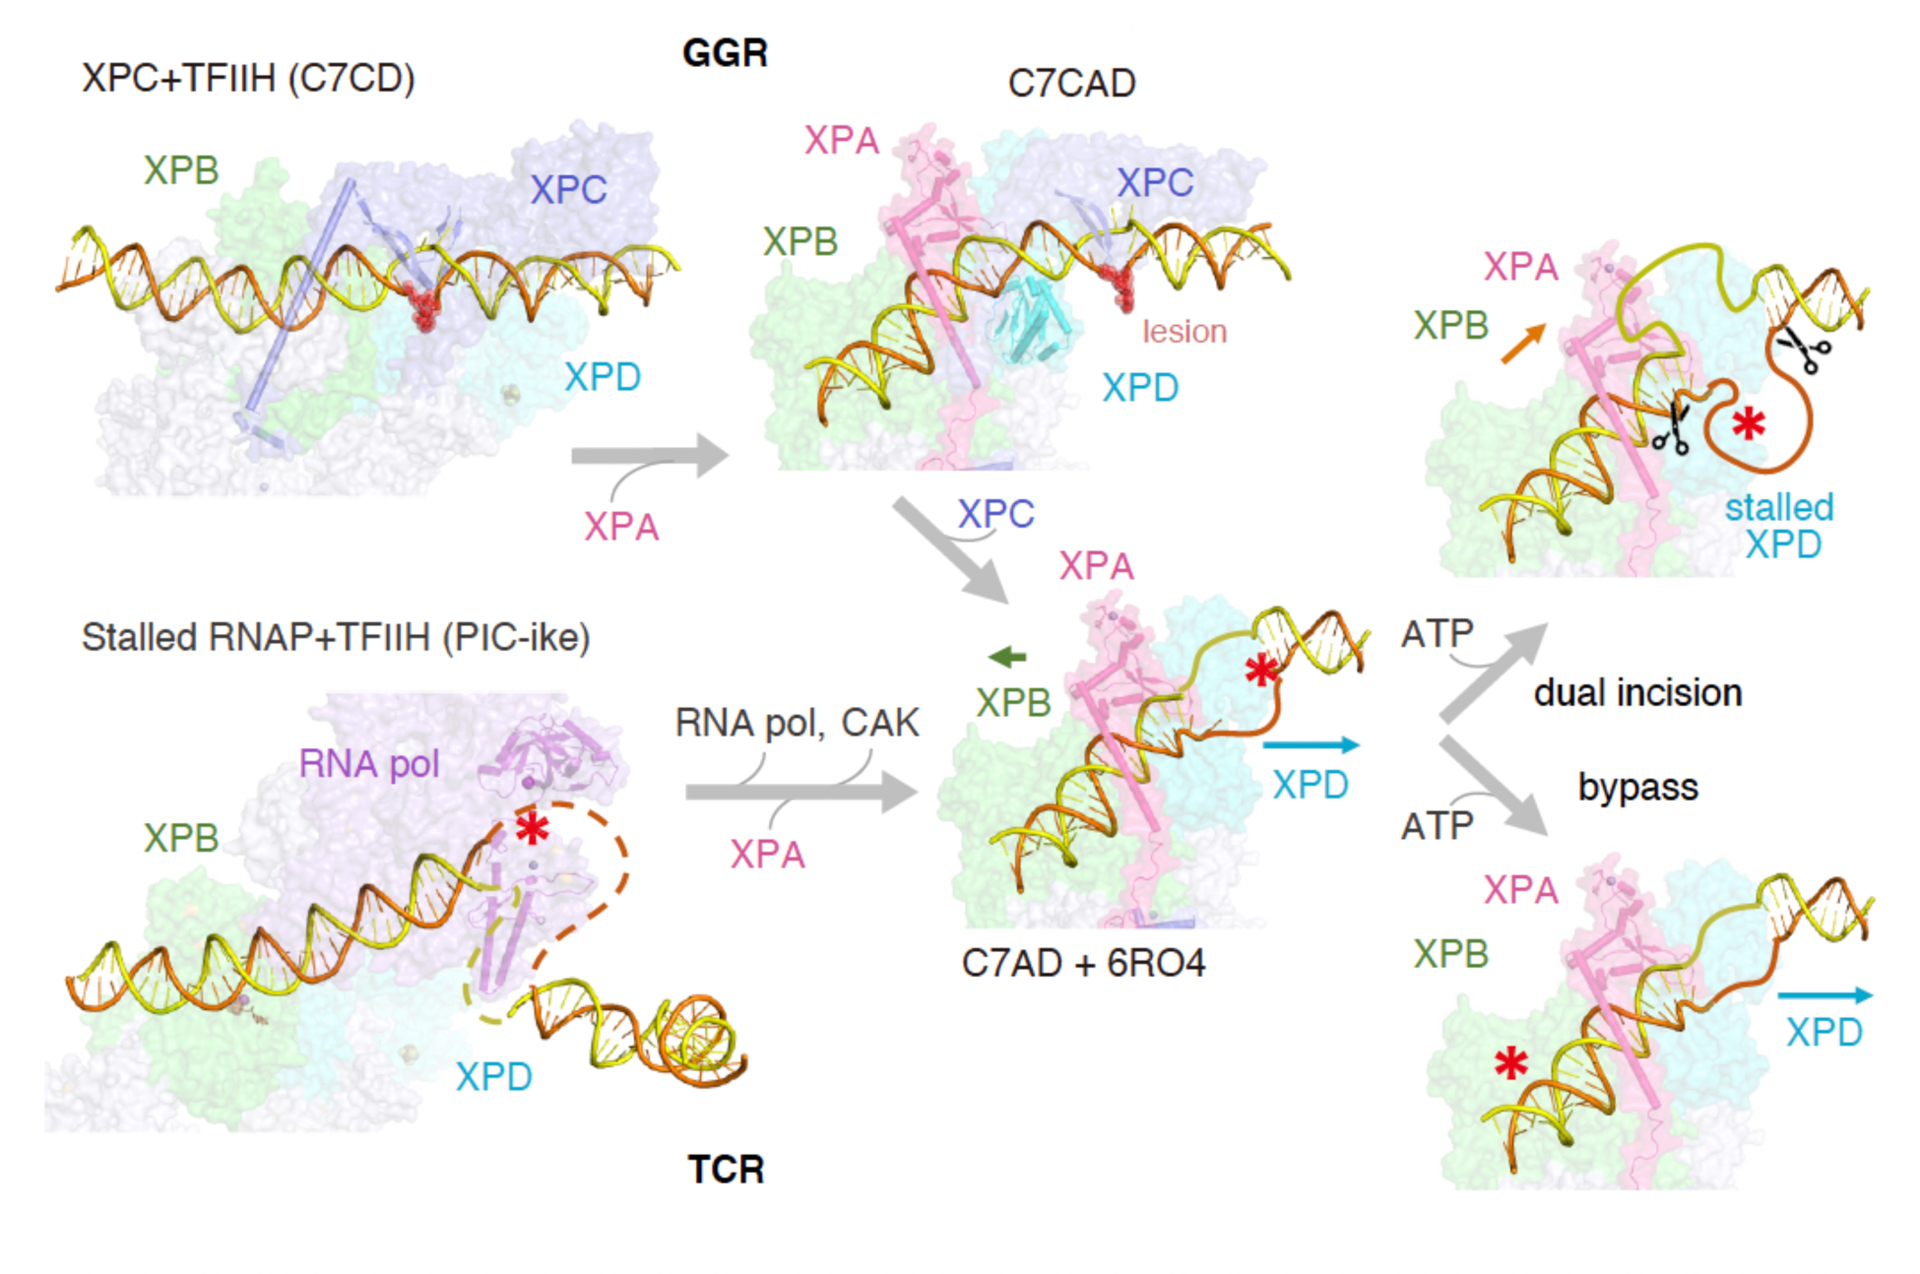
Nucleotide excision repair removes DNA lesions caused by ultraviolet light, cisplatin-like compounds and bulky adducts1. After initial recognition by XPC in global genome repair or a stalled RNA polymerase in transcription-coupled repair, damaged DNA is transferred to the seven-subunit TFIIH core complex (Core7) for verification and dual incisions by the XPF and XPG nucleases2. Structures capturing lesion recognition by the yeast XPC homologue Rad4 and TFIIH in transcription initiation or DNA repair have been separately reported3-7. How two different lesion recognition pathways converge and how the XPB and XPD helicases of Core7 move the DNA lesion for verification are unclear. Here we report on structures revealing DNA lesion recognition by human XPC and DNA lesion hand-off from XPC to Core7 and XPA. XPA, which binds between XPB and XPD, kinks the DNA duplex and shifts XPC and the DNA lesion by nearly a helical turn relative to Core7. The DNA lesion is thus positioned outside of Core7, as would occur with RNA polymerase. XPB and XPD, which track the lesion-containing strand but translocate DNA in opposite directions, push and pull the lesion-containing strand into XPD for verification.


Conflict of interest statement

Competing interests

The authors declare no competing interest.

Figures

Extended Data Fig. 1
Structures of NER complexes. (a) Yeast Rad4 (XPC) complexed with Core7 and damaged DNA (orange and yellow) (PDB: 7K04 at 9.25 Å). (b) Human XPA and Core7 are complexed with undamaged but branched DNA (PDB: 6RO4). These structures are superimposed at XPB. The DNA damage site is far away and upstream of the lesion sensor Fe4S4 (marked by the grey arrowheads). (c) For comparison, the structures reported here, human XPC and Core7 complex with Cy5-DNA (C7CD), is shown after superposition with 7K04. (d) In human XPC, XPA and Core7 complexed with Cy5-DNA (C7CAD), the DNA lesion (Cy5) is downstream of the XPD motor (5¢ to 3¢) and close to the lesion sensor Fe4S4 of XPD. when XPD translocates along the lesion strand (orange), Cy5 would be “seen” and stall the XPD motor
Extended Data Fig. 2
Structure determination of three Cy5 structures. (a) Diagram of Cy5-DNA and Cy5. (b) The workflow of cryoEM data processing and model generation. (c) FSC analysis of the quality and map resolution and model fit of each complex structure. (d) For each complex, angular distributions of particles used for the final threedimensional reconstruction, and a surface presentation of its map colored according to the local resolution estimated by ResMap with the scale bar on the side, are shown. (e) Representative regions of the three cryoEM maps are superimposed with the finalstructural models
Extended Data Fig. 3
Extended Data Fig. 3. Structure determination of four AP structures.
(a) Diagram of the AP-DNA, and EMSA results of 5 nM 32P-labeled AP-DNA binding by 5 nM each of XPA, Core7, Core7 and XPA (C7A), XPC, XPC and XPA (CA), Core7 and XPC (C7C) and Core7 with XPC and XPA (C7CA). The EMSA results were replicated at least six times. (b) The workflow of cryoEM data processing and model generation. (c) FSC analysis of the quality and map resolution and model fit of each complex structure. (d) For each complex, angular distributions of particles used for the final three-dimensional reconstruction, and a surface presentation of its map, colored according to the local resolution estimated by ResMap with the scale bar on the side, are shown. (e) Representative regions of the three cryoEM maps (DNA) are superimposed with the final structural models. For gel source data of 3a, see Supplementary Figures 3.
Extended Data Fig. 4
Extended Data Fig. 4. Structure-based sequence alignment of human XPC and yeast Rad4.
Conserved residues are highlighted in yellow (hydrophobic core), grey (structural stability), green (subunit interface), cyan (DNA binding, and underscore indicating base interactions), and red (disease mutation). Protein secondary structures are indicated by box (for helix) and arrow (strand). They are labeled alphabetically for helices and numerically for strands. In BHD domains 1–3, secondary structures are preceded by domain name “1”, “2” and “3”. Disordered regions are indicated by dashed lines
Extended Data Fig. 5
cryoEM maps of DNA bound by XPC and XPA. (a) The flipped out T26 in Cy5_C7CD. (b) The LHN has close contacts with Cy5 and the non-lesion strand across the minor groove. The cryoEM map in the above two panels are shown as semitransparency? grey surface. (c) cryoEM map corresponding to XPA and DNA in Cy5_C7CAD. Map volume is color coded and labeled. (d) A close-up of the C-terminal 52 residues of XPC (aa 889–940). XPB, p52, and p8 of Core7 and XPC are represented by the cryoEM map of C7CAD and C7AD of Cy5-DNA and color coded. Helices L, M and N of XPC are show as ribbon cartoons and labeled. The penultimate K939 of XPC, which is shown in a stick model, caps the carboxyl end of helix N. Potential interactions between the sidechain amine of K939 (shown as a sphere) and carbonyl oxygens are indicated by dashed yellow lines. Residues F935, P936 and F937 of XPC are anchored in a hydrophobic pocket in XPB (green).
Extended Data Fig. 6
Extended Data Fig. 6. Domain comparison of XPC, Rad4, RAD23 and CETN2.
(a) Superposition of TGD of XPC (slate blue) and Rad4 (semi-transparent grey). (b) Superposition of BHD1 of XPC and Rad4. (c) Superposition of BHD2 of XPC and Rad4. (d) Superposition of BHD3 of XPC and Rad4. (e) Superposition of Rad23 and RAD23 (pale green cartoon with molecular surface) reveals that TGD domains of XPC (blue) and Rad4 (grey) differ by a 16° rotation. (f) Superposition of TGD domains of XPC and Rad4 reveals that BHD1, BHD2 and BHD3 diverge increasingly. (g) Crystal structures of CETN2 (2GGM in pink and 2OBH in light blue) complexed with XPC peptide (LHC, blue) are superimposed. Symmetry mate of XPC is shown in pale green. (h) CETN2 (light green) and XPB (dark green) in C7CD are included in superposition. The LHC (XPC, dark blue) is shifted and interacts with the C-terminal helix of XPB when complexed with Core7.
Extended Data Fig. 7
Structure comparison of C7CD with PIC and XPB with SF2 helicase. (a) Superposition of XPB (green) in C7CD and in human PIC (PDB: 7NVW, light grey) shows the bent DNA associated with XPB and different position of XPD (cyan in C7CD and light grey in PIC) in the U-shaped Core7. (b) Superposition of HD2 of four SF helicases, XPB, Rad26 (CSB homolog), Snf2 and NS3 reveals that the tracking strands superimpose well in all cases
Extended Data Fig. 8
Extended Data Fig. 8. Repetitive and flexible structure of TFIIH (Core7).
(a) The Ushaped Core7 in C7CD. The N-terminal helices of p44 that contact XPB are outlined in a rounded rectangle. The XPD (left) and XPB (right) arm are well separated. (b) The σ shaped Core7 in C7CAD with p34 superimposed to C7CD and viewed in the same orientation as in panel a. The interface at p34-p44 and p34-p52 (inside the dashed oval)? remain unchanged. (c) The stable interfaces of p34 with p44-RING finger (RF) and p52. The C-terminal p34-DZF (double Zinc finger) and p44-ZR (Zing Ribbon) domain are labeled. (d) A β hairpin of p34-DZF in C7CD is changed to a short α helix in C7CAD. A part of p62 becomes disordered in C7CAD. (e) The third domain of p52 (DRD fold) contacts the N-terminal DRD domain (blueish) of XPB, which is followed by the second DRD domain (greenish) of XPB. The N-terminal helices of p44 (pink) contact the back side of XPB. (f) The fourth domain of p52 (grey) and p8 (light purple) form a heterodimer.
Extended Data Fig. 9
Extended Data Fig. 9. Comparison of DRD (Damage Recognition Domain) domains.
Two MutS DRDs (domains I and VI from 1EWQ) are shown on the left side for comparison. Five DRD domains in TFIIH are shown after superposition with MutS DRDs. Each DRD is colored in rainbow fashion from the blue N- to red C-terminus. Four β strands are labeled 1 to 4, and strands 2 and 4 are each followed by an α helix (A and B). In the P52-p8 heterodimer, the two subunits complement each other by supply the partner DRD with the first β strand (shown in semi-transparent blue and labeled 1’).
Extended Data Fig. 10
Extended Data Fig. 10. Length of Cy5_DNA substrate required for efficient dual incision.
(a) Sequence of three Cy5 DNA substrates, each of which contains a total 94 bp but different upstream (left) and downstream length from Cy5 (right). (b) Diagrams of the three DNA substrates. (c) Dual incision results of each DNA substrate (sub) after incubation with Core7, XPC, XPA, RPA, XPF and XPG at 37°C for 60 min. DNA cleavage intermediate (int) and final product (prod) are marked. (d) Means and standard deviations (error bars) of triplicated dual incision reactions as well as individual data points are shown in the bar graph. For gel source data, see Supplementary Figures 5.
Fig. 1
Fig. 1. Structures of lesion recognition and handoff.
(a) Primary structure of TFIIH (Core7), XPC and XPA. Structural domains are shown as rectangles and annotated. Each protein has a distinct color. Dotted lines and rectangles indicate disordered regions. (b) A protein SDS gel shows the purity of XPC, XPA and Core7. (c) EMSA results of 10 nM Cy5-DNA binding by 10 nM XPC, XPA, Core7, Core7 and XPA (C7A), XPC and XPA (CA), Core7 and XPC (C7C), and Core7 with XPC and XPA (C7CA). Data shown in 1b and 1c were reproduced at least six times. (d-f) cryoEM maps of C7CD (d), C7CAD (e) and C7AD (f) are color coded as in Fig. 1a. For gel source data of 1b and 1c, see Supplementary Figures 1 and 2.
Fig. 2
Fig. 2. Structure of human XPC-DNA complex.
(a) DNA duplex (yellow non-lesion and orange lesion strand) is bound by XPC (slate blue). RAD23 (pale green) and CETN2 (pea green) stabilize XPC. An orthogonal view is shown in the insert. (b) Lesion is recognized by BHD2 and BHD3. The flipped out Cy5 and opposite normal bases are stabilized by aromatic sidechains. (c) The flipped-out bases in Cy5 (multicolor) and AP-DNA (Conf2, pink) are shifted by 1 bp but overlap. (d) Overlay of the Cy5-DNA (yellow and orange) complexed XPC and DNA bound by Rad4 (PDB: 2QSH). DNA lesions complexed with Rad4 are disordered.
Fig. 3
Fig. 3. Structures of C7CD and C7CAD.
(a) In C7CD, where XPC and Core7 interact are circled in red. (b) In C7CAD, Core7 is shown in molecular surface, and others in ribbon diagrams. (c) XPA contacts XPB, p8 and p52 sequentially. (d) The αβ domain of XPA binds and kinks the DNA duplex. (e) p52 and p8 form a heterodimer, and p8 binds XPA. (f) L, M and N helices of XPC are anchored in Core7. The cryoEM map (C7CAD) is shown as semi-transparent surface. (g) DNA in C7CD (light grey), Cy5_ (orange/ yellow) and AP_C7CAD (wheat) are shown after superposition of XPB. The β hairpins of XPA (hot pink) and XPC (blue) mark the distorted DNA sites. Light purple arrows indicate the shift of DNA and XPC from C7CD (light grey) to C7CAD with XPB superimposed.
Fig. 4
Fig. 4. DNA translocation and dual incision.
(a) XPB binds the upstream DNA opposite XPA and moves along the lesion strand (orange) 3′ to 5′ (indicated by the olive arrow). If the protein is stationary, DNA would move in the opposite direction (indicated by the red arrow). (b) Structure of C7AD with the XPD-bound lesion strand borrowed from 6RO4 (brown). The red arrow indicates the direction of ssDNA translocation by stationary XPD. (c) Dual incision of Cy5- and AP-DNA required Core7, XPC, XPA, XPF (F), XPG (G), RPA (R) and ATP. Bands of substrate (sub), intermediate (int) and product (prod) are indicated. Means and standard deviations (error bars) of triplicated dual incision reactions are shown in the plot. For gel source data of 4c, see Supplementary Figures 4.
Fig. 5
Fig. 5. Diagram of NER mechanism.
In GGR, lesion recognition by XPC and hand-off to TFIIH (Core7) and XPA are based on this study. In TCR, TFIIH recruitment is based on the PIC structure (PDB: 7NW0). In both pathways, a lesion is loaded 3′ to XPD. The ATPase activity of XPD leads TFIIH to translocate along ssDNA (indicated by the blue arrow) and scan for lesions (verification). A small lesion may be bypassed by XPD and allow continuous ssDNA scanning. A bulky DNA lesion would stall the XPD motor and render Core7 stationary. DNA upstream of the lesion is then translocated by XPB toward XPD (indicated by the orange arrow), and XPA separates the duplex and helps to enlarge the DNA bubble for dual incision.

Similar articles

Cited by

References

    1. Hoeijmakers JH Nucleotide excision repair. II: From yeast to mammals. Trends in genetics : TIG 9, 211–217, doi:10.1016/0168-9525(93)90121-w (1993). - DOI - PubMed
    1. Marteijn JA, Lans H, Vermeulen W & Hoeijmakers JH Understanding nucleotide excision repair and its roles in cancer and ageing. Nature reviews. Molecular cell biology 15, 465–481, doi:10.1038/nrm3822 (2014). - DOI - PubMed
    1. Scharer OD Nucleotide excision repair in eukaryotes. Cold Spring Harb Perspect Biol 5, a012609, doi:10.1101/cshperspect.a012609 (2013). - DOI - PMC - PubMed
    1. Min JH & Pavletich NP Recognition of DNA damage by the Rad4 nucleotide excision repair protein. Nature 449, 570–575, doi:10.1038/nature06155 (2007). - DOI - PubMed
    1. Kokic G et al. Structural basis of TFIIH activation for nucleotide excision repair. Nat Commun 10, 2885, doi:10.1038/s41467-019-10745-5 (2019). - DOI - PMC - PubMed

Publication types