. 2023 Apr;616(7958):774-782.
doi: 10.1038/s41586-023-05960-6. Epub 2023 Apr 19.

Dedifferentiation maintains melanocyte stem cells in a dynamic niche

Affiliations

Dedifferentiation maintains melanocyte stem cells in a dynamic niche

Qi Sun et al. Nature. 2023 Apr.

Abstract

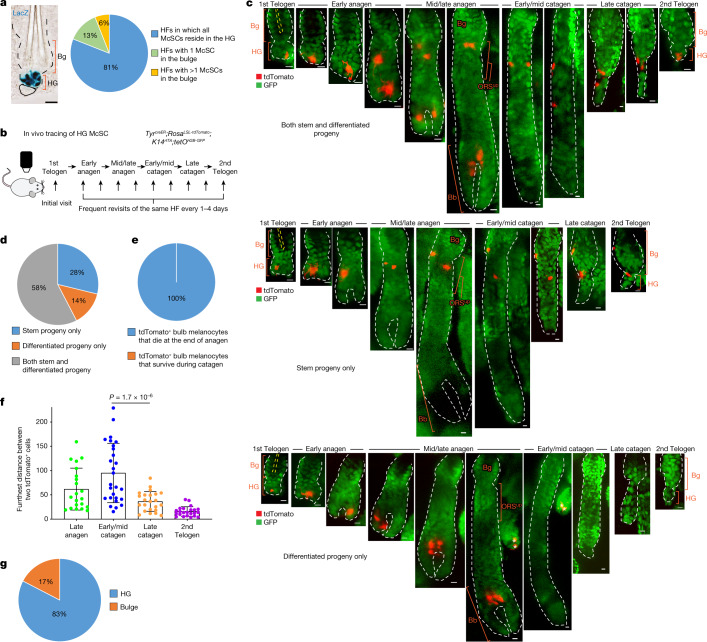
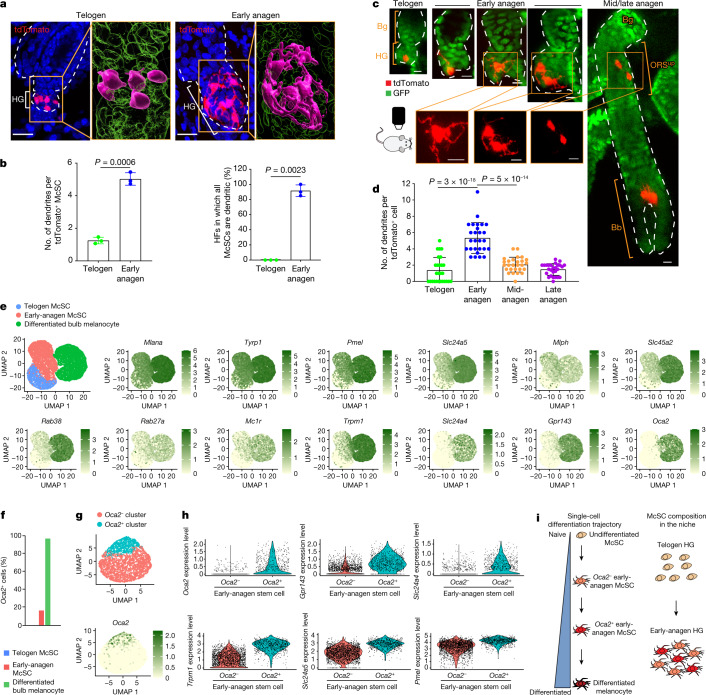
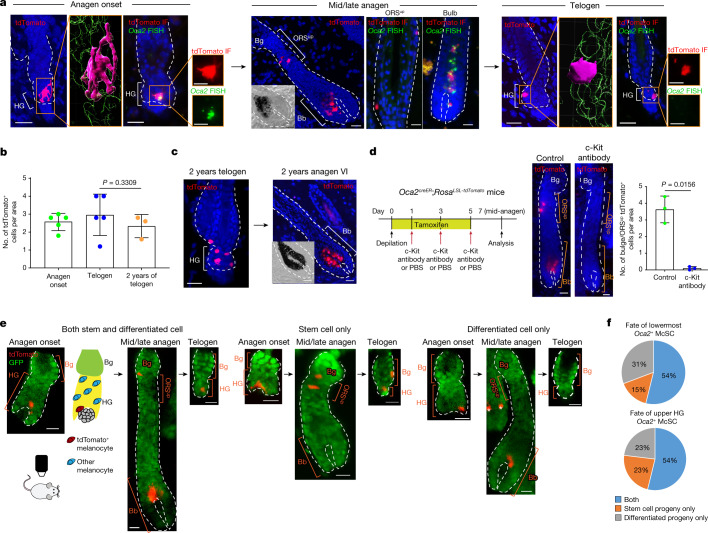
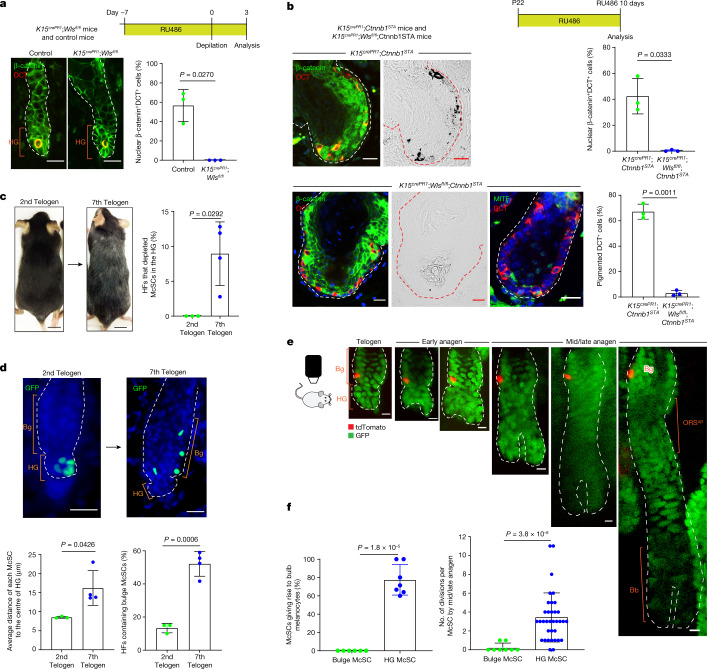
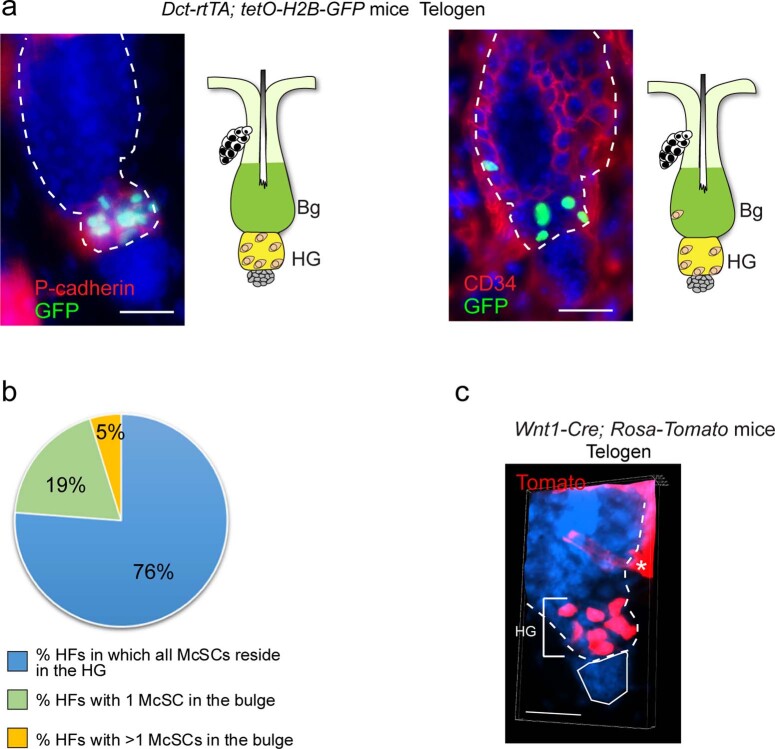
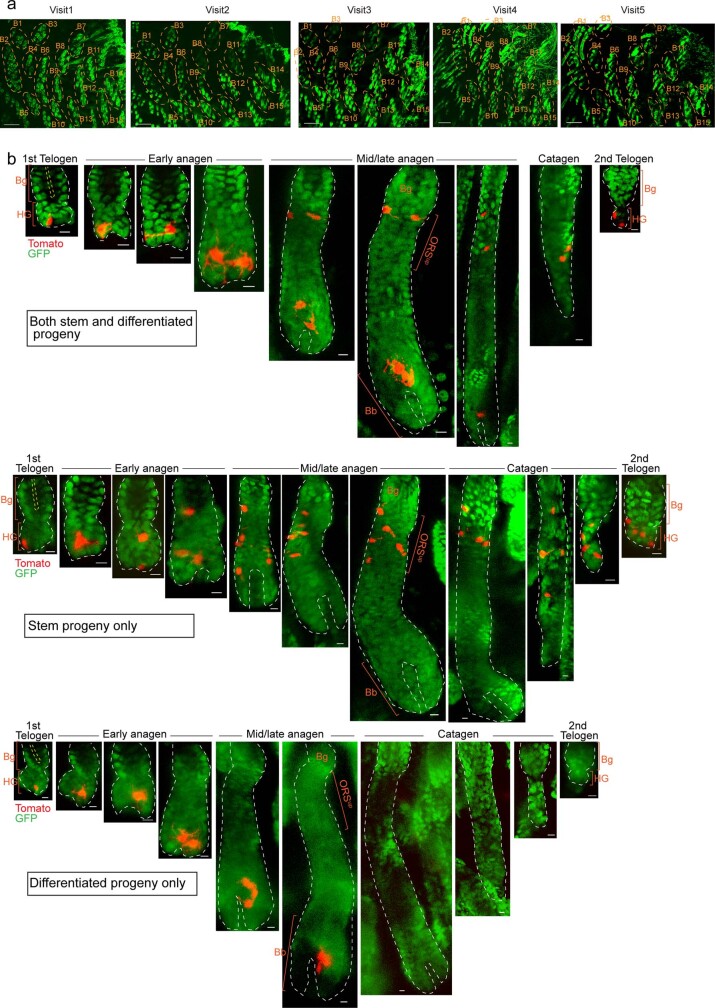
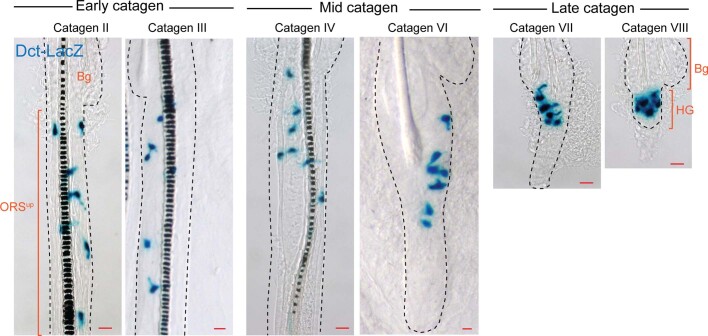
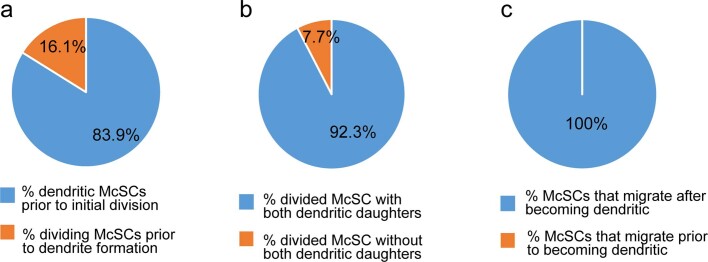
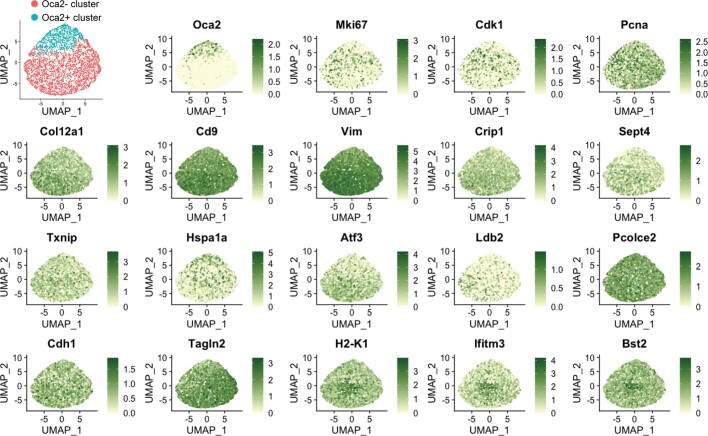
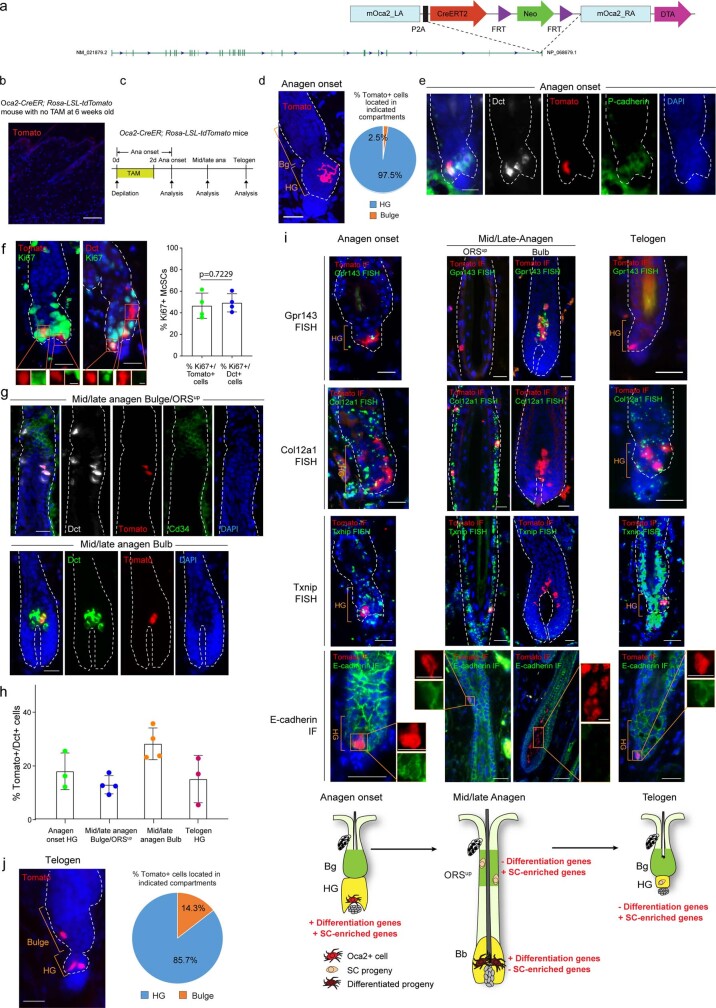
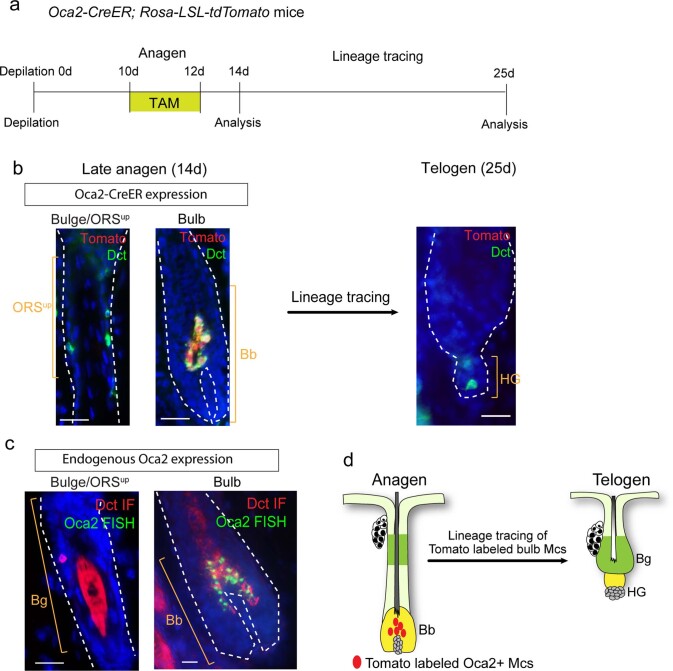
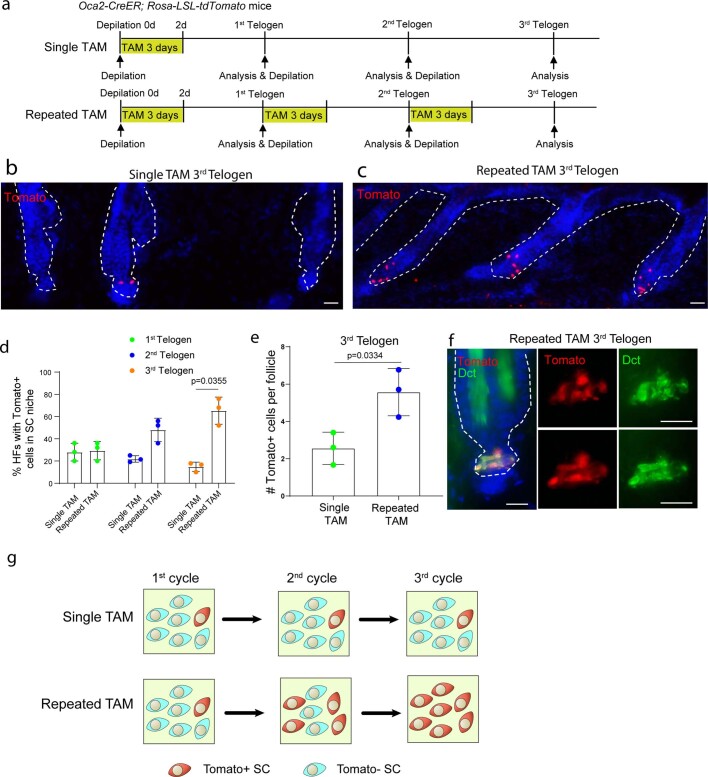
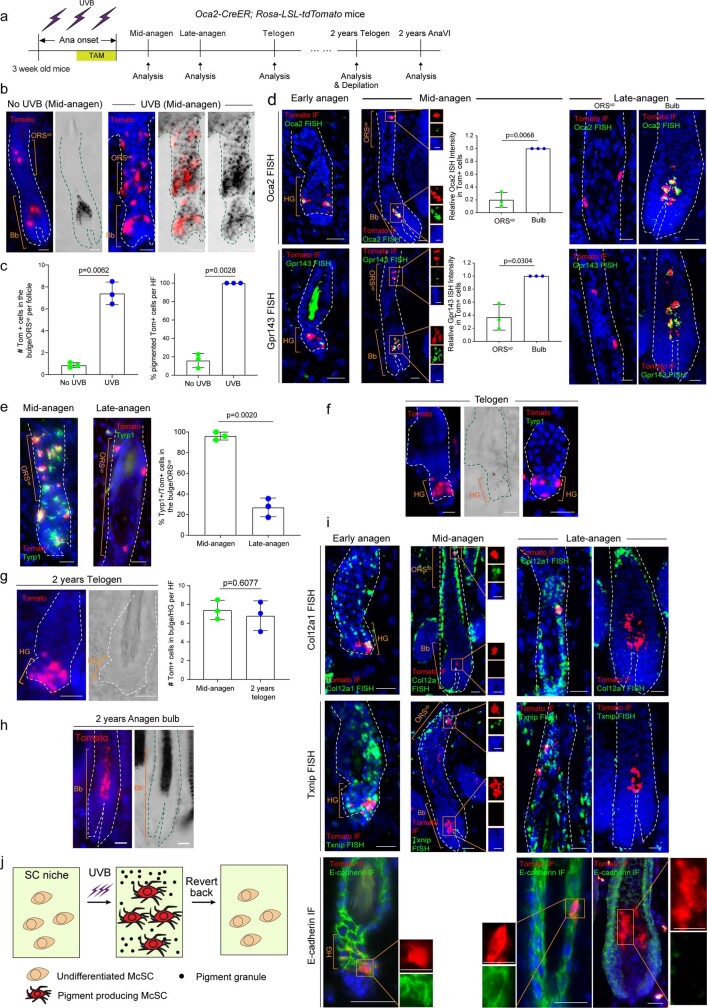
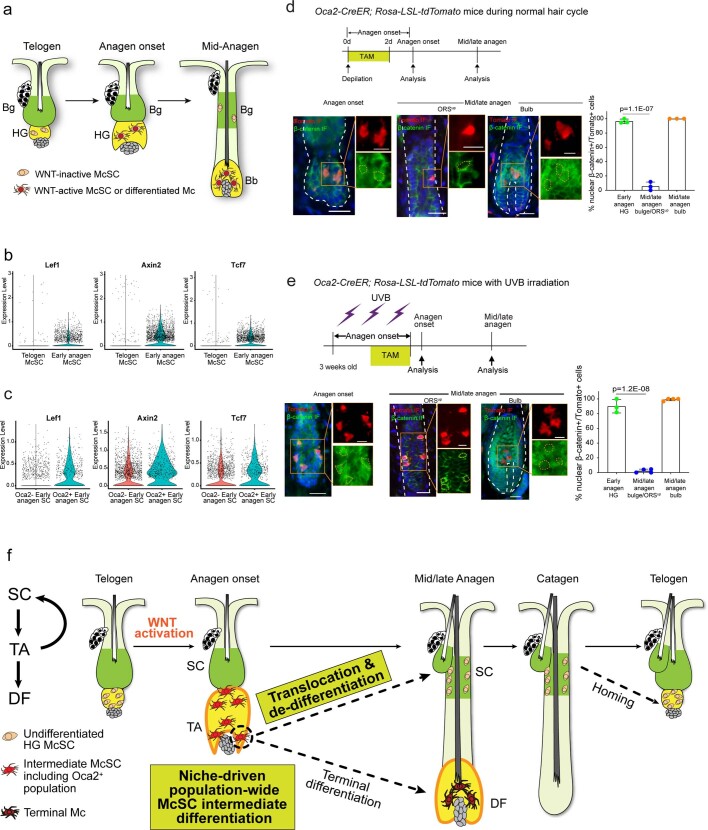
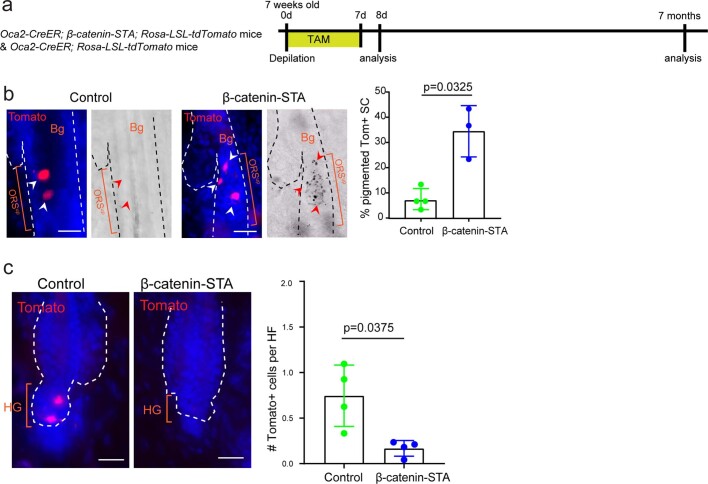
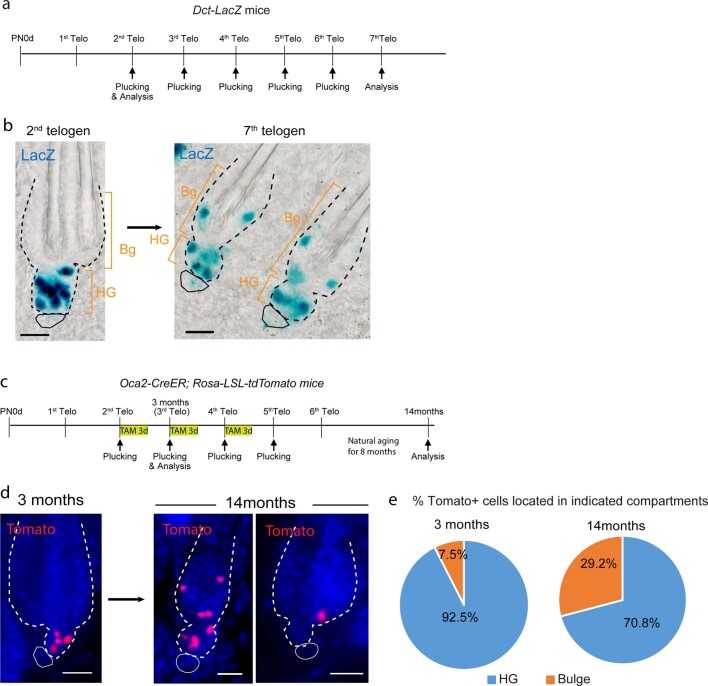
For unknow reasons, the melanocyte stem cell (McSC) system fails earlier than other adult stem cell populations1, which leads to hair greying in most humans and mice2,3. Current dogma states that McSCs are reserved in an undifferentiated state in the hair follicle niche, physically segregated from differentiated progeny that migrate away following cues of regenerative stimuli4-8. Here we show that most McSCs toggle between transit-amplifying and stem cell states for both self-renewal and generation of mature progeny, a mechanism fundamentally distinct from those of other self-renewing systems. Live imaging and single-cell RNA sequencing revealed that McSCs are mobile, translocating between hair follicle stem cell and transit-amplifying compartments where they reversibly enter distinct differentiation states governed by local microenvironmental cues (for example, WNT). Long-term lineage tracing demonstrated that the McSC system is maintained by reverted McSCs rather than by reserved stem cells inherently exempt from reversible changes. During ageing, there is accumulation of stranded McSCs that do not contribute to the regeneration of melanocyte progeny. These results identify a new model whereby dedifferentiation is integral to homeostatic stem cell maintenance and suggest that modulating McSC mobility may represent a new approach for the prevention of hair greying.


Conflict of interest statement

The authors declare no competing interests.

Figures

Fig. 1
Fig. 1. HG McSCs possess self-renewal ability.
a, Left, bright-field image of a X-gal-stained HF from a DctLacZ mouse at telogen. Right, quantification of McSCs in specified locations in telogen HFs from DctLacZ mice. N = 52 single, whole HFs from 3 mice. b, Timeline of in vivo imaging of single HG McSCs in TyrcreER;RosaLSL-tdTomato;K14rtTA;tetOH2B-GFP mice. HFs containing single HG tdTomato-labelled cells were identified at the first telogen stage and then revisited at indicated stages. c, Live z-stack images of three representative examples of tdTomato+ HG McSCs that undergo distinct fates. K14+ epithelial cells (GFP+) are in green. See Extended Data Fig. 2 for additional examples. Yellow dashed line outlines club hair. White asterisk marks tdTomato+ cell in unrelated HF (bottom). d, Quantification of distinct fates of HG McSCs. N = 59 HFs from 7 mice. e, Percentages of tdTomato+ bulb MCs that die at the end of anagen or survive during the catagen phase. N = 20 HFs from 2 mice. f, Bar graph showing the furthest distance between two tdTomato+ cells in the bulge/ORSup (at late anagen and early/mid catagen) and bulge/HG (at late catagen and second telogen). Data are presented as the mean ± s.d. P values (one-way analysis of variance (ANOVA) with Bonferroni multiple comparison test) are indicated, with 95% confidence interval at 35.81–81.13. N = 21 (late anagen), 27 (early/mid catagen) or 23 (late catagen and telogen) HFs from 2 mice. g, Percentages of tdTomato+ McSCs residing in bulge or HG at second telogen. N = 60 HFs from 6 mice. Dashed black or white lines outline the epithelial–dermal boundary (a,c). Scale bars, 20 μm (a) or 10 μm (c). Bb, bulb; Bg, bulge. Source data
Fig. 2
Fig. 2. McSCs in the HG initiate a differentiation programme during early anagen.
a, z-stack images of tdTomato+ McSCs from TyrcreER;RosaLSL-tdTomato mice at telogen and early anagen. Denoted areas are magnified and reconstructed using Imaris (magenta, tdTomato+; green, DAPI). b, Left, number of dendrites per tdTomato+ McSCs (N = 3 mice, ≥30 tdTomato+ McSCs analysed per mouse). Right, percentages of HFs containing only dendritic McSCs (N = 3 mice, 20 HFs analysed per mouse). Melanocytes with ≥3 dendrites were considered dendritic. Data are presented as the mean ± s.d. P values derived by two-tailed unpaired t-test. c, Live revisits of a representative first telogen HF containing a single HG tdTomato-labelled cell in a TyrCreER;RosaLSL-tdTomato;K14rtTA;tetOH2B-GFP mouse. K14+ epithelial cells (GFP+) are in green. Bottom panels show magnified views. d, Dendrite number per tdTomato+ McSCs in HG (telogen and early anagen) and bulge/ORSup (mid-anagen and late anagen). N = 27 HFs from 2 mice. Data are presented as the mean ± s.d. P values derived using one-way ANOVA with Bonferroni multiple comparison test, with the following 95% confidence intervals: −4.804 to −3.122 (telogen versus early anagen); 2.430 to 4.112 (early anagen versus mid-anagen). e, Uniform manifold approximation and projection (UMAP) plot of merged FACS-isolated telogen McSCs, early-anagen McSCs and differentiated anagen VI bulb melanocytes. FeaturePlots show expression of pigmentation genes. f, Percentages of Oca2+ cells within each population. g, UMAP plot of early-anagen McSCs after regression of cell cycle genes. The FeaturePlot shows Oca2 expression. h, Violin plots showing differential expression of pigmentation genes in early-anagen Oca2+ and Oca2 clusters. i, Schematic of melanocyte differentiation trajectory and McSC composition in the niche. Dashed white lines outline the epithelial–dermal boundary (a,c). Scale bars, 20 μm (a) or 10 μm (c). Source data
Fig. 3
Fig. 3. Oca2+ cells located in the TA compartment can undergo dedifferentiation during anagen.
ac, Oca2creER;RosaLSL-tdTomato mice were injected with tamoxifen three times during depilation-induced anagen onset for Oca2+ cell lineage tracing. a, Detection of tdTomato and Oca2 (fluorescence in situ hybridization (FISH)) as indicated. Denoted areas of tdTomato-only detection are reconstructed using Imaris (magenta, tdTomato+; green, DAPI). Magnified views of tdTomato immunofluorescence (IF) and OCA2 FISH are represented in single colour. b, Number of tdTomato+ cells over time. N = 5 mice (anagen onset and telogen) and N = 3 mice (2-year telogen). Five areas were analysed per mouse. P values were derived using one-way ANOVA with Bonferroni multiple comparison test, with 95% confidence intervals of −0.7397 to 1.993. c, Detection of tdTomato in telogen and induced anagen at 2 years following tamoxifen treatment. d, Left, timeline of injections and analysis 7 days after depilation of tdTomato expression in Oca2creER;RosaLSL-tdTomato mice treated with PBS (control) or a c-Kit-neutralizing antibody. Right, images and quantification of tdTomato+ McSCs. N = 3 mice. Ten areas were analysed per mouse. P value derived by two-tailed unpaired t-test. e, Live lineage tracing of a single tdTomato+ cell of Oca2creER:RosaLSL-tdTomato;K14rtTA:tetOH2B-GFP mice reveals three fates. GFP marks K14+ epithelial cells. Cartoon illustrates the relative locations of tdTomato+ melanocytes and other melanocytes in the HF. White asterisks indicate tdTomato+ cells in an unrelated HF. f, Percentages of single Oca2+ cells in the lowest HG region (N = 13 HFs from 1 mouse) or the upper HG (N = 13 HFs from 1 mouse) that give rise to specific progeny as defined. Insets in mid/late anagen images in a and c show bright-field images of the bulb. For b and d, data are presented as the mean ± s.d. Scale bars, 20 μm or 10 μm (single colour images of a). Dashed white lines outline the epithelial–dermal boundary (a,c,d,e). Source data
Fig. 4
Fig. 4. HF ageing limits the access of McSCs to niche signals that reversibly regulate their differentiation.
a, Top, K15crePR1;Wlsfl/fl conditional knockout mice and control mice (7 weeks old) were treated with RU486 and depilated. Bottom left, immunofluorescence of DCT and β-catenin at 3 days after depilation. Bottom right, percentages of DCT+ McSCs with nuclear β-catenin. N = 3 mice. b, Top, K15crePR1;Ctnnb1STA mice and K15crePR1;Wlsfl/fl;Ctnnb1STA mice were treated with RU486 from P22. Bottom left, immunofluorescence of DCT, β–catenin and MITF with corresponding bright-field images. Bottom right, percentages of DCT+ McSCs with nuclear β-catenin signals and pigmentation. N = 3 mice. c,d, Comparison of DctrtTA;tetOH2B-GFP mice at second and seventh telogen. c, Representative images of mice. Percentages of HFs lacking HG McSC (second telogen: N = 3 mice, 20 HFs analysed per mouse. Seventh telogen: N = 4 mice, ≥36 HFs analysed per mouse). d, Left, z-stack images of HFs with McSCs in GFP. Right, average distance of each McSC from the HG centre (second telogen, N = 3 mice; seventh telogen, N = 4 mice. Five HFs analysed per mouse). Right, percentages of HFs containing bulge McSCs (second telogen, N = 3 mice, 20 HFs analysed per mouse; seventh telogen, N = 4 mice, ≥36 HFs analysed per mouse). e, Live tracing of a single tdTomato+ bulge McSC in a TyrcreER;RosaLSL-tdTomato;K14rtTA;tetOH2B-GFP mouse. f, Left, percentages of bulge and HG McSCs that produced differentiated progeny (HG, N =  7 mice, 59 HFs; bulge, N = 6 mice, 8 HFs). Right, the number of divisions by each bulge and HG McSC by mid/late anagen (N = 35 HFs with a single HG McSC; 8 HFs with a single bulge McSC). For ad,f, data are presented as the mean ± s.d. P values derived by two-tailed unpaired t-test. Dashed white or red lines outline the epithelial–dermal boundary (a,b,d,e). Scale bars, 20 µm (a,b,d), 10 µm (e) or 1 cm (c). Source data
Extended Data Fig. 1
Extended Data Fig. 1. McSCs primarily reside in P-cadherin+ HG and occasionally in CD34+ bulge at telogen.
(a) Z-stack image of GFP+ cells showing P-cadherin or CD34 expression on whole telogen HFs of Dct-rtTA; tetO-H2B-GFP mice. Schematics depict observed distribution of GFP+ cells. All hair types were included by examining hair follicles without bias per given areas. (b) Quantification of the locations of McSCs in the telogen HFs from Dct-rtTA; tetO-H2B-GFP mice. HG is considered P-cadherin+ and bulge is considered P-cadherin. N = 42 whole HFs from 3 mice. (c) Focused image of Tomato+ cells in telogen HF of 8 weeks old Wnt1-Cre; Rosa-LSL-Tomato mouse (2nd telogen). HG: hair germ; Bg: bulge. Scale bar: 20 μm. Dashed white lines outline epithelial-dermal boundary. Solid circle suggests location of dermal papilla. White asterisk marks Tomato signal outside of the hair follicle. Source data
Extended Data Fig. 2
Extended Data Fig. 2. Additional live images of McSC lineage tracing.
(a) Representative example of large tile images showing the pattern of HF distribution at each visit of the same area to guide repeated accurate tracing of the same HF. Z-stack images show GFP signal (K14+ epithelium) in Tyr-CreER;Rosa-LSL-tdTomato;K14-rtTA;tetO-H2B-GFP mice. Orange dashed lines mark hair follicle bundles (labeled, B1, B2, B3…). Overlapping patterns were used to identify specific HFs. Shown are representative images, N = 7 mice. (b) Additional examples of Fig. 1c. Z-stack images of three independent examples of HFs from in vivo imaging of Tyr-CreER;Rosa-LSL-tdTomato;K14-rtTA;tetO-H2B-GFP mice imaged as illustrated in Fig. 1b. A single tdTomato-labeled cell within each HF was initially visited at the first telogen stage; then revisited at early anagen, mid/late anagen, catagen and the next telogen (2nd telogen). Shown are representative examples of Tom+ HG McSCs that undergo self-renewal and differentiation (top panels), self-renewal (middle panels) and differentiation (bottom panels). In the middle panels, note that one Tom+ cell died at the beginning of catagen, so only 4 Tom+ cells are present during catagen stages. Yellow dashed line outlines club hair. Dashed white lines outline epithelial-dermal boundary. HG: hair germ; Bb: bulb; Bg: bulge; ORSup: upper ORS.
Extended Data Fig. 3
Extended Data Fig. 3. Distribution of McSCs in Dct-LacZ mice during catagen stages.
Images of hair follicles from Dct-LacZ mice at indicated catagen stages. Note that LacZ+ McSCs come together at late catagen to eventually aggregate in the HG. Shown are representative images, N = 5 mice. Dashed black lines outline epithelial-dermal boundary. HG: hair germ; Bg: bulge; ORSup: upper ORS. Scale bar: 20 µm.
Extended Data Fig. 4
Extended Data Fig. 4. Quantification of dendrite state of McSCs by live imaging.
Quantification of live imaging experiment in Fig. 2c. (a) Percentages of dendritic McSCs prior to or after initial division. N = 31 HFs from 2 mice. (b) Percentages of post-mitotic McSCs with or without both dendritic daughters. N = 26 HFs from 2 mice. (c) Percentages of McSCs that migrate before or after dendrite formation. N = 35 HFs from 2 mice. Source data
Extended Data Fig. 5
Extended Data Fig. 5. Early anagen McSCs activate dendrite and pigmentation related genes while retaining the expression of SC-enriched genes.
(a) FACS plots illustrating the gating strategy to isolate GFP+ melanocytes from Dct-rtTA; tetO-H2B-GFP mice. UMAP plot of merged scRNA-seq results from sorted telogen McSCs (blue), anagen II McSCs (Early anagen McSC, red) and anagen VI bulb Mcs (Differentiated bulb Mc, green). (b) Featureplots showing regions and levels of expression of indicated dendrite-related genes. (c) GSEA of Gene Ontology Biological Process (GOBP) dendrite development and dendrite morphogenesis in differentially expressed genes (DEGs) from early anagen McSCs compared to telogen McSCs. (d) Top, violin plots of the cell cycle scores of early anagen McSCs. Bottom, UMAP plot of early anagen McSCs clustered by their cell-cycle score. The S and G2M phase cells are grouped together into proliferative early anagen McSCs and the G1 phase cells constitute the non-proliferative early anagen McSCs. (e) Violin plots showing expression of pigmentation genes in the proliferative (Prolif) and non-proliferative (Non-Prolif) early anagen McSCs. (f) Featureplots showing expression of indicated SC-enriched genes in telogen McSCs, early anagen McSCs and late anagen bulb Mcs. (g) Quantitative RT-PCR analysis of indicated SC-enriched genes in bulb Mcs and telogen McSCs. N = 5 mice. Data are represented as mean ± SEM. P-values by two-tailed unpaired t test. (h) UMAP plot with dots and lines showing pseudo-time trajectory predicted using slingshot package. Source data
Extended Data Fig. 6
Extended Data Fig. 6. Examination of the early anagen HG scRNAseq dataset for proliferation and expression of SC-enriched genes.
UMAP of early anagen McSCs after cell cycle genes regression. Featureplots of proliferation genes and SC-enriched genes in Oca2 and Oca2+ early anagen McSCs.
Extended Data Fig. 7
Extended Data Fig. 7. Characterization of Tomato+ cells in Oca2-CreER;Rosa-LSL-tdTomato mice during lineage tracing.
(a) Targeting vector design of Oca2-CreERT2 knock-in mouse. (b) Cryo section image of Oca2-CreER;Rosa-LSL-tdTomato mouse back skin without TAM treatment at 6–13 weeks old. Shown is representative image of 4 mice. (c) Experimental design for panels (d)-(j). Lineage tracing of Oca2+ HG McSCs in Oca2-CreER; Rosa-LSL-tdTomato HFs. (d) Z-stack image of Oca2+ (Tom+) cell in whole hair follicle at anagen (Ana) onset. Analysis of the location of Oca2+ (Tom+) cells in indicated niche compartments at anagen onset. N = 4 mice with at least 10 HFs analyzed per mice. (e) Merged or separate immunofluorescence images of Dct (white), Tomato (red), P-cadherin (green) and DAPI (blue) at early anagen. (f) Immunofluorescence of Tomato and Ki67 and Dct and Ki67 in early anagen. Lower panels depict magnified single color images in specified regions. Quantification of Ki67+/Tomato+ cells or Ki67+/Dct+ cells. N = 4 mice in each group with at least 10 HFs analyzed per mouse. Data are represented as mean ± SD. P-values by two-tailed unpaired t test. (g) Top: Merged or separate immunofluorescence images of Dct (white), Tomato (red), Cd34 (green) and DAPI (blue) in mid/late anagen bulge/ORSup. Bottom: Merged or separate immunofluorescence images of Dct (green), Tomato (red) and DAPI (blue) in mid/late anagen bulb. (h) Quantification of Tomato+/Dct+ cells. N = 3 mice in anagen onset HG and telogen HG groups and N = 4 mice in mid/late anagen bulge/ORSup and bulb groups with at least 10 HFs analyzed per mouse per compartment. Data are represented as mean ± SD. (i) Immunofluorescence of tdTomato and in situ hybridized Gpr143 probe, Col12a1 probe and Txnip probe. Col12a1 and Txnip were also observed in unrelated epithelial cells. IF shows tdTomato and e-cadherin staining with boxed single color enlargements. Schematic illustration of differentiation genes (Oca2, Gpr143) and SC-enriched genes (Col12a, Txnip, E-Cadherin) expression in an early anagen Oca2+ cell and its progeny at subsequent hair cycle stages. Shown are representative images, N = 3 mice. (j) Z-stack image of trace labeled Tom+ cells in subsequent telogen. Quantification of the location of Tom+ cells in indicated niche compartments in subsequent telogen. N = 3 mice with at least 5 HFs analyzed per mice. Dashed white lines outline epithelial-dermal boundary. Scale bar: 20 μm, 10 µm in separate channel images. IF: immunofluorescence; FISH: fluorescence in situ hybridization; HG: hair germ; Bb: bulb; Bg: bulge; ORSup: upper ORS; TAM: tamoxifen; d: day. Source data
Extended Data Fig. 8
Extended Data Fig. 8. Genetic lineage tracing shows that Oca2+ bulb Mcs do not home back to the HG.
(a) Experimental design for lineage tracing of Oca2+ late anagen bulb Mcs in Oca2-CreER;Rosa-LSL-tdTomato HFs. (b) Left, immunofluorescence images showing Dct and Tomato (Oca2) expression in McSCs and Mcs in late anagen (depilation 14d) bulge/ORSup and bulb. Right (after arrow), immunofluorescence image showing lack of Tomato labeling in Dct+ McSCs at subsequent telogen (depilation 25d). Shown are representative images, N = 3 mice. (c) Immunofluorescence images of Dct and in situ transcriptional localization of endogenous Oca2 mRNA in late anagen bulge/ORSup and bulb from TAM-untreated mice. Shown are representative images of 3 mice. Note that the pattern of endogenous Oca2 mRNA is consistent with Oca2-CreER activity (Tomato signals) in (b) left panels. (d) Schematic illustration of the fate of Tomato labeled bulb Mcs. Dashed white lines outline epithelial-dermal boundary. IF: immunofluorescence; FISH: fluorescence in situ hybridization. HG: hair germ; Bg: bulge; Bb: bulb; ORSup: upper ORS; TAM: tamoxifen; d: day. Scale bar: 20 μm.
Extended Data Fig. 9
Extended Data Fig. 9. New McSCs become Oca2+ at each hair cycle.
(a) Experimental scheme of TAM injection during one hair cycle (single TAM) or several continuous hair cycles (repeated TAM) in Oca2-CreER;Rosa-LSL-tdTomato mice. (b-c) Z-stack images of trace-labeled Tom+ cells in 3rd telogen HFs after single (b) or repeated (c) TAM injections. (d) Number of HFs containing Tom+ cells in HG after single or multiple TAM injections. HFs were counted at 1st telogen (green), 2nd telogen (blue) and 3rd telogen (orange). N = 3 mice, with at least 25 HFs analyzed per mice per time point. Data are represented as mean ± SD. P-value by two-way ANOVA with Bonferroni multiple comparison test. 95% confidence interval: −94.18 to −6.799. (e) Number of Tomato+ McSC per hair follicle from single and multiple TAM-injected mice at 3rd telogen. N = 3 mice with at least 3 HFs containing Tom+ cells analyzed per mice. Data are represented as mean ± SD. P-value by two-tailed unpaired t test. (f) Z-stack image of Tomato and Dct co-immunofluorescence at 3rd telogen following repeated TAM injections. To show the co-localization of green and red signals in all McSCs throughout the z-stack, the right top panels show the z-stack of first 15 stacks and the right bottom panels show the z-stack of last 15 stacks. Shown are representative images of 3 mice. (g) Schematic summary. Dashed white lines outline epithelial-dermal boundary. Scale bar: 20 μm. TAM: tamoxifen; d: day. Source data
Extended Data Fig. 10
Extended Data Fig. 10. Reversible differentiation of pigmented McSCs following UVB irradiation.
(a) Experimental scheme: Oca2-CreER;Rosa-LSL-tdTomato mice were irradiated with UVB for 3 times and injected with TAM for 3 times during anagen onset and analyzed at the following time points. (b) Z-stack and corresponding brightfield images (separate and merged) of Tom+ cells in mid-anagen control and UVB-treated HFs. (c) Number of Tom+ cells in bulge/ORSup per HF; percentages of pigmented Tom+ cells in bulge/ORSup per HF at mid-anagen. N = 3 mice. 20 HFs analyzed per mice. (d) Immunofluorescence of tdTomato and in situ hybridized Oca2 probe and Gpr143 probe. Quantification of the FISH intensity of Oca2 or Gpr143 probe expression in Tomato+ cells in ORSup relative to the FISH intensity of Tomato+ cells in the bulb analyzed by HALO FISH module. N = 3 mice with at least 20 Tom+ cells analyzed per compartment per mouse. (e) Immunofluorescence images show localization of tdTomato and differentiation marker Tyrp1 at indicated time points. Percentages of Tyrp1+/Tom+ cells in the bulge/ORSup. N = 3 mice. 10 HFs analyzed per mouse. (f) Z-stack image of Tom+ cells with corresponding brightfield and Tyrp1 staining for UVB-treated mice at subsequent telogen. Shown are representative images, N = 3 mice. (g) Z-stack image of trace-labeled Tom+ cells and corresponding brightfield image in telogen HF from UVB-treated mouse at 2 years. Number of Tom+ cells per hair follicle after UVB irradiation at mid-anagen and 2 years. N = 3 mice with 20 HFs analyzed per mice. (h) Z-stack image of trace-labeled Tom+ cells and corresponding brightfield image in anagen VI HF bulb region from UVB-treated mouse at 2 years. (i) Immunofluorescence of tdTomato and in situ hybridized Col12a1 probe and Txnip probe. IF shows tdTomato and e-cadherin staining with boxed single color enlargements. Shown are representative images, N = 3 mice. (j) Schematic postulates that all McSCs can undergo differentiation to make pigment after UV treatment, followed by reversion to an undifferentiated state, then self-renewal and regeneration of differentiated Mcs over time. Dashed white lines outline epithelial-dermal boundary. Scale bar: 20 μm, 10 µm in separate channel images. Data are represented as mean ± SD in (c), (d), (e) and (g). P-values by two-tailed unpaired t test in (c), (d), (e) and (g). IF: immunofluorescence; FISH: fluorescence in situ hybridization; HG: hair germ; Bb: bulb; ORSup: upper ORS; TAM: tamoxifen. Source data
Extended Data Fig. 11
Extended Data Fig. 11. McSCs reversibly enter distinct differentiation states correlating with WNT signaling.
(a) WNT activation pattern in McSCs as previously reported. (b) VlnPlots show expression of WNT genes in telogen McSCs and early anagen McSCs. (c) VlnPlots show expression of WNT genes in Oca2+ early anagen McSCs and Oca2 early anagen McSCs. For (b), see Fig. 2e for related UMAP. For (c), see Fig. 2g for related UMAP. (d) Experimental scheme of Oca2-CreER;Rosa-LSL-tdTomato mice during normal hair cycle. Double-detection of tdTomato and β-catenin in normal hair cycle shown with enlarged single-color images of the denoted areas. Percentages of nuclear β-catenin+Tomato+ cells. N = 3 mice with at least 10 HFs analyzed per compartment per mouse. Data are represented as mean ± SD. P-values by ordinary one-way ANOVA with Bonferroni multiple comparison test. 95% confidence intervals: 83.22 to 98.56. (e) Experimental scheme of Oca2-CreER;Rosa-LSL-tdTomato mice with UVB irradiation. Double-detection of tdTomato and β-catenin with UVB treatment shown with enlarged single-color images of the denoted areas. Percentages of nuclear β-catenin+Tomato+ cells. N = 3 mice in early anagen HG and N = 4 mice in mid/late anagen bulge/ORSup and bulb groups with at least 10 HFs analyzed per compartment per mouse. Data are represented as mean ± SD. P-values by ordinary one-way ANOVA with Bonferroni multiple comparison test. 95% confidence intervals: 79.21 to 96.66. (f) Schematic summary of reversible differentiation model. McSCs in the HG during the quiescent telogen phase are in a stem-like state. At anagen onset (regeneration initiation), they undergo activation and differentiation to a TA-like (intermediate) state via WNT activation. These cells then either fully differentiate into terminal Mcs or revert to a stem-like state upon migration into the WNT-negative bulge/ORSup. Subsequently, most McSCs home back to the HG. Orange dotted lines in single color images suggest nuclei location. Dashed white lines outline epithelial-dermal boundary. Scale bar: 20 μm, 10 µm in separate channel images. IF: immunofluorescence; HG: hair germ; Bg: bulge; Bb: bulb; ORSup: upper ORS; TAM: tamoxifen; d: day; SC: stem cell; TA: transit-amplifying; DF: differentiated. Source data
Extended Data Fig. 12
Extended Data Fig. 12. Constitutive WNT activation induces pigmentation of Oca2+ McSCs, leading to their loss.
(a) Experimental scheme: Oca2-CreER;Rosa-LSL-tdTomato control and Oca2-CreER;β-catenin-STA;Rosa-LSL-tdTomato mice were depilated and injected with TAM for 7 days. (b) Evaluation of pigmentation status of Tom+ McSCs with or without constitutive WNT activation. Z-stack images of Tom+ cells and corresponding brightfield images at 1 day after last TAM injection. Percentages of pigmented Tom+ McSCs. Data are represented as mean ± SD. P-values by two-tailed unpaired t test. N = 4 mice (control), N = 2 mice, 3 independent areas (β-catenin-STA). 30 HFs analyzed per mouse/area. (c) Evaluation of how long-term constitutive WNT activation affects the maintenance of Oca2+ McSCs. Z-stack images of Tom+ cells at 7 months post-TAM injection. Number of Tom+ McSCs per hair follicle in the telogen bulge/HG. Data are represented as mean ± SD. P-value by two-tailed unpaired t test. N = 4 mice in control, N = 4 independent areas from 2 mice in β-catenin-STA group. At least 15 HFs analyzed per mouse/area. Dashed lines outline epithelial-dermal boundary. Arrowheads point to Tom+ McSCs in the bulge/ORSup. Scale bar: 20 µm. HG: hair germ; Bg: bulge; ORSup: upper ORS; TAM: tamoxifen; d: day. Source data
Extended Data Fig. 13
Extended Data Fig. 13. Increased scattering of McSCs to the bulge in aged Dct-LacZ and Oca2-CreER;Rosa-LSL-tdTomato mice.
(a) Experimental scheme of repeated plucking of Dct-LacZ mice. (b) Images of hair follicles from Dct-LacZ mice at 2nd telogen and 7th telogen after hair plucking. (c) Experimental scheme: early repeated plucking followed by natural aging of Oca2-CreER;Rosa-LSL-tdTomato mice. (d) Z-stack images of hair follicles from Oca2-CreER;Rosa-LSL-tdTomato mice at 3 months old (3rd telogen) and 14 months old telogen. (e) Quantification of Tom+ McSCs residing in the HG or bulge in Oca2-CreER;Rosa-LSL-tdTomato mice at indicated time points. N = 42 HFs from 2 mice at 3 months. N = 54 HFs from 2 mice at 14 months. Dashed lines outline epithelial-dermal boundary. Solid circles suggest location of dermal papilla. Scale bar: 20 µm. HG: hair germ; Bg: bulge; TAM: tamoxifen; d: day; PN: postnatal; Telo: telogen. Source data

Comment in

References

    1. Nishimura EK, Granter SR, Fisher DE. Mechanisms of hair graying: incomplete melanocyte stem cell maintenance in the niche. Science. 2005;307:720–724. doi: 10.1126/science.1099593. - DOI - PubMed
    1. Keogh EV, Walsh RJ. Rate of greying of human hair. Nature. 1965;207:877–878. doi: 10.1038/207877a0. - DOI - PubMed
    1. O’Sullivan JDB, et al. The biology of human hair greying. Biol. Rev. Camb. Philos. Soc. 2021;96:107–128. doi: 10.1111/brv.12648. - DOI - PubMed
    1. Nishimura EK, et al. Dominant role of the niche in melanocyte stem-cell fate determination. Nature. 2002;416:854–860. doi: 10.1038/416854a. - DOI - PubMed
    1. Nishimura EK. Melanocyte stem cells: a melanocyte reservoir in hair follicles for hair and skin pigmentation. Pigment cell & melanoma research. 2011;24:401–410. doi: 10.1111/j.1755-148X.2011.00855.x. - DOI - PubMed

Publication types