. 2023 Apr;616(7958):822-827.
doi: 10.1038/s41586-023-05961-5. Epub 2023 Apr 19.

CTCF is a DNA-tension-dependent barrier to cohesin-mediated loop extrusion

Affiliations

CTCF is a DNA-tension-dependent barrier to cohesin-mediated loop extrusion

Iain F Davidson et al. Nature. 2023 Apr.

Abstract

In eukaryotes, genomic DNA is extruded into loops by cohesin1. By restraining this process, the DNA-binding protein CCCTC-binding factor (CTCF) generates topologically associating domains (TADs)2,3 that have important roles in gene regulation and recombination during development and disease1,4-7. How CTCF establishes TAD boundaries and to what extent these are permeable to cohesin is unclear8. Here, to address these questions, we visualize interactions of single CTCF and cohesin molecules on DNA in vitro. We show that CTCF is sufficient to block diffusing cohesin, possibly reflecting how cohesive cohesin accumulates at TAD boundaries, and is also sufficient to block loop-extruding cohesin, reflecting how CTCF establishes TAD boundaries. CTCF functions asymmetrically, as predicted; however, CTCF is dependent on DNA tension. Moreover, CTCF regulates cohesin's loop-extrusion activity by changing its direction and by inducing loop shrinkage. Our data indicate that CTCF is not, as previously assumed, simply a barrier to cohesin-mediated loop extrusion but is an active regulator of this process, whereby the permeability of TAD boundaries can be modulated by DNA tension. These results reveal mechanistic principles of how CTCF controls loop extrusion and genome architecture.


Conflict of interest statement

The authors declare no competing interests.

Figures

Fig. 1
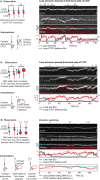
Fig. 1. CTCF is a directional barrier to cohesin diffusion on DNA.
a, Coomassie staining of recombinant CTCF after analysis using SDS–PAGE. Tetramethylrhodamine (TMR) was visualized by epi-green excitation. Gel source data are provided in Supplementary Fig. 1. b, Autoradiograph of EMSA. CTCF was incubated with a 32P-labelled DNA containing a CTCF-binding site. Where indicated, the reactions were supplemented with excess unlabelled competitors (comp.). dI-dC, poly(2′-deoxyinosinic-2′-deoxycytidylic acid); B, bound; U, unbound. Gel source data are provided in Supplementary Fig. 1. c, Example of TMR-labelled CTCF diffusing on DNA. Non-specifically bound CTCF molecules diffuse randomly and dissociate rapidly. At 5.5 min, a CTCF molecule binds to DNA and diffuses until encountering the CTCF-binding site at 6 min. Scale bar, 2 µm. The red arrow indicates the timepoint at which CTCF bleached or dissociated. d, Superposition of individual TMR-labelled CTCF-diffusion events. Events in which CTCF localized to its binding site at position 10452 bp (cyan tick) are shown in blue (n = 6). DNA-binding events in which CTCF did not localize to its binding site are shown in grey. n = 11. e, Illustration of the cohesin diffusion assay. f, Example of cohesin diffusion that is blocked by CTCF. Cohesin and CTCF were labelled with Alexa660 (red) and TMR (blue), respectively. Sytox Green DNA stain was introduced into the flow cell at the end of the experiment. Scale bar, 2 μm. g, The fraction of blocking events in which cohesin encountered CTCF or EcoRI(E111Q). Data are mean ± s.d. from 7 (n = 264) and 3 (n = 106) independent experiments, respectively. h, The fraction of blocked events in which cohesin diffused along the DNA between the tether point and the N-terminal (N term.) side of CTCF. Data are mean ± s.d. from 3 (n = 48) independent experiments. In the remaining 25% of events, cohesin diffused between the tether and the C-terminal side of CTCF. Sample sizes refer to biological replicates. Source Data
Fig. 2
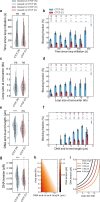
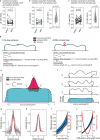
Fig. 2. CTCF is a direction- and tension-dependent barrier to cohesin-mediated DNA loop extrusion.
a,b, Examples of loop extrusion blocked by (a) or passing (b) CTCF (cyan) labelled with Janelia Fluor 646 (JF646). DNA loops (red) were visualized by Sytox Orange and perpendicular buffer flow. Scale bar, 2 µm. c, Cohesin-mediated DNA loop extrusion encountering N-terminally oriented JF646-labelled CTCF (cyan). Growth of DNA loop stops after encountering CTCF at around 30 s and around 50 s. Scale bar, 2 µm. d, The same as c, but for a passing event. CTCF passes into the loop at 70 s and translocates with it. Scale bar, 2 µm. e, The fraction of loop-extrusion events blocked after encountering N- or C-terminally oriented CTCF or dCas9. Data are mean ± 95% binomial confidence interval. n = 119, 115 and 19 from 13, 3 and 3 independent experiments for N-terminal, C-terminal and dCas9 encounters, respectively. The force range between 0.04 and 0.08 pN was best covered and was therefore chosen to compare the overall blocking efficiency (Extended Data Fig. 5c,d). f, The DNA tension at the moment of the encounter was calculated by the amount of DNA outside the loop and the DNA end-to-end length (Supplementary Note). g, The loop-extrusion blocking probability of N- or C-terminally oriented CTCF depends on DNA tension. Data are mean ± 95% binomial confidence interval. The solid lines are fits of the form 1 − exp(−F/F0), which were used to compute the force at which 100% blocking is achieved (N-terminal encounters: Pblock(F) = 147(1 − eF/0.125 pN); C-terminal encounters: Pblock(F) = 115(1 − eF/0.357 pN). n per bin for N-terminal (N) and C-terminal (C) encounters: 0–0.015 pN: 17 (N) and 12 (C); 0.015–0.026 pN: 75 (N) and 77 (C); 0.026–0.05 pN: 72 (N) and 53 (C); 0.05–0.072 pN: 89 (N) and 34 (C); 0.096–0.119 pN: 40 (N) and 6 (C); and 0.119–0.142 pN: 3 (N) and 0 (C). The bin for C-terminal encounters at the highest DNA tension regime is not shown owing to insufficient observations (n < 3). Sample sizes refer to biological replicates from 13 independent experiments for N-terminal encounters and 3 independent experiments for C-terminal encounters. Source Data
Fig. 3
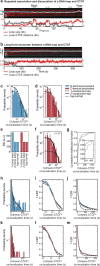
Fig. 3. CTCF changes the direction of cohesin-mediated loop extrusion or induces loop shrinkage, depending on the DNA tension.
a,b, Observation and interpretation illustrations (left) of kymographs of cohesin-mediated DNA loop extrusion encountering N-terminally oriented, JF646-labelled CTCF (cyan) (right). DNA loops (red) were visualized by Sytox Orange. Scale bars, 2 µm. In a, the growing loop encounters CTCF at 28 s. CTCF and the growing DNA loop move towards the lower DNA tether point, indicating extrusion on the side facing away from CTCF. In b, the growth of the DNA loop stops after encountering CTCF at around 29 s. The DNA loop shrinks after dissociation from CTCF at approximately 60 s. AU, arbitrary units. c, The fraction of loops extruding away from CTCF versus the DNA tension at the moment of encounter. Data are mean ± 95% binomial confidence interval; 13 independent experiments. d, The co-localization time of encounters between cohesin and the N terminus of CTCF. The fit denotes a two-component exponential distribution with rate constants k1 = 0.06 s−1 and k2 = 0.006 s−1 (τ1 ≈ 17 s and τ2 ≈ 167 s; data are from 13 independent experiments). The dashed lines represent the individual components of the two-component exponential distribution. The solid line represents the final two-component exponential distribution. e, The fraction of loops that shrink after release from CTCF versus DNA tension at the moment of encounter. Data are mean ± 95% binomial confidence interval; 13 independent experiments. Sample sizes refer to biological replicates. Source Data
Fig. 4
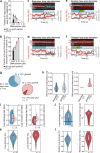
Fig. 4. DNA tension affects the outcome of CTCF–loop collisions.
At low DNA tension, CTCF is frequently incorporated into the growing DNA loop. At higher DNA tensions, CTCF promotes loop-extrusion direction switching, blocks loop extrusion and, at the highest DNA tensions, induces loop shrinkage.
Extended Data Fig. 1
Extended Data Fig. 1. Recombinant CTCF characterization.
a, Distance (kb) travelled by TMR labelled CTCF molecules while diffusing before encountering the CTCF binding site or dissociating. The thick line denotes the median; thin lines denote quartiles. N = 54. b, Diffusion coefficient of diffusing TMR labelled CTCF molecules. The thick line denotes the median; thin lines denote quartiles. N = 17. c, Position of DNA bound TMR labelled CTCF following a brief wash step. The CTCF binding site (cyan tick) is at position 10,452 bp out of 26,123 bp. N = 251. The orientation of the DNA was determined using end-labelling by TetR as shown in Extended Data Fig. 2f. d, Time trace of Alexa 660 (A660)-labelled CTCF signal bound at its DNA binding site bleaching in one step. e, Fluorescence intensity of A660 labelled CTCF signals at the CTCF binding site. N = 104. The thick line denotes the median; thin lines denote quartiles. f, Residence time of TMR labelled CTCF on DNA. The CTCF binding site (cyan tick) is at position 10,452 bp out of 26,123 bp. N = 140. g, Residence time of TMR-labelled CTCF on DNA from (f) plotted as a histogram. Bi-exponential decay curve was fitted using Prism. h-i, Coomassie staining of recombinant cohesin and NIPBL-MAU2 after SDS-PAGE. For gel source data, see Supplementary Fig. 1. j, Example of cohesin diffusion blocked by CTCF. Cohesin and CTCF were labelled with A660 and TMR, respectively. Sytox Green DNA stain was introduced into the flow cell at the end of the experiment. This data is identical to main Fig. 1f except it is formatted as a montage rather than as a kymograph. Source Data
Extended Data Fig. 2
Extended Data Fig. 2. Cohesin diffusion assay characterization.
a–d, Examples of cohesin diffusion on DNAs with CTCF bound at its binding site. Cohesin was labelled with Alexa 660 (red). CTCF was labelled with tetramethylrhodamine (TMR) (cyan). Sytox Green DNA stain was introduced into the flow cell at the end of the experiment. Scale bar, 2 μm. (a) Example of cohesin diffusion blocked by CTCF. (b) Example of cohesin diffusing past CTCF multiple times within the imaging timeframe. (c) Example of cohesin diffusing past CTCF in one direction only. Example of cohesin diffusing past CTCF in one direction only. This behaviour was observed very infrequently (2 ± 3% of N = 264 events). This could be because cohesin-CTCF encounters were recorded after the system has reached equilibrium and so all the single-pass events had occurred before we could image them. It is unknown why some cohesin molecules were able to pass CTCF multiple times (Extended Data Fig. 2b). (d) Example of cohesin-CTCF colocalization. e, Example of cohesin diffusing past TMR-labelled EcoRIE111Q. f, Positions of DNA bound (left) Janelia Fluor 646-labelled EcoRIE111Q and (right) TMR-labelled TetR, which were flowed into flow cells at the end of diffusion experiments to determine the DNA orientation and hence the orientation of the CTCF binding site at position 10,452 bp. EcoRI restriction sites were present at positions 2,177 bp and 12,802 bp out of 26,123 bp. N = 201. Six TetO sequences were present at positions 40–274 bp. N = 251. g, As in main Fig. 1f, except using a DNA in which the CTCF site was inverted. h, Fraction of blocked events that diffused on the DNA between the tether point and the N terminal side of CTCF using the DNA template as used in (g) (mean ± SD (N = 48) from 3 independent experiments). Source Data
Extended Data Fig. 3
Extended Data Fig. 3. HeLa CTCF characterization.
a, Coomassie staining of HeLa CTCF after SDS-PAGE. JF646 was visualized by epi-red excitation. For gel source data, see Supplementary Fig. 1. b, Position of DNA bound JF646-labelled CTCF following a wash step with a buffer supplemented with 220 nM Sytox Orange. The CTCF binding site (cyan tick) is at position 9,667 bp out of 31,767 bp. N = 251. c, Time trace of JF646-labelled CTCF signal bound at its DNA binding site bleaching in one step. d, Time trace of JF646-labelled CTCF signal bound at its DNA binding site bleaching in two steps. e, Fluorescence intensity of JF646-labelled CTCF signals at the CTCF binding site. The thick line denotes the median; thin lines denote quartiles. N = 16. f, Coomassie staining of HeLa cohesin after SDS-PAGE. For gel source data, see Supplementary Fig. 1. Source Data
Extended Data Fig. 4
Extended Data Fig. 4. Additional examples of loop extrusion blocking, passing and direction switching upon encountering CTCF.
a–c, (Left panels) observation and interpretation illustrations of (right panels) kymographs of cohesin-mediated DNA loop extrusion encountering N-terminally oriented CTCF (cyan) labelled with Janelia Fluor 646 (JF646). DNA loops were visualized by Sytox Orange stain. Scale bar, 2 µm. (a) Growth of the DNA loop stops upon encountering CTCF at timepoints ~ 12 – 18 s, 22 – 40 s and 82 – 95 s. (b) The DNA loop continues to grow upon encountering CTCF at 31 s, and CTCF passes into the loop and translocates with it. (c) The growing loop encounters CTCF at 28 s. CTCF and the growing DNA loop move towards the lower DNA tether point, indicating extrusion on the side facing away from CTCF.
Extended Data Fig. 5
Extended Data Fig. 5. Stalling force of cohesin and force sampling for encounters with the N-/C-terminus of CTCF and dCas9.
a, Combinatorial loop extrusion blocking efficiency at a pair of CTCF sites oriented in a convergent (><), tandem (>> and <<), and divergent (<>) manner. The percentages were obtained by multiplying the blocking probability of N- and C-terminal encounters in the force range 0.04-0.08 pN, as depicted in Fig. 2e, and normalizing to 100% (see Supplementary Note). Bar heights denote mean values. Error bars denote the error propagation after multiplication, given the 95% binomial confidence interval as depicted in Fig. 2e. The relative fraction of CTCF-anchored loops that we obtained from the single-molecule experiments are compared to published values extracted from Hi-C data,–. b, Stalling force of cohesin. horizontal line median; boxes extend to the quartiles and the whiskers show the range of the data (median-1.5* interquartile range (IQR); median+1.5*IQR). Data from 2 independent experiments. c, The DNA tension measured at encounters of loop-extruding cohesin with the N- and C-terminus of CTCF and dCas9. The stalling force values from panel (b) is shown for comparison. N = 297, 184, 37, 66 for CTCF (N), CTCF (C), dCas9 and the stalling force measurements, respectively. d, The empirical survival function (1-CDF) of the data shown in panel c. Thick line represents the mean; shaded areas represent 95% confidence intervals. At the DNA tension of complete stalling at the CTCF N-terminus, 0.14 pN, the survival function decays to 53 ± 16%, i.e. if loops would be halted by reaching the stalling force alone, one would expect ~53% of loops to exceed the DNA tension of 0.14 pN, which was not observed (compare blue line for stalling at the CTCF N-terminus and Fig. 2g). e, Ratio of the N-terminal and C-terminal blocking probabilities. N-terminal encounters block loop extrusion 3.6 ± 0.8 -fold (The bar height denotes the mean, error bars denote the error propagation after multiplication, given the 95% binomial confidence interval as depicted in Fig. 2g) more often than encounters from CTCF’s C-terminal side, independently of DNA tension. N per bin for N-terminal (n) and C-terminal (c) encounters: 0.025-0.0415 pN: 70 (n), 72 (c); 0.0415-0.058 pN: 81 (n), 67 (c); 0.058-0.075 pN: 84 (n), 30 (c); 0.075-0.091 pN: 20 (n), 14 (c); 0.091-0.1075 pN: 40 (n), 6 (c); 0.119-0.142 pN: 3 (n), 0 (c). Sample sizes refer to biological replicates. f, Fraction of blocked molecules in the cohesin diffusion assay as a function of DNA tension (note that the DNA tension is constant in diffusion assays since no DNA loop is being extruded). The bar height denotes the mean, error bars denote the error propagation after multiplication, given the 95% binomial confidence interval. g, DNA tension of DNA molecules on which diffusing cohesin was blocked by N-terminally oriented CTCF (left; N = 74 from 2 independent experiments) or by C-terminally oriented CTCF (right; N = 27 from 5 independent experiments). Statistical significance was assessed by a 2-sided 2-sample Kolmogorov-Smirnoff test. h, Violin plot of DNA tension for DNA molecules on which diffusing cohesin was blocked by CTCF (left; N = 161 from 7 independent experiments) or repeatedly passed CTCF (right; N = 88 from 7 independent experiments). Statistical significance was assessed by a 2-sample Kolmogorov-Smirnoff test. Thick horizontal lines on boxplots denote median values, the box extends from the lower to upper quartile values and whisker limits denote the range of data within 1.5 times the interquartile range from the median. Source Data
Extended Data Fig. 6
Extended Data Fig. 6. Effect of time since loop extrusion initiation, loop size, DNA end to end length and DNA tension on the loop extrusion blocking probability of CTCF.
a, Time since loop extrusion initiation and N-terminal (blue) and C-terminal (red) CTCF encounters for events which blocked (left part of violin, dark shading) and did not block loop extrusion (right part of violin, light shading). The horizontal line is the median; boxes extend to the quartiles and the whiskers show the range of the data (median-1.5* interquartile range (IQR); median+1.5*IQR). NTD: p = 0.14; CTD: p = 0.89. b, CTCF blocking fraction for N-terminal (blue) and C-terminal (red) encounters for binned times between loop initiation and CTCF encounter. The number of data points per bin is shown on top. Error bars on bar plots denote 95% confidence intervals. c,d, as for (a,b) but for the loop size at encounter (NTD: p = 0.08; CTD: p = 0.90). Error bars on bar plots denote 95% confidence intervals. e,f, as for (a, b) but for the DNA end-to-end length (NTD: p = 5.05 x 10⁻⁵; CTD: p = 0.09). Error bars on bar plots denote 95% confidence intervals. DNAs with a higher end-to-end length are under higher DNA tension due to entropic effects. g, as for (a) but for the DNA tension (NTD: p = 1.38 x 10⁻⁹; CTD: p = 0.02). For a binned representation of the CTCF blocking probability against DNA tension, see Fig. 2g. Thick horizontal lines on boxplots denote median values, the box extends from the lower to upper quartile values and whisker limits denote the range of data within 1.5 times the interquartile range from the median. Error bars on bar plots denote 95% confidence intervals. h, Calculated DNA tension for values of DNA end-to-end length and loop size. The colour scale shows white for DNA tension values of ≥ 0.15 pN (see Supplementary Information). i, Cross-sections through the two-dimensional representation in (h) for specific values of DNA end-to-end length. Even without an extruded loop (loop size = 0 kb), the tethering of the DNA to the surface at the given end-to-end lengths contributes to the DNA tension. For example, a 31.8 kb DNA construct tethered with an end-to-end length of 4 μm (black line) results in a DNA tension of ~0.07 pN. Statistical significance was assessed by a two-sided Mann-Whitney U test without multiple comparison adjustments.
Extended Data Fig. 7
Extended Data Fig. 7. The force-dependent step size of cohesin loop extrusion does not solely explain the observed force dependence of CTCF blocking loop extrusion.
a, Magnetic tweezers setup to observe individual loop extrusion steps by human cohesin, depending on the applied force, based on. The change in bead height Δz corresponds to steps by cohesin. b, Example magnet tweezer trace showing stepwise changes in bead height in the presence of cohesin, NIPBL-MAU2 and ATP. Line denotes steps fitted using the step-finding algorithm. c, Step sizes in nanometres as measured by Magnetic Tweezer experiments, for various applied forces ranging from 0.1 pN to 1 pN. The horizontal line is the median; boxes extend to the quartiles and the whiskers show the range of the data (median-1.5* interquartile range (IQR); median+1.5*IQR). N = 100, 128, 168, 116, 148, 338, 270 from left to right from 2 independent experiments. d, Step sizes versus force from (c), but converted to base pairs. The median, quartiles and data range are shown as described in (c). e, Simulation setup: starting from a randomly chosen binding position along DNA, cohesin takes steps along DNA, which are sampled from the measured step size distribution. An ‘encounter’ is considered if cohesin comes within 50 bp of CTCF. Under the lenient assumption that the CTCF N-terminus is unstructured and may be approximated by a freely jointed chain, its radius of gyration RG is estimated using the NK = 268 amino acids from the N-terminus to zinc finger 126, with a contour length of lK ~0.4 nm per amino acid, resulting in RG = NklK2/6 ~7 nm. This distance corresponds to roughly 20 bp, given the contour length of a basepair of 0.3 nm. A threshold of 50 bp was thus conservatively chosen because the CTCF N-terminus may be as long as 14 nm but is likely more compact due to folding of the CTCF N-terminus. The simulations thus likely represent an upper limit of the encounter probability. f, Simulated encounter probability of cohesin and CTCF (mean ± 95% binomial confidence interval; N = 500 independent simulations). Note that the encounter probability does not exceed ~40%, even at the smallest step size distribution (measured at 1 pN). In contrast, the blocking probability of N-terminal encounters of cohesin and CTCF increases from 0 to 100% within 0-0.14 pN (Fig. 2g). Force-dependent step sizes of cohesin can thus not solely explain the observed N-terminal blocking probability. We therefore suspect that DNA tension increases the blocking efficacy of CTCF by other mechanisms, such as by reducing not only cohesin’s step size but also the frequency with which it takes steps, thus providing more time for CTCF and cohesin to bind to each other; or by reducing thermal fluctuations of DNA, which could reduce the space that CTCF has to explore to find cohesin. It is also conceivable that cohesin’s ‘motor’ activity can overcome the low 1 µM binding affinity of CTCF-cohesin interactions more easily at low DNA tension than at high tensions, which are close to the stalling force of loop extrusion, and at which cohesin has to generate higher forces to extrude DNA. Finally, DNA tension could also change cohesin’s responsiveness to CTCF by influencing how cohesin performs loop extrusion. Source Data
Extended Data Fig. 8
Extended Data Fig. 8. Cohesin-CTCF residence time characterization.
a, Example of repeated approaching of CTCF (cyan) by cohesin, blocking of further loop extrusion and dissociation of the cohesin-CTCF interaction. Cohesin passes CTCF at the end of the kymograph. DNA loops (red) were visualized by Sytox Orange stain. Scale bar, 2 µm. b, Example of a growing loop encountering CTCF (cyan), stalling and co-localizing until the end of image acquisition. DNA loops (red) were visualized by Sytox Orange stain. Scale bar, 2 µm. c, Co-localization times of cohesin for the encounters from the N- and d, C-terminal side of CTCF (N = 147 and N = 51 for N- and C-terminal encounters, respectively). The distributions are fitted to a mono-exponential, bi-exponential and log-normal distribution. e, Bayesian Information Criterion (BIC) for the three models on N- and C-terminal encounters. Notably, both a bi-exponential as well as a log-normal distribution fit the distributions equally well. The parameters of the log-normal fits of the form (xσ√2π)−1 exp((ln(x)-μ)2/(2σ2)) are μ = 3 s, σ = 1.5 s for N-terminal and μ = 3 s, σ = 1.3 s for C-terminal encounters. f, The residence time of encounters between cohesin and CTCF’s C-terminus is well described by a bi-exponential distribution with rate constants k1 = 0.04 s−1 and k2 = 0.01 s−11 ~ 25 s and τ2 ~ 100 s). g, Cumulative distribution function of the cohesin-CTCF co-localization time for N- (blue) and C-terminal (red) encounters. Inset: magnified view of co-localization times ≥ 3 min. h, data from panel (c) on a linear x-axis. i, The data in panels (c) and (h) plotted as 1-CDF (Cumulative Distirbution Function) on a logarithmic x-axis. j, the data in panel (i) plotted on a linear x-axis. k–m, as panels (h–j) for encounters of cohesin with C-terminally oriented CTCF. Source Data
Extended Data Fig. 9
Extended Data Fig. 9. Characterization of direction switching and loop shrinkage following encounters between cohesin and CTCF or gold nanoparticles.
a, The fraction of loops extruding on the side facing away from CTCF (grey bars) or 30 nm gold nanoparticles (black bar; 14 ± 8% [mean ± 95% binomial confidence interval]). CTCF data is replotted from Fig. 3c. Encounters with gold nanoparticles over a force range of 0.02-0.05 pN were reanalysed from (N = 21 biological replicates from 2 independent experiments). b, The fraction of loops which shrink upon release from CTCF (grey bars) or 30 nm gold nanoparticles (black bar; 41 ± 10% [mean ± 95% binomial confidence interval]) versus DNA tension at the moment of encounter. CTCF data is replotted from Fig. 3e. Encounters with gold nanoparticles over a force range of 0.02-0.05 pN were reanalysed from (N = 22 biological replicates from 2 independent experiments). c-d, Examples of step-wise and e–f, continuous loop shrinkage upon dissociation of cohesin from CTCF. Scale bar, 2 µm. Related to Fig. 3b. g, The fraction of step-wise and continuous loop shrinkage for encounters from the N-terminal (blue) and C-terminal (red) side (mean ± 95% binomial confidence interval). h, DNA tension for loops which shrink step-wise or gradually. There is no statistically significant difference in DNA tension between the two modes (p > 0.05, 2-sided 2-sample Kolmogorov–Smirnov test). i, Loop shrinkage rate, in comparison to cohesin loop extrusion rate (grey), and j, distribution of shrinkage time spans. Black dots represent step-wise shrinkage events that happen within one imaging time interval, i.e. 0.4 s. k, Absolute and l, relative loop size decrease for N- and C-terminal encounters in blue and red, respectively. Thick horizontal lines on boxplots denote median values, the box extends from the lower to upper quartile values and whisker limits denote the range of data within 1.5 times the interquartile range from the median. Data for N-/C-terminal encounters were collected from 13 and 3 independent measurements, respectively. Source Data
Extended Data Fig. 10
Extended Data Fig. 10. The loop extrusion rate does not change after encounter of cohesin with CTCF.
a, Loop extrusion (LE) rate before and after encounter with N-terminally oriented CTCF when cohesin was blocked at CTCF and then switched extrusion direction to extrude away from it (see e.g. Fig. 3a and Supplementary Video 4). Statistical significance was assessed by a 2-sided Wilcoxon rank-sum test (mean ± SEM; N = 22). b, As for (a) but for events where cohesin passed over N-terminally oriented CTCF (mean ± SEM; N = 9). For events where the time between onset of LE and encounter with CTCF was too short to measure the LE rate, the LE rate was determined after passage and compared to the LE rate in the absence of CTCF (split violin plot on the right). For the latter, statistical significance was assessed by a 2-sided 2-sample Kolmogorov-Smirnoff test. c, as for (b) for events where cohesin passed over C-terminally oriented CTCF (mean ± SEM; N = 38). Error bars on individual data points denote the standard deviations of determined loop extrusion rates in moving 11-frame windows (4.4 s) during the duration of loop extrusion before encounter. Thick horizontal lines on boxplots denote median values, the box extends from the lower to upper quartile values and whisker limits denote the range of data within 1.5 times the interquartile range from the median. Sample sizes (N) refer to biological replicates from 13 independent experiments for N-terminal and 3 independent experiments for C-terminal encounters. d–j, Illustrations of loop size and DNA tension determination, and DNA tension error estimation (see Supplementary Note). (d) In the absence of loop extrusion, a DNA molecule of length L bp is tethered to a surface with end-to-end distance R. The relative DNA extension is thus computed as the ratio of the end-to-end distance R and the contour length of the entire DNA molecule. In the presence of an extruded DNA loop, the non-extruded part of the DNA is effectively shortened by the loop size Lloop, while the DNA inside the loop does not experience any tension in the absence of buffer flow. The relative extension is now computed as ratio of the (constant) end-to-end length R and the contour length of the non-extruded DNA, which has the size Lnonloop = L − Lloop. An increasing loop progressively shortens the non-extruded part of the DNA, giving rise to an increasing tension on the non-extruded DNA due to a fixed end-to-end length R. (e) Illustration of the DNA intensity profile along its long axis. The DNA intensity appears slightly larger than its real end-to-end length due to convolution of the DNA intensity with the microscope point spread function, which is corrected for by the peak peeling algorithm to determine the DNA end-to-end length. The lead intensity is determined as the integrated intensity between one of the DNA ends and the loop position (which corresponds to the peak position of the looped DNA intensity. A 7-pixel window around the loop position is summed and corrected by the intensity contributing in this window from the non-extruded DNA. However, the loop intensity is underestimated due to truncation of the integration outside the range [xloop − w/2, xloop + w/2] (yellow area). (f) At low end-to-end length, the flexibility of DNA might yield a DNA intensity beyond the DNA’s tether points. (g) Cross-sections around point-emitters (grey; N = 15) centred at their maximum value and mean trace (red). (h) Gaussian fits the single traces (grey) and mean fit (red) centred at their maximum value. The average Gaussian width was found to be σ = 180 ± 13 nm. (i) DNA tension with absolute (black line and blue area correspond to mean and error of the DNA tension) and relative (red) error of the DNA tension over loop sizes from Lloop = 0 to 10 kb at fixed end-to-end length R = 3.5 μm. Error bars denote the estimated error, also represented as a red line on the right y-axis. (j) Analogous to (i) for a fixed loop size of Lloop = 5 kb and varying end-to-end length R. Error bars denote the estimated error, also represented as a red line on the right y-axis. Source Data

Comment in

  • CTCF works better under tension.
    Heinke L. Heinke L. Nat Rev Mol Cell Biol. 2023 Jun;24(6):379. doi: 10.1038/s41580-023-00614-x. Nat Rev Mol Cell Biol. 2023. PMID: 37161005 No abstract available.

Similar articles

Cited by

References

    1. Davidson IF, Peters JM. Genome folding through loop extrusion by SMC complexes. Nat. Rev. Mol. Cell Biol. 2021;22:445–464. doi: 10.1038/s41580-021-00349-7. - DOI - PubMed
    1. Nora EP, et al. Targeted degradation of CTCF decouples local insulation of chromosome domains from genomic compartmentalization. Cell. 2017;169:930–944. doi: 10.1016/j.cell.2017.05.004. - DOI - PMC - PubMed
    1. Wutz G, et al. Topologically associating domains and chromatin loops depend on cohesin and are regulated by CTCF, WAPL, and PDS5 proteins. EMBO J. 2017;36:3573–3599. doi: 10.15252/embj.201798004. - DOI - PMC - PubMed
    1. Ba Z, et al. CTCF orchestrates long-range cohesin-driven V(D)J recombinational scanning. Nature. 2020;586:305–310. doi: 10.1038/s41586-020-2578-0. - DOI - PMC - PubMed
    1. Hill L, et al. Wapl repression by Pax5 promotes V gene recombination by Igh loop extrusion. Nature. 2020;584:142–147. doi: 10.1038/s41586-020-2454-y. - DOI - PMC - PubMed

Publication types