. 2023 May;617(7960):351-359.
doi: 10.1038/s41586-023-05964-2. Epub 2023 Apr 19.

A somato-cognitive action network alternates with effector regions in motor cortex

Affiliations

A somato-cognitive action network alternates with effector regions in motor cortex

Evan M Gordon et al. Nature. 2023 May.

Abstract

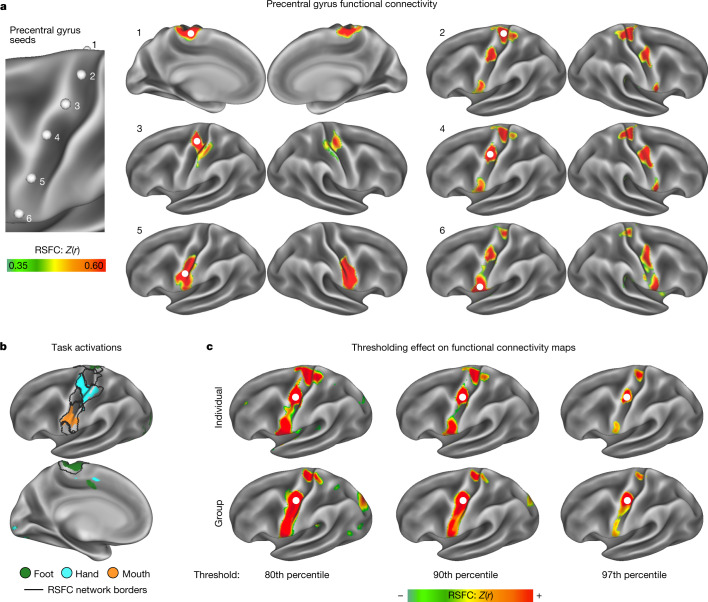
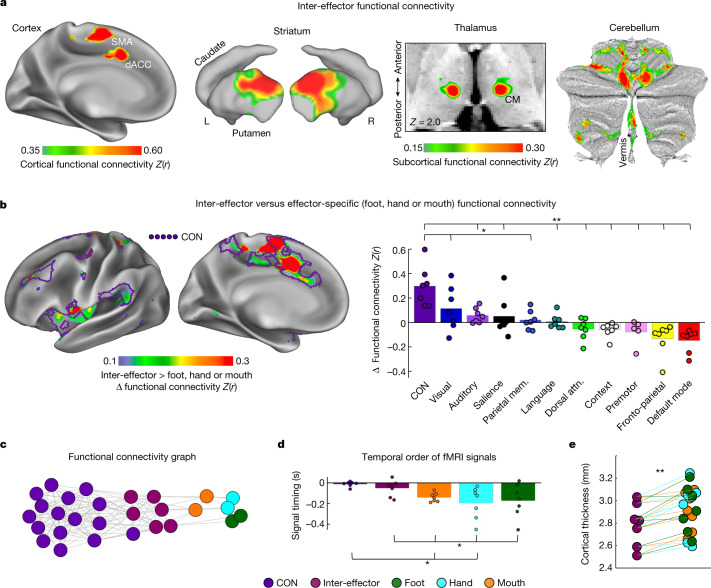
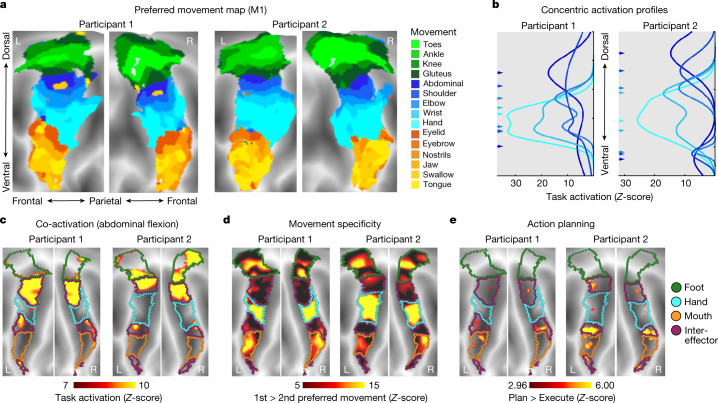
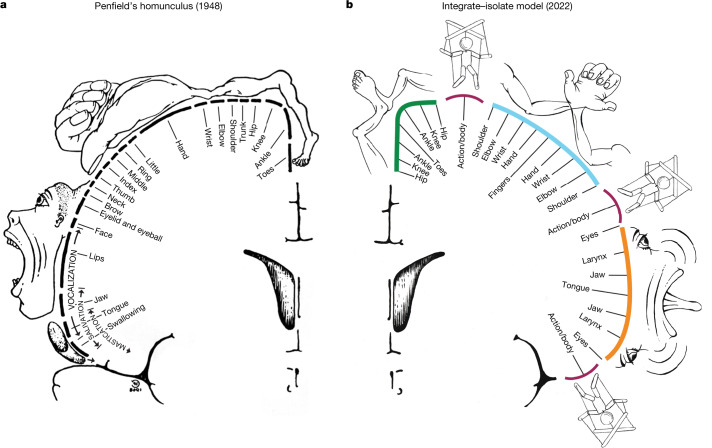
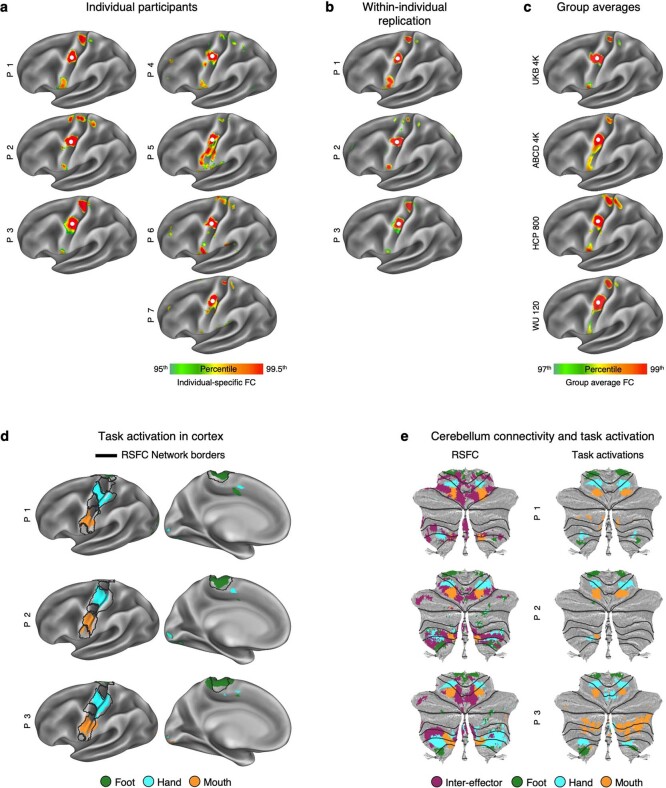
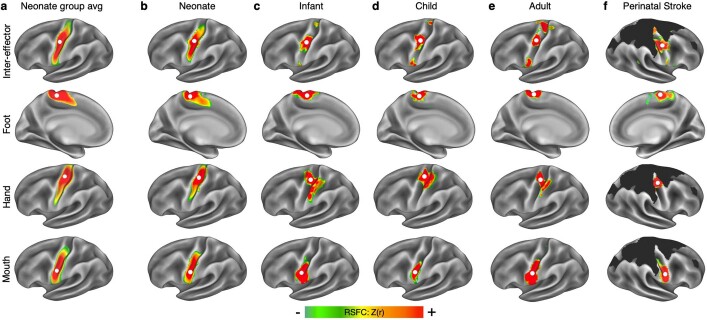
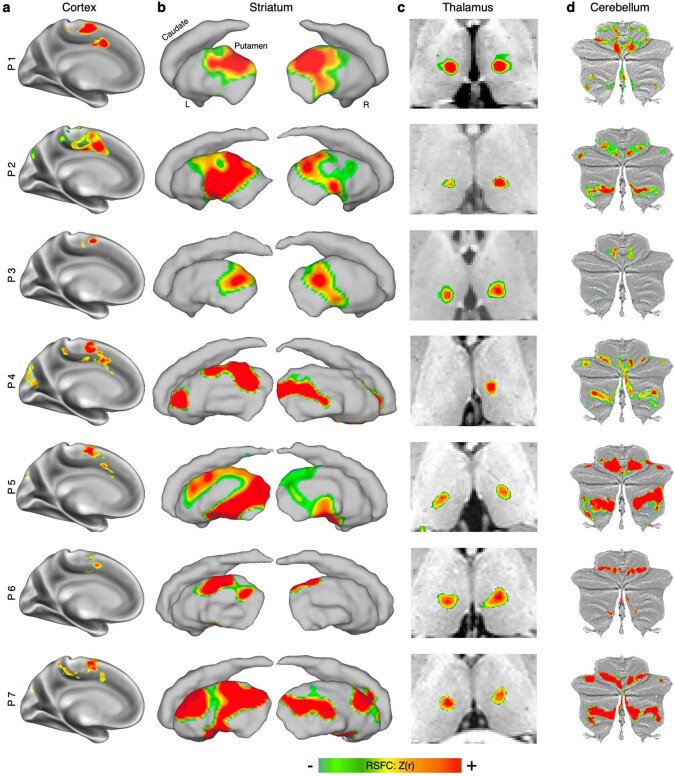
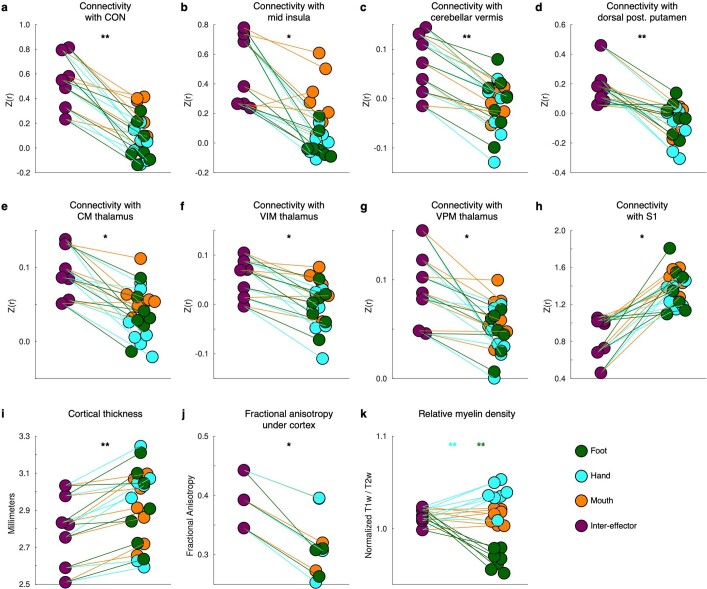
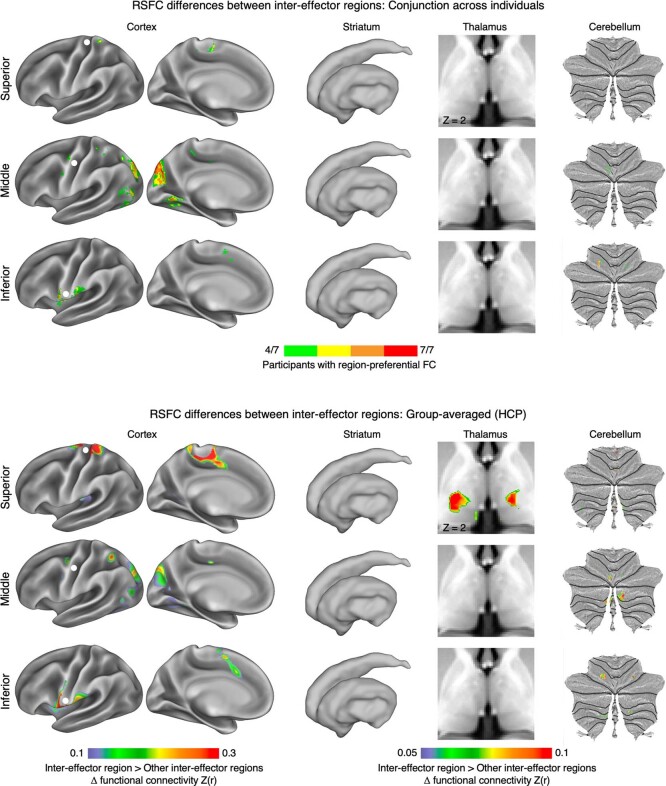
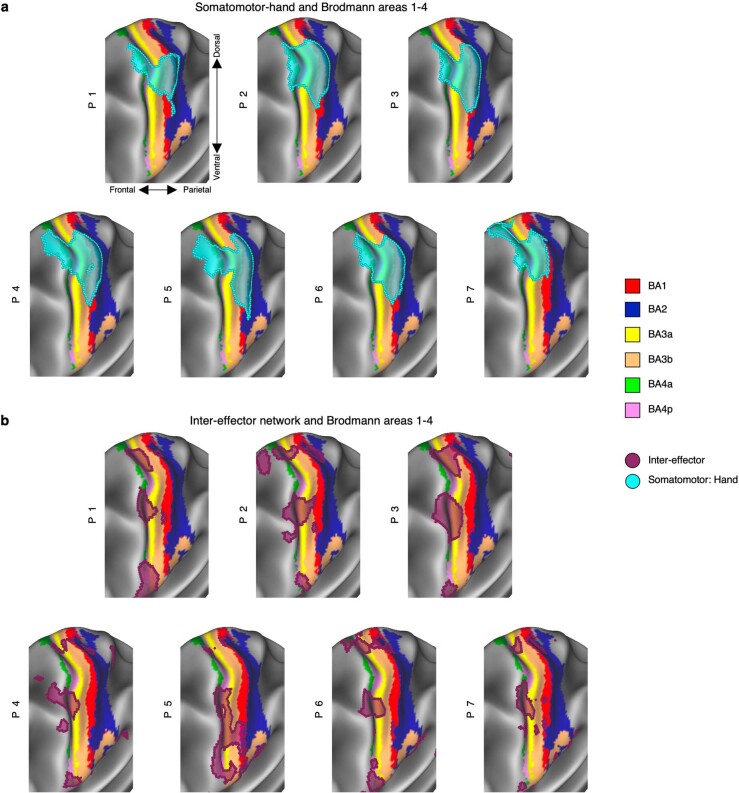
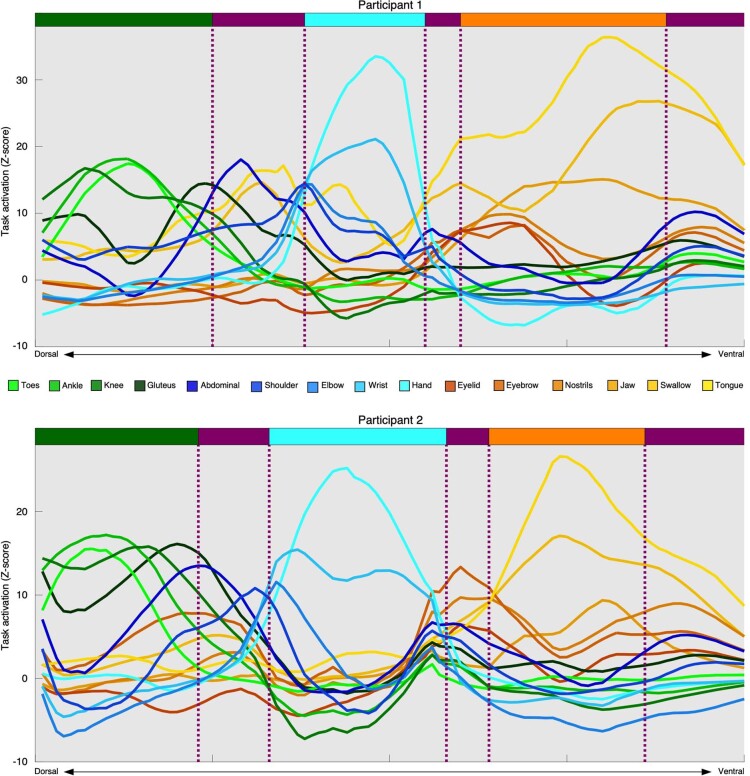
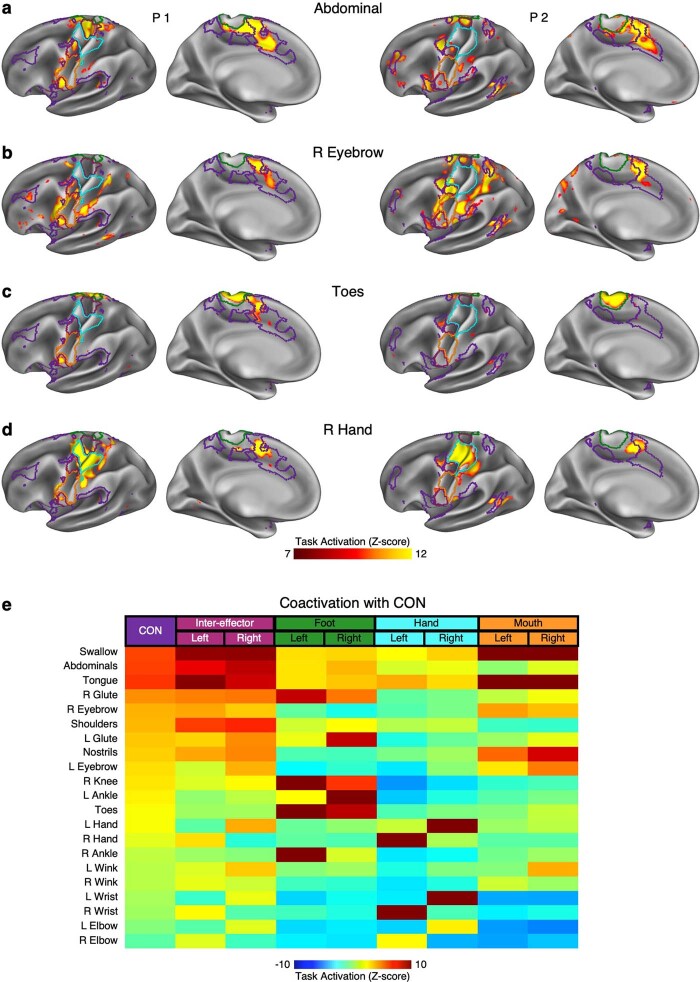
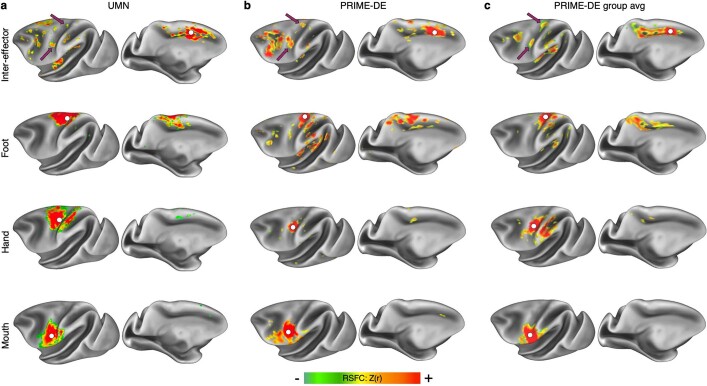
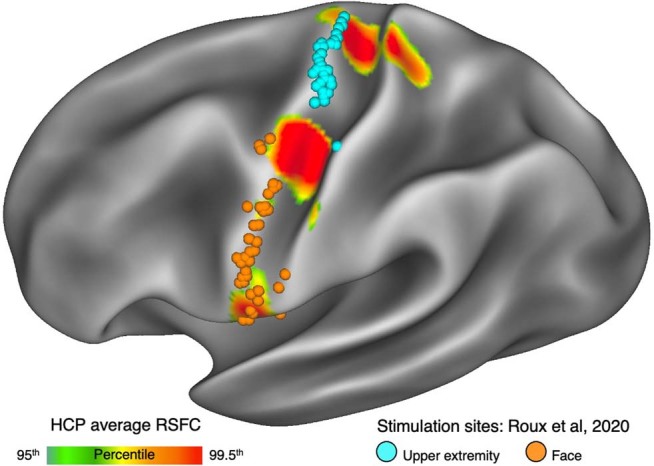
Motor cortex (M1) has been thought to form a continuous somatotopic homunculus extending down the precentral gyrus from foot to face representations1,2, despite evidence for concentric functional zones3 and maps of complex actions4. Here, using precision functional magnetic resonance imaging (fMRI) methods, we find that the classic homunculus is interrupted by regions with distinct connectivity, structure and function, alternating with effector-specific (foot, hand and mouth) areas. These inter-effector regions exhibit decreased cortical thickness and strong functional connectivity to each other, as well as to the cingulo-opercular network (CON), critical for action5 and physiological control6, arousal7, errors8 and pain9. This interdigitation of action control-linked and motor effector regions was verified in the three largest fMRI datasets. Macaque and pediatric (newborn, infant and child) precision fMRI suggested cross-species homologues and developmental precursors of the inter-effector system. A battery of motor and action fMRI tasks documented concentric effector somatotopies, separated by the CON-linked inter-effector regions. The inter-effectors lacked movement specificity and co-activated during action planning (coordination of hands and feet) and axial body movement (such as of the abdomen or eyebrows). These results, together with previous studies demonstrating stimulation-evoked complex actions4 and connectivity to internal organs10 such as the adrenal medulla, suggest that M1 is punctuated by a system for whole-body action planning, the somato-cognitive action network (SCAN). In M1, two parallel systems intertwine, forming an integrate-isolate pattern: effector-specific regions (foot, hand and mouth) for isolating fine motor control and the SCAN for integrating goals, physiology and body movement.


Conflict of interest statement

D.A.F., N.U.F.D. and N.A.S. have a financial interest in Turing Medical Inc. and may benefit financially if the company is successful in marketing FIRMM motion monitoring software products. A.N.V., D.A.F. and N.U.F.D. may receive royalty income based on FIRMM technology developed at Washington University School of Medicine and Oregon Health and Sciences University and licensed to Turing Medical Inc. D.A.F. and N.U.F.D. are co-founders of Turing Medical Inc. These potential conflicts of interest have been reviewed and are managed by Washington University School of Medicine, Oregon Health and Sciences University and the University of Minnesota. N.A.S. is now an employee of Turing Medical Inc. C.M.S receives research support from Sage Therapeutics. C.L. is listed as an inventor for Cornell University patent applications on neuroimaging biomarkers for depression that are pending or in preparation. C.L. has served as a scientific advisor or consultant to Compass Pathways PLC, Delix Therapeutics, Magnus Medical and Brainify.AI. The other authors declare no competing interests.

Figures

Fig. 1
Fig. 1. Precision functional mapping of primary motor cortex.
a, RSFC seeded from a continuous line of cortical locations in the left precentral gyrus in a single exemplar participant (P1; 356 min resting-state fMRI). The six exemplar seeds shown represent all distinct connectivity patterns observed (see Supplementary Video 1 for complete mapping). Functional connectivity seeded from these locations illustrated classical M1 connectivity of regions representing the foot (1), hand (3) and mouth (5), as well as an interdigitated set of strongly interconnected regions (2, 4 and 6). See Extended Data Fig. 1a and Supplementary Video 2 for all highly sampled participants, Extended Data Fig. 1b for within-participant replications, and Extended Data Fig. 1c for group-averaged data. b, Discrete functional networks were demarcated using a whole-brain, data-driven, hierarchical approach (Methods) applied to the resting-state fMRI data, which defined the spatial extent of the networks observed in Fig. 1 (black outlines). Regions defined by RSFC were functionally labelled using a classic block-design fMRI motor task involving separate movement of the foot, hand and tongue (following ref. ; see ref. for details). The map illustrates the top 1% of vertices activated by movement of the foot, hand and mouth in the exemplar participant (P1; see Extended Data Fig. 1d for other participants). c, The inter-effector connectivity pattern became more distinct from surrounding effector-specific motor regions as connectivity thresholding increased from the 80th to the 97th percentile. RSFC thresholds required to detect the inter-effector pattern were lower in individual-specific data (top) than in group-averaged data (bottom; ABCD study, n = 3,928).
Fig. 2
Fig. 2. Functional connectivity and cortical thickness of the M1 inter-effector motif.
a, Brain regions with the strongest functional connectivity to the left middle inter-effector region (exemplar seed) in cortex, striatum, thalamus (horizontal slice; CM nucleus) and cerebellum (flat map) in the exemplar participant (P1). See Extended Data Fig. 3 for other participants. b, Left, brain regions more strongly functionally connected to inter-effectors than to any foot, hand or mouth regions (P1; Supplementary Fig. 2a for other participants). Purple outlines show the CON (individual-specific). Central sulcus is masked as it exhibits large differences by definition. Right, connectivity was calculated between every network and both the inter-effector and effector-specific M1 regions. The plot shows the smallest difference between inter-effector and any effector-specific connectivity, averaged across participants. This difference was larger for CON than for any other network (two-tailed paired t-tests, *P < 0.05, FDR-corrected; **P < 0.01, FDR-corrected). Coloured circles represent individual participants. c, Inter-network relationships visualized in network space using a spring-embedding plot, in which connected regions are pulled together and disconnected regions are pushed apart. Connecting lines indicate a functional connection (Z(r) > 0.2) (P1; see Supplementary Fig. 2b for all participants). d, Inter-effector and effector-specific regions were tested for systematic differences in the temporal ordering of their infra-slow fMRI signals (<0.1 Hz). The plot shows signal ordering in CON, inter-effector and effector-specific regions, averaged across participants (standard error bars; two-tailed paired t-test *P < 0.05, uncorrected). Coloured circles represent individual participants. Prior electrophysiology work suggests that later infra-slow activity (here, CON) corresponds to earlier delta-band (0.5–4 Hz) activity. e, In each participant (filled circles), inter-effector regions exhibited lower cortical thickness than all effector-specific regions (two-tailed paired t-test **P ≤ 0.01, FDR-corrected). Attn., attention; mem., memory.
Fig. 3
Fig. 3. Individual-specific task activations in M1.
a, Task fMRI activations (P1 and P2) during a movement task battery, including movement of the toes, ankles, knees, gluteus, abdominals, shoulders, elbows, hands, eyebrows, eyelids, tongue and swallowing (244 min per participant). Each cortical vertex is coloured according to the movement that elicited the strongest task activation (winner takes all) and is shown on a flattened representation of the cortical surface. Background shading indicates sulcal depths. b, Activation strength for each movement was computed along the dorsal–ventral axis within M1. A two-peak Gaussian curve was fitted to each movement activation (Methods). Fitted curves are shown for movement of abdominals, shoulder, elbow, wrist and hand. Peak locations (arrows on left) were arranged concentrically around the hand peak. See Extended Data Fig. 7 and Supplementary Fig. 4 for all movements. c, Inter-effector regions were co-activated during abdominal contraction. d, Inter-effector regions exhibited more generalized evoked activity during movements. Movement specificity was computed as the activation difference between the first- and second-most preferred movements for the six conditions that most activated each discrete region (toes, abdominal, hand, eyelid, tongue and swallowing). e, Event-related task fMRI data during an action planning task with separate planning and execution phases for movements of the hands and feet (Methods). M1 activity in the planning phase was higher than in the execution phase in the inter-effector but not the effector-specific regions.
Fig. 4
Fig. 4. The interrupted homunculus, an integrate–isolate model of action and motor control.
a, Penfield’s classical homunculus (adapted from ref. ), depicting a continuous map of the body in primary motor cortex. b, In the integrate–isolate model of M1 organization, effector-specific—foot (green), hand (cyan) and mouth (orange)—functional zones are represented by concentric rings with proximal body parts surrounding the relatively more isolatable distal ones (toes, fingers and tongue). Inter-effector regions (maroon) sit at the intersecting points of these fields, forming part of a somato-cognitive action network for integrative, allostatic whole-body control. As with Penfield’s original drawing, this diagram is intended to illustrate organizational principles, and must not be over-interpreted as a precise map.
Extended Data Fig. 1
Extended Data Fig. 1. Consistency of the inter-effector motif across datasets.
Connectivity patterns seeded from a continuous line down the left precentral gyrus revealed that the interleaved motor functional connectivity pattern was consistent across a, seven highly-sampled individual participants (172–356 min of data); b, replication data (416–1,114 min) collected in P1–P3; and c, multiple independent sets of group data averaged across cohorts of varying size. Here, functional connectivity is shown seeded from the middle inter-effector region for each individual participant and group-averaged dataset (see Supplementary Video 2 for all seeds). Thresholds for connectivity maps were scaled to the 95th percentile of map values in individuals, and to the 97th percentile of values in groups, to account for differences in data acquisition and processing strategies across datasets. d, Discrete functional networks were demarcated within each subject in M1 and S1 using a whole-brain, data-driven hierarchical approach applied to the resting-state fMRI data (see Fig. S7), which defined the spatial extent of the networks observed in Fig. 1 (black outlines). In P1-P3, regions defined by resting state functional connectivity (RSFC) were functionally labeled using a classic block-design fMRI motor task involving separate movement of the foot, hand, and tongue (following; see for details). The map illustrates the top 1% of vertices activated by movement of the foot (green), hand (cyan), and mouth (orange). e, Left: preferential connectivity of each motor division to the cerebellum. Right: activations during the fMRI motor task described in panel d. The map illustrates the top 5% of vertices within cerebellum active during movement of the foot (green), hand (cyan), and mouth (orange).
Extended Data Fig. 2
Extended Data Fig. 2. Motor cortex functional connectivity in pediatric participants and perinatal stroke.
Functional connectivity maps were seeded from a continuous line of points down precentral gyrus in fMRI data from a, data averaged across 262 human neonates, all scanned shortly after birth; b, a neonate scanned 13 days after birth; c, an 11-month old infant; d, a 9-year old child; e, adult participant P1 (from Fig. 1); and f, an adolescent who had experienced extensive cortical reorganization after severe bilateral perinatal strokes (destroyed cortex in black). Right hemisphere is shown in the stroke patient because left hemisphere M1 was entirely lost. Example seed maps shown here illustrate observed inter-effector (row 1) and effector-specific connectivity (rows 2-4). Inter-effector and effector-specific regions exhibited clear boundaries within M1 in the infant, child, the adults, and the stroke patient, but not in the neonates. Visualization thresholds varied between Z(r)> 0.3 and Z(r)> 0.5 across datasets due to differences in data collection and processing, as well as differences inherent to the populations.
Extended Data Fig. 3
Extended Data Fig. 3. Whole brain functional connectivity of inter-effector motif across participants.
Brain regions with the strongest functional connectivity to the middle inter-effector region in a, medial cortex, b, striatum (lateral view of left and right striatum), c, thalamus (axial view), and d, cerebellum. Functional connectivity values are thresholded at Z(r) > 0.35 in cortex. Subcortical functional connectivity values are thresholded at different levels in each subject due to variation in subcortical signal-to-noise ratios across individuals. Thresholds were chosen to illustrate the strongest subcortical connections. Specific thresholds shown here: P1 - Z(r) > 0.15; P3, 4, 6, 7 - Z(r) > 0.1; P2 - Z(r) > 0.04; P5 - Z(r) > 0.03.
Extended Data Fig. 4
Extended Data Fig. 4. Functional connectivity and structural MRI metrics of motor cortex regions.
In each individual participant, measures derived from each of the foot, hand, mouth, and inter-effector motor regions. Colored lines connect the same participant’s inter-effector and effector-specific regions for ease of comparison. a, Functional connectivity strength Z(r) between M1 region and individual-specific Cingulo-Opercular Network (CON). b, Functional connectivity between M1 region and middle insula. c, Functional connectivity with Lobule VIIIa vermis of the cerebellum. d, Functional connectivity between M1 region and dorsal posterior putamen. e—g, Functional connectivity between M1 region and nuclei of the thalamus: e, Centromedian nucleus; f, Ventral Intermediate nucleus; g, Ventral Posteromedial nucleus. h, Functional connectivity between M1 region and adjacent postcentral gyrus (S1). i, Cortical thickness in M1 region. j, Fractional Anisotropy within 2 mm below cortex under M1 region. k, Intracortical myelin, indexed by the T1/T2 ratio and normalized across cortex, within cortex of M1 region. All significance values reflect significance across three two-sided paired t-tests (inter-effector vs foot, vs hand, and vs mouth). * P < 0.05; ** P < 0.01; *** P < 0.001, FDR-corrected.
Extended Data Fig. 5
Extended Data Fig. 5. Differences in functional connectivity between inter-effector regions.
Brain regions more strongly connected to the superior inter-effector region than to either of the other two (top row); relatively most strongly connected to the middle inter-effector region (middle row); and relatively most strongly connected to the inferior inter-effector region, in cortex (left), striatum, thalamus, and cerebellum (right), a, in at least 50% of individuals (n = 7) and b, in group-averaged data from the Human Connectome Project (HCP; n = 812). Thresholds used are the same as in Fig. 2b. Note that central sulcus regions are masked as they exhibit large differences by definition. See Fig. S3 for all individual participants.
Extended Data Fig. 6
Extended Data Fig. 6. Effector-specific and inter-effector and regions in pre- and postcentral gyrus.
In every participant, Brodmann Areas (BAs) in M1 (BAs 4a, 4p) and S1 (BAs 1, 2, 3a, 3b) are displayed on the cerebral cortex, tilted around the Y- and Z-axes to show S1. Overlaid are a, the somatomotor-hand region, and b, the inter-effector regions.
Extended Data Fig. 7
Extended Data Fig. 7. Primary motor cortex activation profiles for movement task battery.
In two participants (top, bottom), LOWESS curves were fit to the task activation profiles at each dorsal-ventral point in M1, for each separate movement (colored lines). Colored blocks (top) show the effector-specific foot (green), hand (cyan), and mouth (orange) areas of M1, as well as the inter-effector regions (maroon); dotted maroon lines show the boundaries between regions. The centers of effector-specific regions are characterized by strong activations for movements of the most distal body parts, and deactivations for all other movements. Inter-effector regions, by contrast, exhibited moderate activations for most movements.
Extended Data Fig. 8
Extended Data Fig. 8. Effector-specificity of task fMRI activations.
In each participant, in the a, abdominal flexure task and the b, eyebrow raising task, the inter-effector regions and cingulo-opercular network (CON) were active. By contrast, in c, toe and d, hand motion tasks, activation was much more specific to a single region of somatomotor cortex. e, Across tasks, the degree of CON activation was consistently similar to the activation of the inter-effector regions (correlation between CON and inter-effector activations: all Pearson’s r > 0.81, P < 10−5, FDR corrected), but not consistently to hand (CON vs hand: Pearson’s r > 0.05, P < 0.82) or foot (CON vs foot: Pearson’s r > 0.33, P < 0.13) regions, and more weakly to mouth regions (CON vs mouth: Pearson’s r > 0.61, P < 0.003). Illustrated activation values are averaged across participants and ordered based on CON activation.
Extended Data Fig. 9
Extended Data Fig. 9. Motor Cortex functional connectivity in non-human primates.
Functional connectivity maps were seeded from dorsal anterior cingulate cortex (top row), as well as from a continuous line of points down anterior central sulcus (rows 2-4), in fMRI data from a, an individual macaque scanned for 77 min on a 10.5T MRI scanner; b, an individual macaque scanned for 53 min on a 3T scanner; and c, group-averaged data from eight macaques each scanned for 53 min on a 3T scanner. The dorsal anterior cingulate seed demonstrated connectivity to frontal, insular, and parietal regions homologous with the human CON, as well as with two regions in anterior central sulcus (maroon arrows). These central sulcus regions are thought to correspond to areas that project to internal organs and represent possible macaque homologues of the inter-effector regions. The central sulcus seeds demonstrated connectivity patterns corresponding to the known functional divisions between M1 regions representing the foot (second row), hand (third row), and face (bottom row).
Extended Data Fig. 10
Extended Data Fig. 10. Somato-Cognitive Action Network regions in human cortical surface stimulation data.
The map of somato-cognitive action network (SCAN) regions was compared with published movements evoked by direct cortical surface stimulation. Cortical map: functional connectivity is shown seeded from the middle SCAN region and averaged across all subjects in the HCP dataset (n = 812; see also Extended Data Fig. 1c). Stimulation locations: MNI coordinates of surface stimulation location, and the resulting evoked movement, from 100 patients undergoing awake surgical brain mapping were reported in. Each stimulation location evoking movement was mapped to the nearest cortical vertex on a group-averaged pial surface. Stimulation sites are colored according to whether they evoked facial movements (orange) or upper extremity movements (cyan). Stimulation sites evoking movement did not overlap with the central inter-effector region.

Comment in

References

    1. Penfield W, Boldrey E. Somatic motor and sensory representation in the cerebral cortex of man as studied by electrical stimulation. Brain. 1937;60:389–443. doi: 10.1093/brain/60.4.389. - DOI
    1. Penfield, W. & Rasmussen, T. The Cerebral Cortex of Man; A Clinical Study of Localization of Function. xv, 248 (Macmillan, 1950).
    1. Kwan HC, MacKay WA, Murphy JT, Wong YC. Spatial organization of precentral cortex in awake primates. II. Motor outputs. J. Neurophysiol. 1978;41:1120–1131. doi: 10.1152/jn.1978.41.5.1120. - DOI - PubMed
    1. Graziano MSA. Ethological action maps: a paradigm shift for the motor cortex. Trends Cogn. Sci. 2016;20:121–132. doi: 10.1016/j.tics.2015.10.008. - DOI - PubMed
    1. Dosenbach NUF, et al. A core system for the implementation of task sets. Neuron. 2006;50:799–812. doi: 10.1016/j.neuron.2006.04.031. - DOI - PMC - PubMed

Publication types

Grants and funding