

A ketogenic diet alters mTOR activity, systemic metabolism and potentially prevents collagen degradation associated with chronic alcohol consumption in mice
- PMID: 37076659
- PMCID: PMC10115735
- DOI: 10.1007/s11306-023-02006-w
A ketogenic diet alters mTOR activity, systemic metabolism and potentially prevents collagen degradation associated with chronic alcohol consumption in mice
Abstract
Introduction: A ketogenic diet (KD), which is a high fat, low carbohydrate diet has been shown to inhibit the mammalian target of rapamycin (mTOR) pathway and alter the redox state. Inhibition of the mTOR complex has been associated with the attenuation and alleviation of various metabolic and- inflammatory diseases such as neurodegeneration, diabetes, and metabolic syndrome. Various metabolic pathways and signalling mechanisms have been explored to assess the therapeutic potential of mTOR inhibition. However, chronic alcohol consumption has also been reported to alter mTOR activity, the cellular redox- and inflammatory state. Thus, a relevant question that remains is what effect chronic alcohol consumption would have on mTOR activity and overall metabolism during a KD-based intervention.
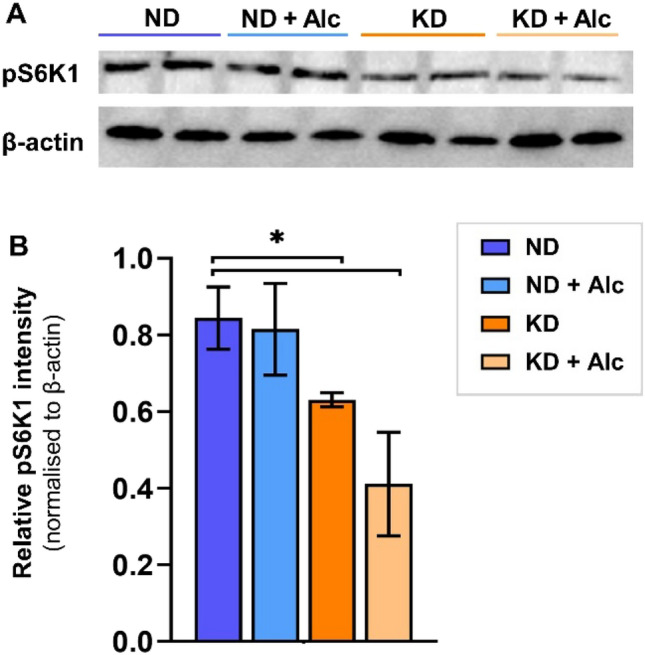
Objectives: The aim of this study was to evaluate the effect of alcohol and a KD on the phosphorylation of the mTORC1 target p70S6K, systemic metabolism as well as the redox- and inflammatory state in a mouse model.
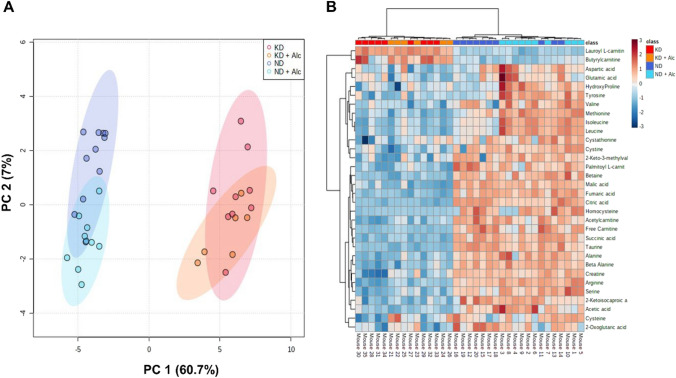
Methods: Mice were fed either a control diet with/without alcohol or a KD with/without alcohol for three weeks. After the dietary intervention, samples were collected and subjected towards western blot analysis, multi-platform metabolomics analysis and flow cytometry.
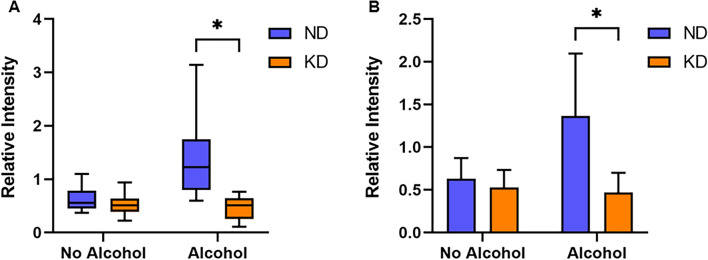
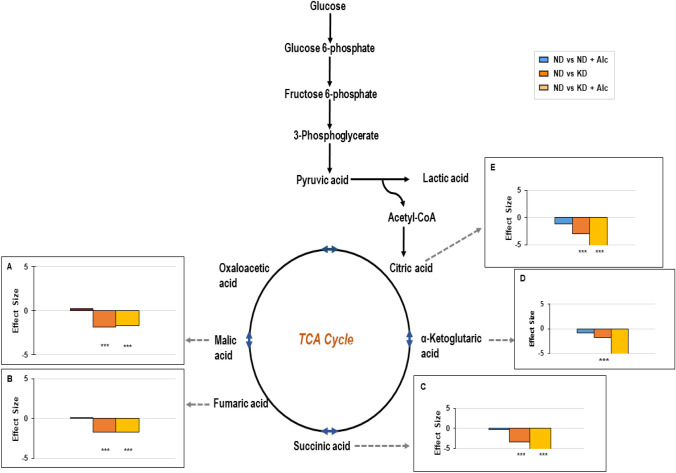
Results: Mice fed a KD exhibited significant mTOR inhibition and reduction in growth rate. Alcohol consumption alone did not markedly alter mTOR activity or growth rate but moderately increased mTOR inhibition in mice fed a KD. In addition, metabolic profiling showed alteration of several metabolic pathways as well as the redox state following consumption of a KD and alcohol. A KD was also observed to potentially prevent bone loss and collagen degradation associated with chronic alcohol consumption, as indicated by hydroxyproline metabolism.
Conclusion: This study sheds light on the influence that a KD alongside alcohol intake can exert on not just mTOR, but also their effect on metabolic reprogramming and the redox state.
Keywords: Ketogenic diet; Metabolic reprogramming; Metabolomics; Mtor; Redox; Western blot.
© 2023. The Author(s).
Conflict of interest statement
The authors declare no conflict of interest.
Figures


Similar articles
-
Ketogenic diet induces autophagy to alleviate bleomycin-induced pulmonary fibrosis in murine models.Exp Lung Res. 2021 Feb;47(1):26-36. doi: 10.1080/01902148.2020.1840667. Epub 2020 Oct 29. Exp Lung Res. 2021. PMID: 33121292
-
Ketogenic diet delays the phase of circadian rhythms and does not affect AMP-activated protein kinase (AMPK) in mouse liver.Mol Cell Endocrinol. 2015 Dec 5;417:124-30. doi: 10.1016/j.mce.2015.09.012. Epub 2015 Sep 25. Mol Cell Endocrinol. 2015. PMID: 26408964
-
Ketogenic diet administration to mice after a high-fat-diet regimen promotes weight loss, glycemic normalization and induces adaptations of ketogenic pathways in liver and kidney.Mol Metab. 2022 Nov;65:101578. doi: 10.1016/j.molmet.2022.101578. Epub 2022 Aug 20. Mol Metab. 2022. PMID: 35995402 Free PMC article.
-
Ketogenic diets and protective mechanisms in epilepsy, metabolic disorders, cancer, neuronal loss, and muscle and nerve degeneration.J Food Biochem. 2020 Mar;44(3):e13140. doi: 10.1111/jfbc.13140. Epub 2020 Jan 14. J Food Biochem. 2020. PMID: 31943235 Review.
-
The ketogenic diet as a therapeutic intervention strategy in mitochondrial disease.Int J Biochem Cell Biol. 2021 Sep;138:106050. doi: 10.1016/j.biocel.2021.106050. Epub 2021 Jul 21. Int J Biochem Cell Biol. 2021. PMID: 34298163 Review.
Cited by
-
Paradoxical mTORC1-Dependent microRNA-mediated Translation Repression in the Nucleus Accumbens of Male Mice Consuming Alcohol Attenuates Glycolysis.Nat Commun. 2025 Jul 14;16(1):6116. doi: 10.1038/s41467-025-60337-9. Nat Commun. 2025. PMID: 40659615 Free PMC article.
References
-
- American Veterinary Medical Association. AVMA guidelines for the euthanasia of animals: 2020 edition, https://www.avma.org/sites/default/files/2020-02/Guidelines-on-Euthanasi...; 2020 [accessed: 12 April 2020]
-
- Bisschop PH, Sain-van der Velden MGM, Stellaard F, Kuipers F, Meijer AJ, Sauerwein HP, Romijn JA. Dietary Carbohydrate deprivation increases 24-hour nitrogen excretion without affecting postabsorptive hepatic or whole body protein metabolism in healthy men. The Journal of Clinical Endocrinology & Metabolism. 2003;88(8):3801–3805. doi: 10.1210/jc.2002-021087. - DOI - PubMed
Publication types
MeSH terms
Substances
LinkOut - more resources
Full Text Sources
Medical
Miscellaneous