. 2023 Jun;37(6):1194-1203.
doi: 10.1038/s41375-023-01900-5. Epub 2023 Apr 19.

Preclinical pharmacokinetic and pharmacodynamic evaluation of dasatinib and ponatinib for the treatment of T-cell acute lymphoblastic leukemia

Affiliations

Preclinical pharmacokinetic and pharmacodynamic evaluation of dasatinib and ponatinib for the treatment of T-cell acute lymphoblastic leukemia

Satoshi Yoshimura et al. Leukemia. 2023 Jun.

Abstract

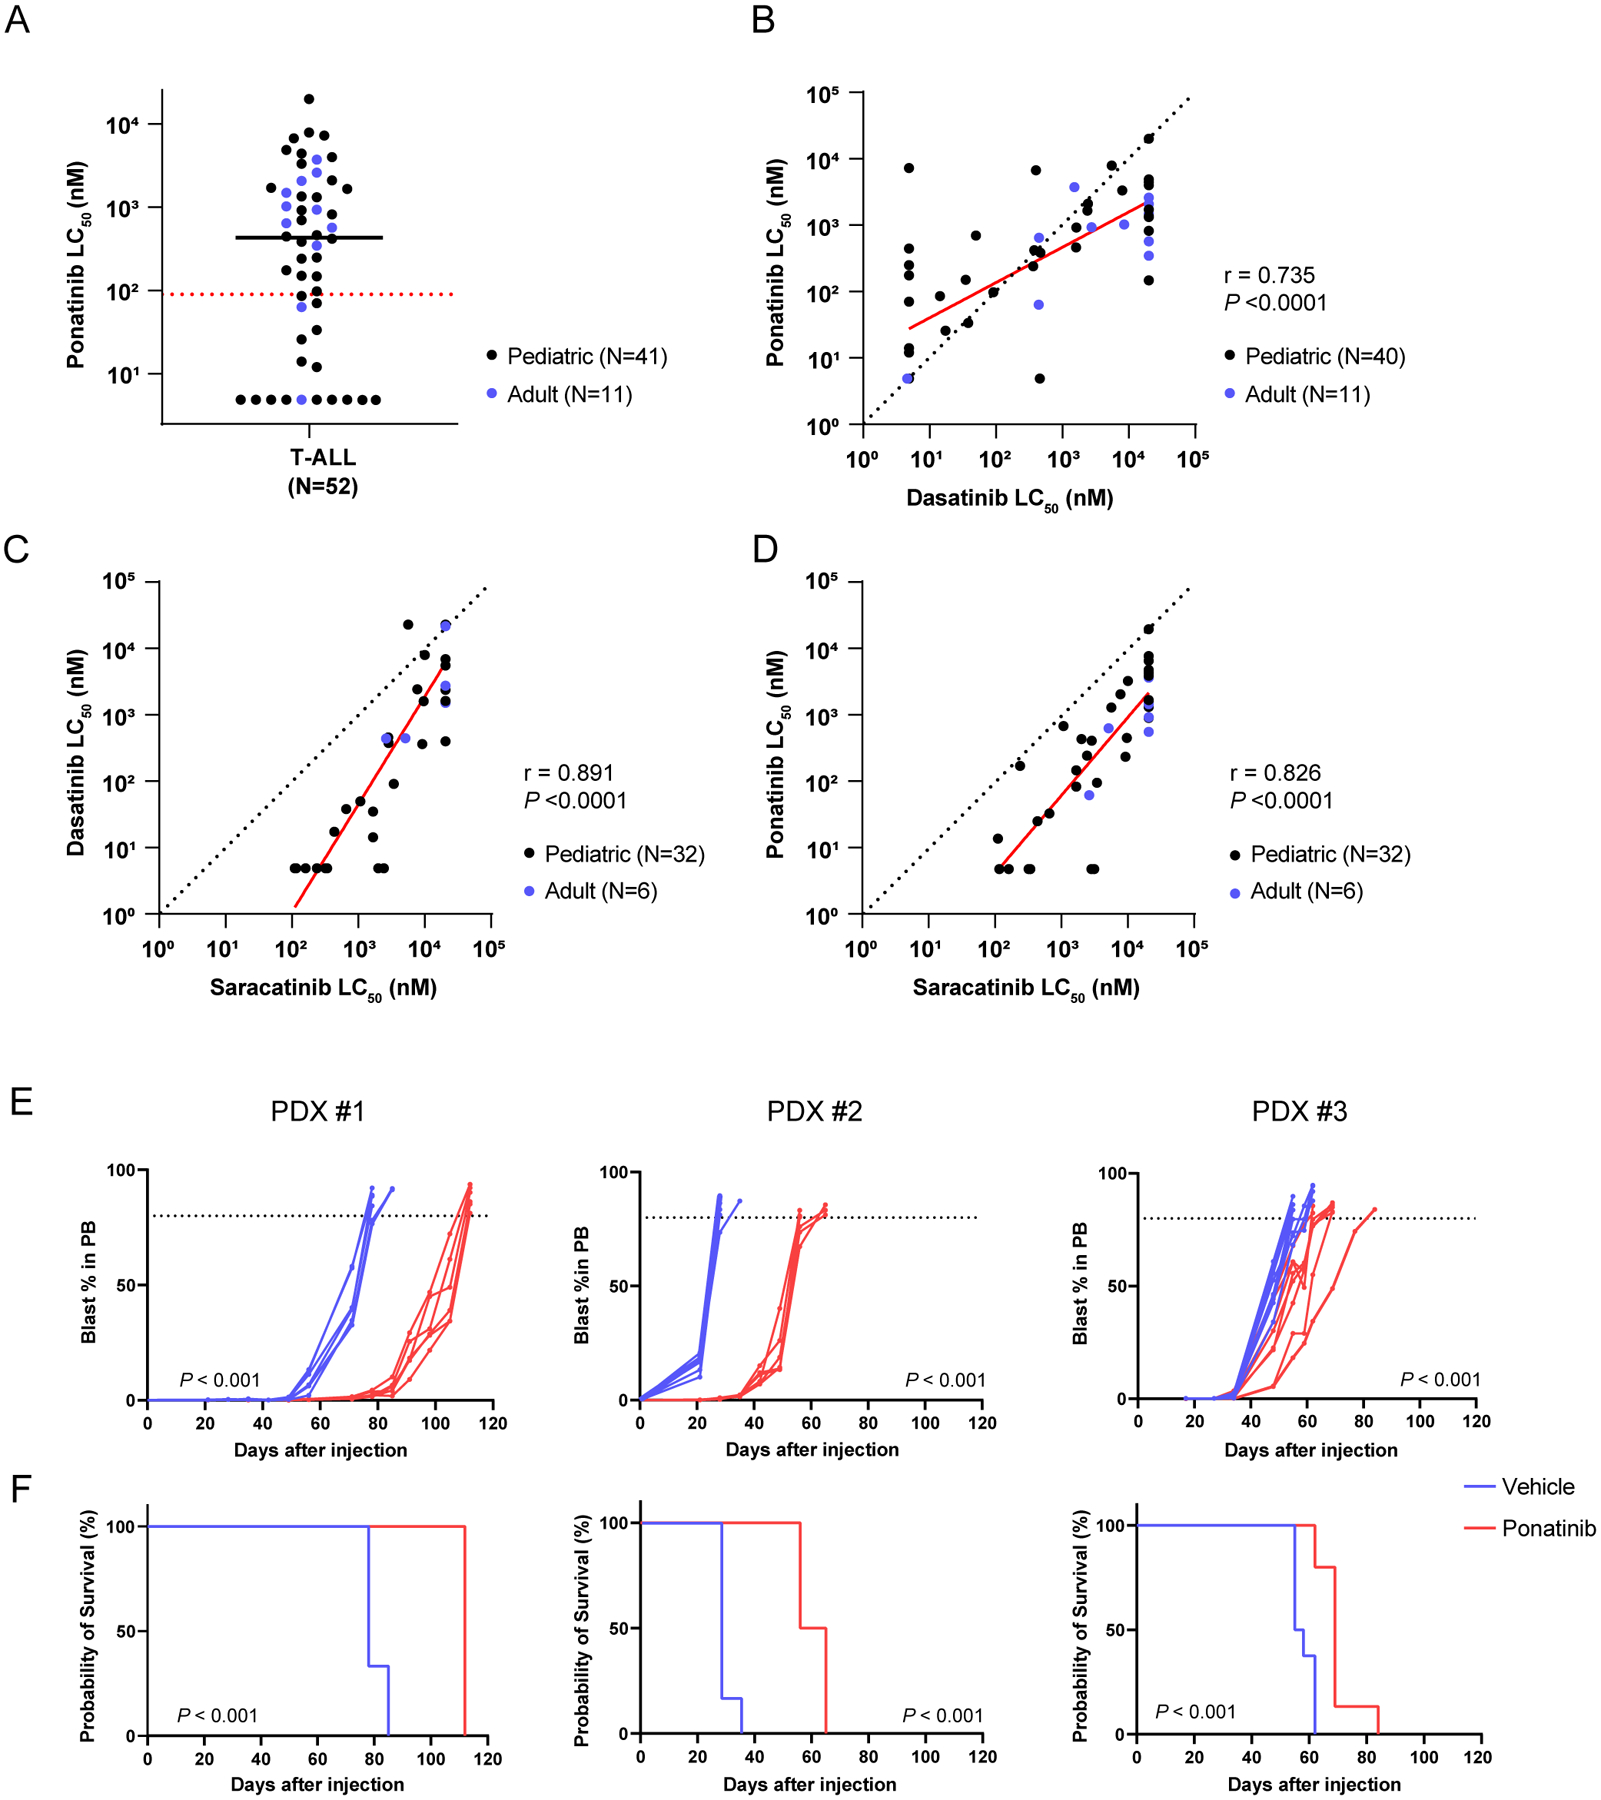
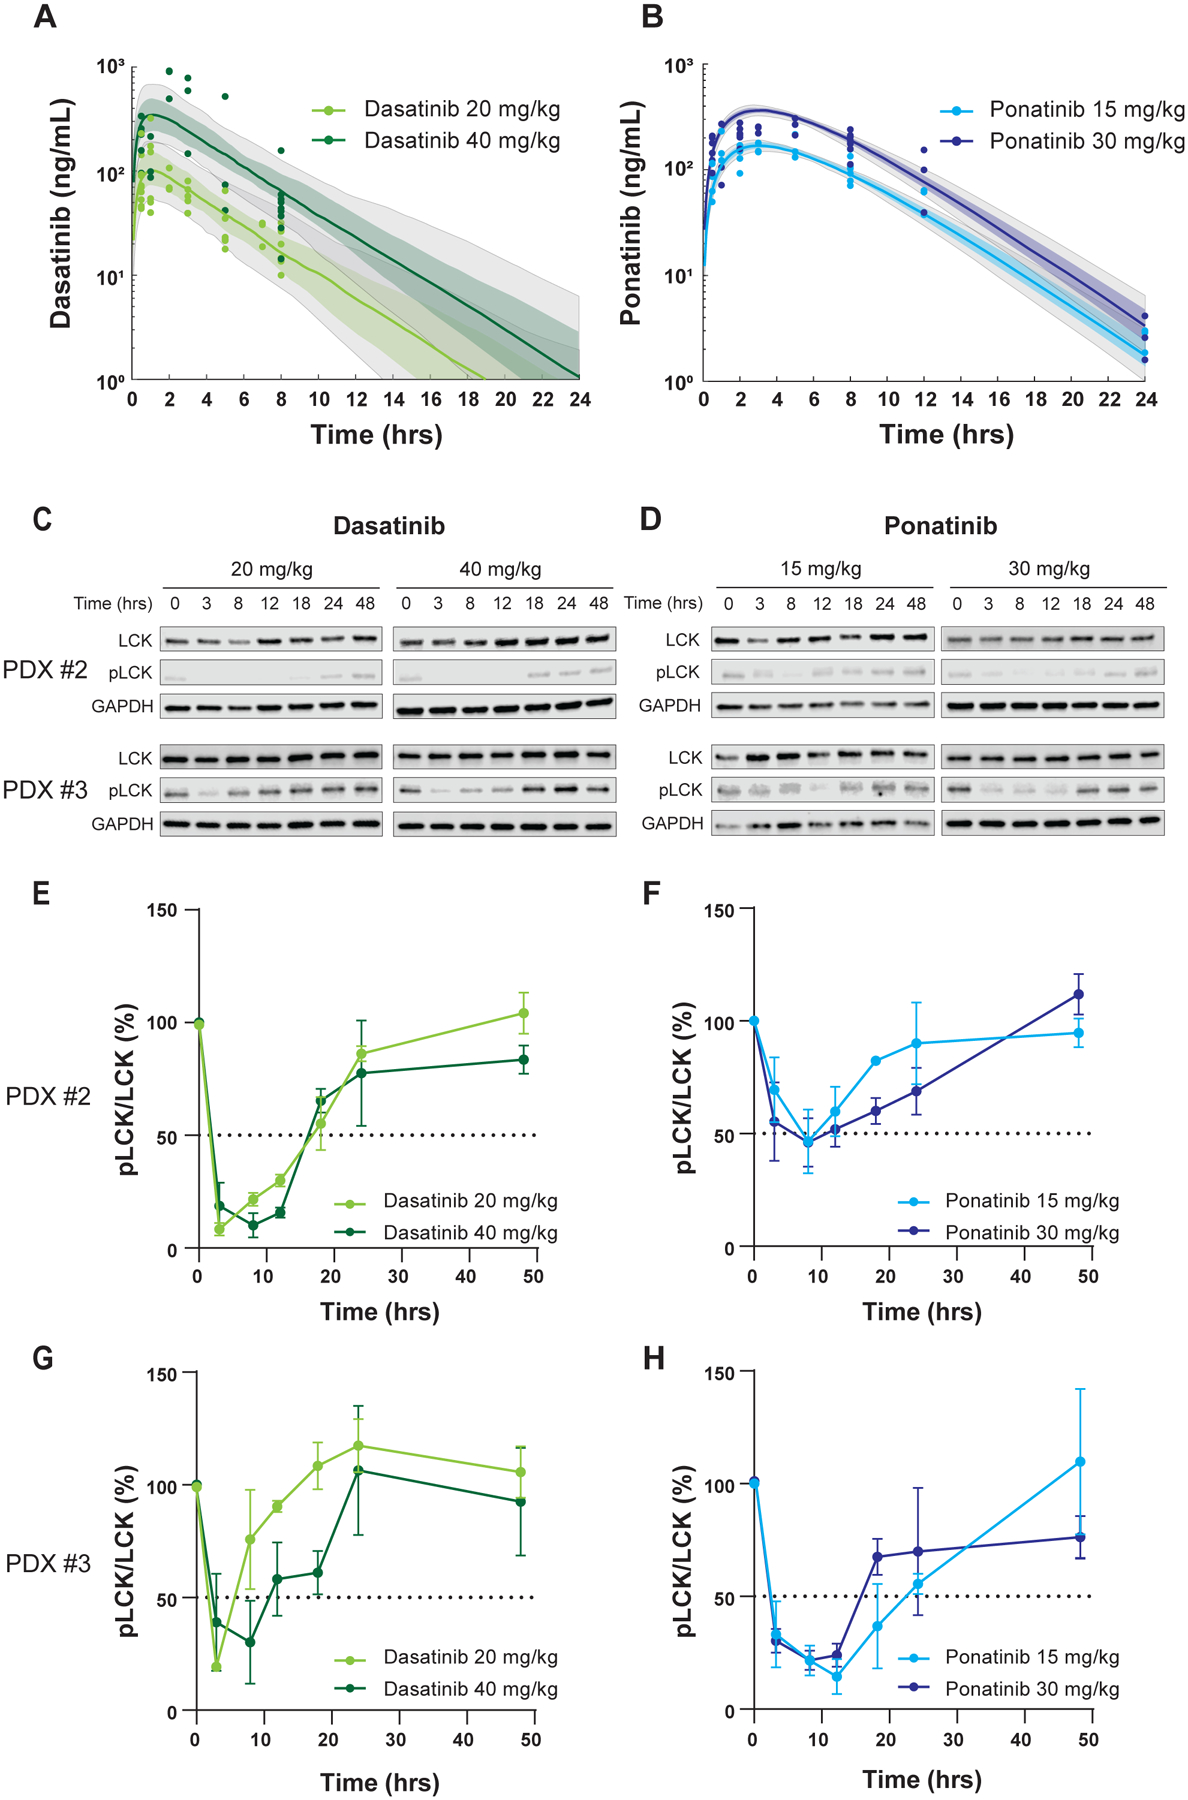
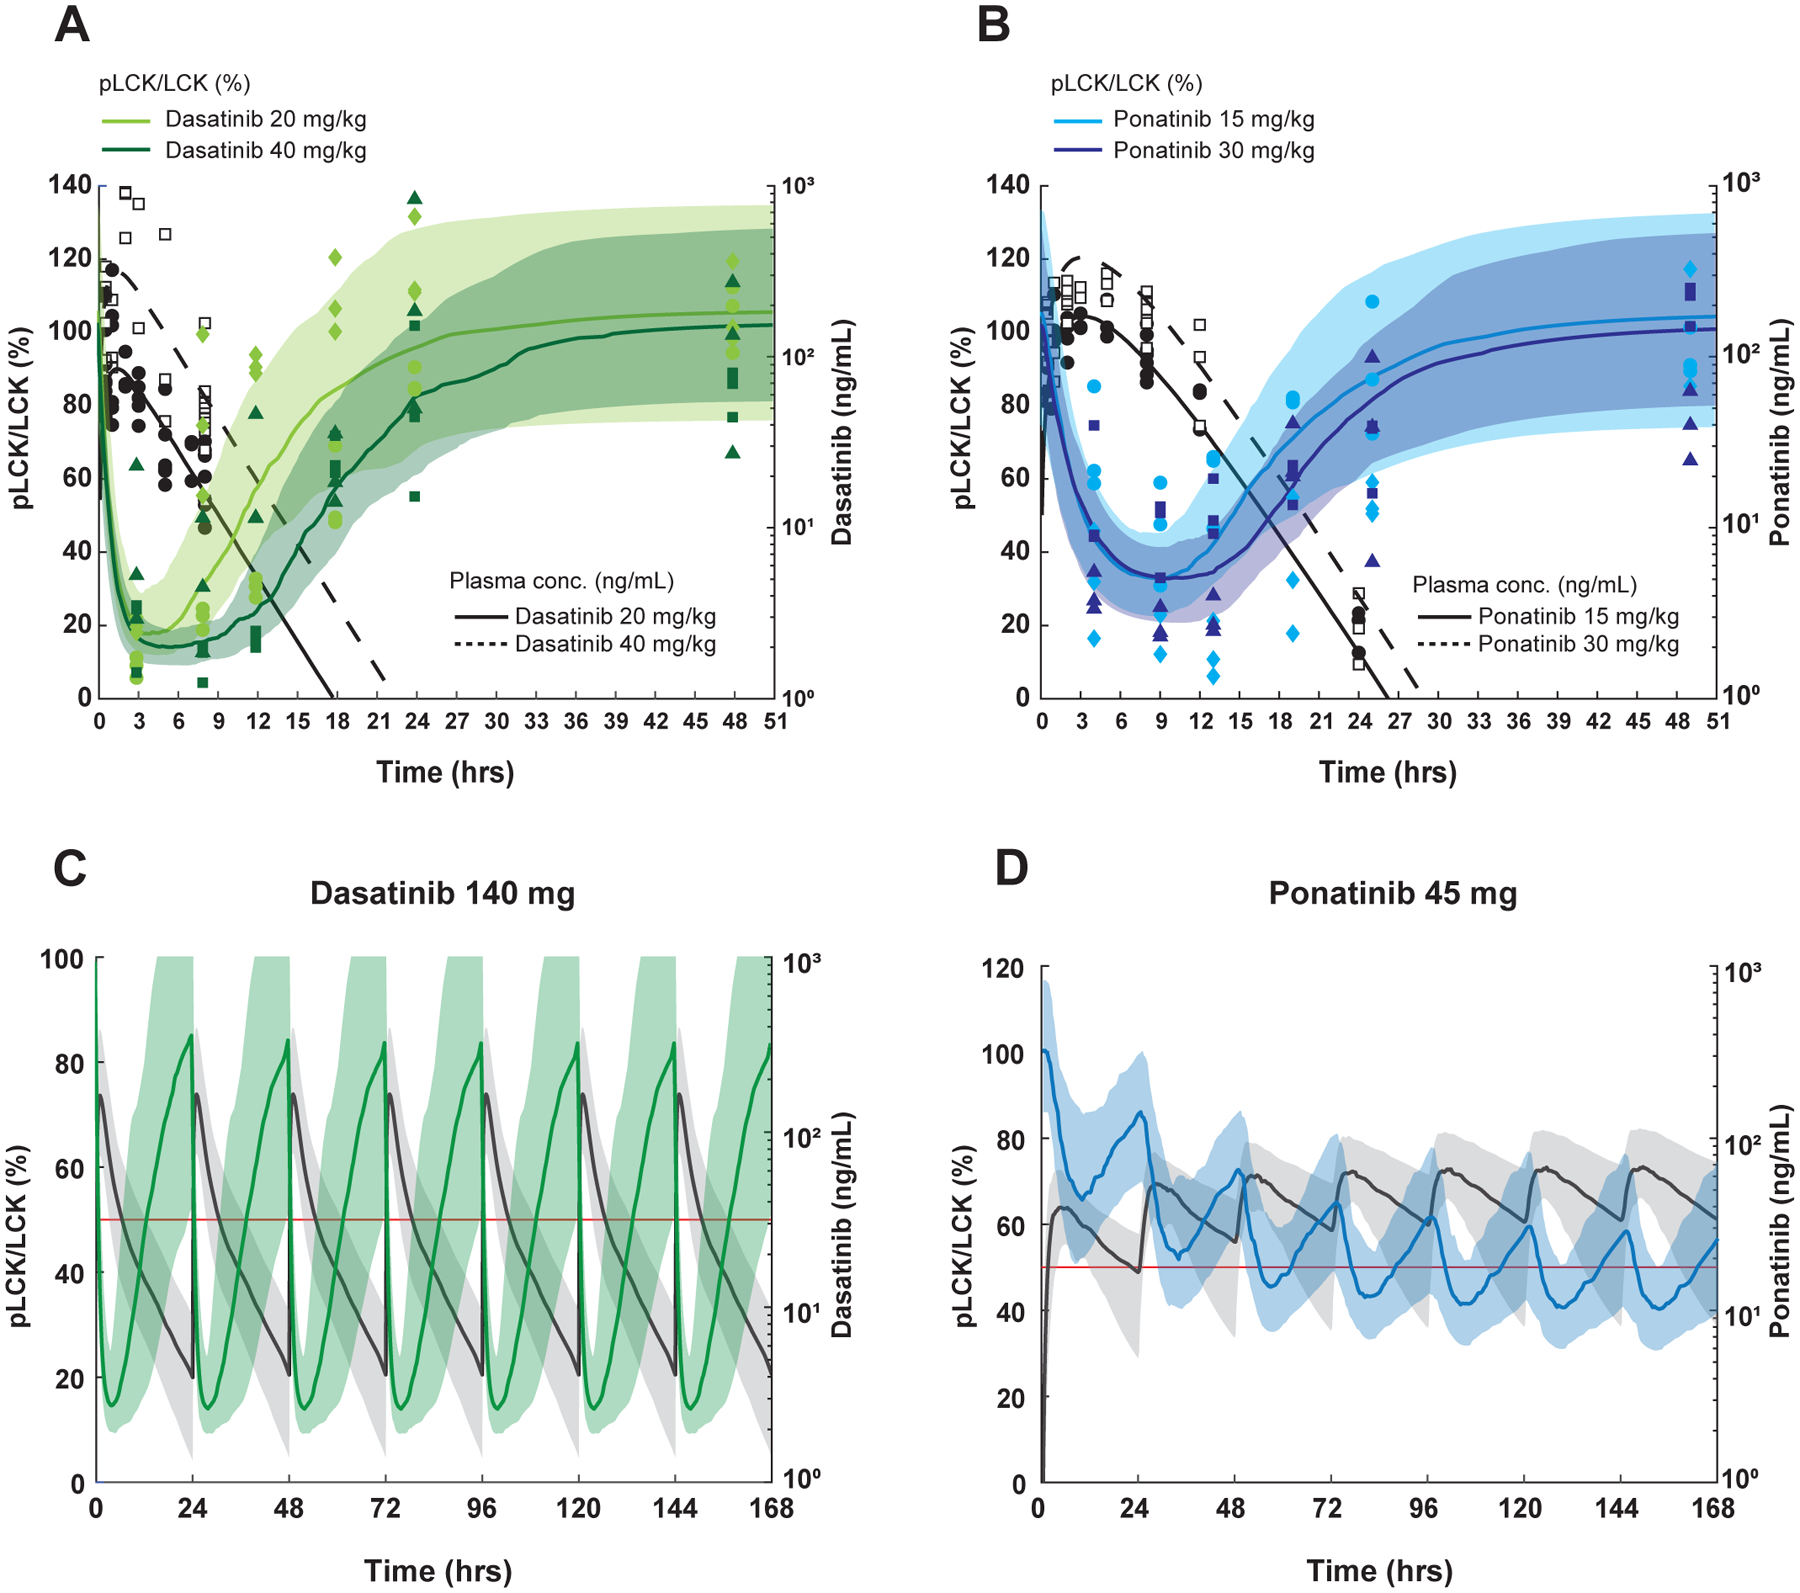
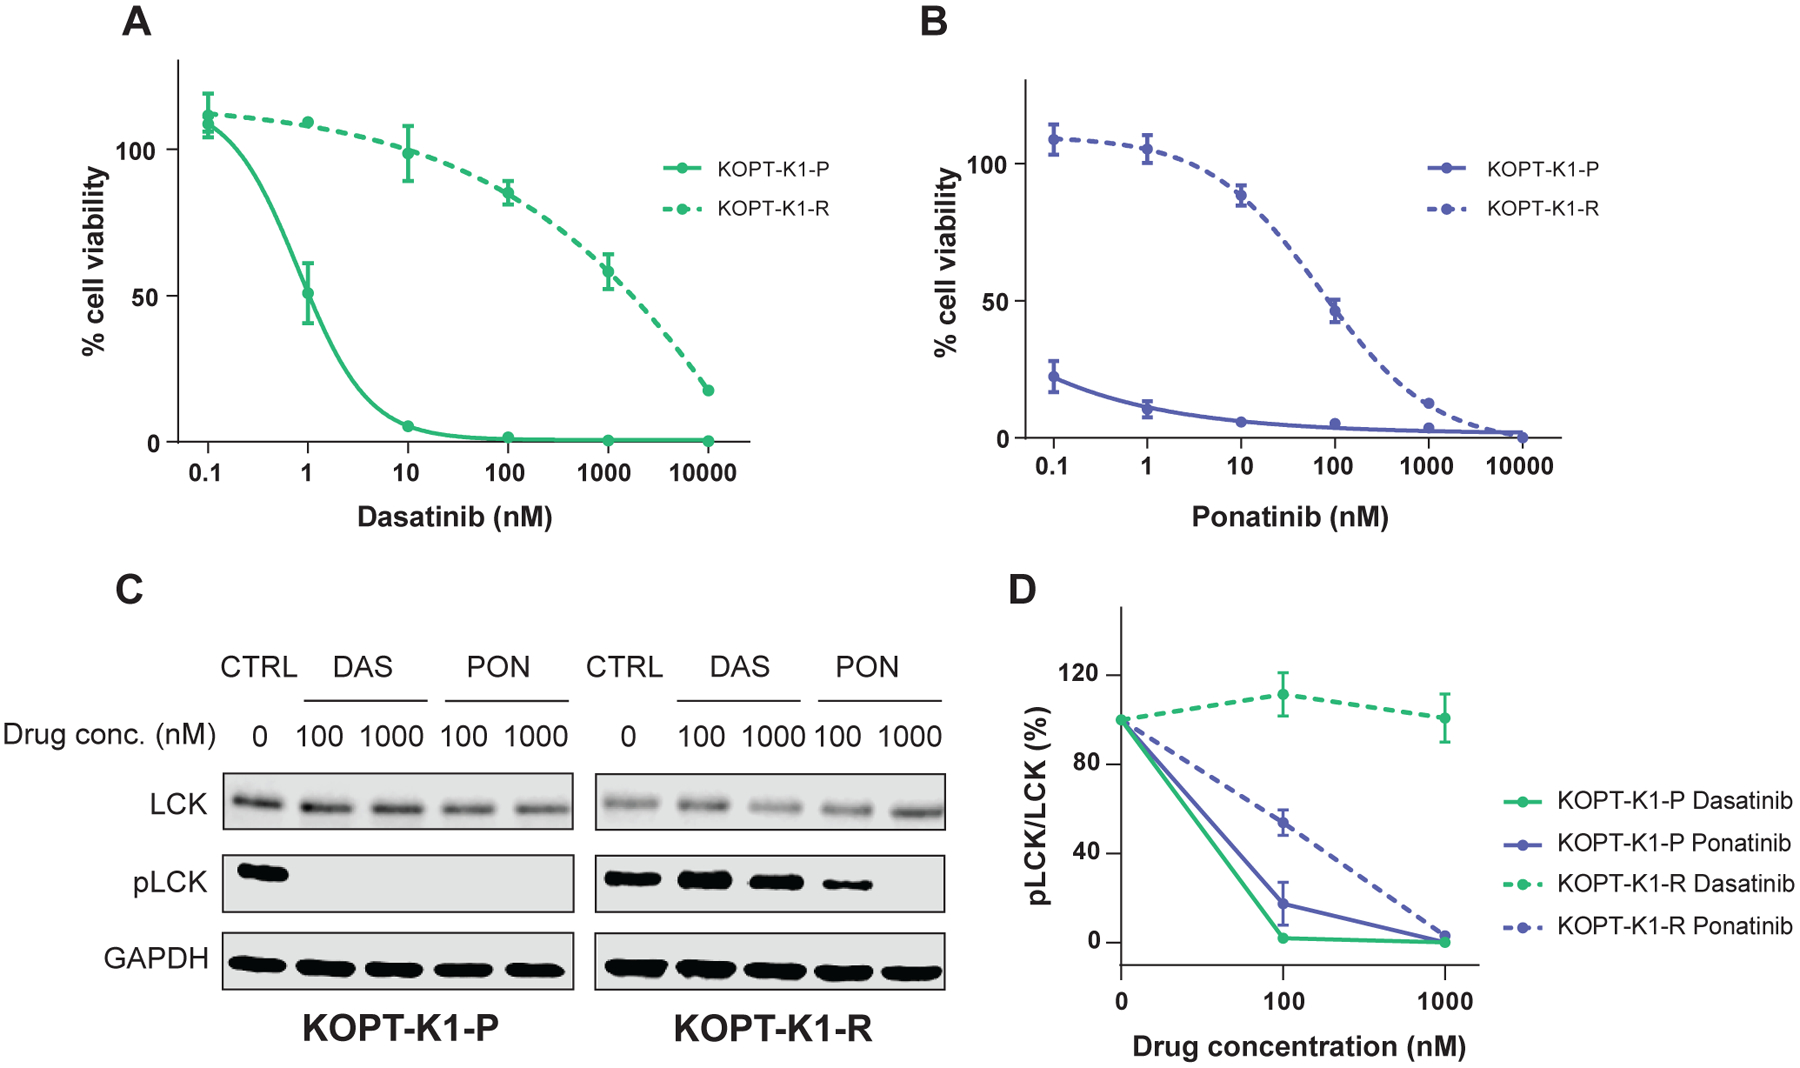
LCK is a novel therapeutic target in ~40% of T-cell acute lymphoblastic leukemia (T-ALL), and dasatinib and ponatinib can act as LCK inhibitors with therapeutic effects. We herein report a comprehensive preclinical pharmacokinetic and pharmacodynamic evaluation of dasatinib and ponatinib in LCK-activated T-ALL. In 51 human T-ALL cases, these two drugs showed similar patterns of cytotoxic activity, with ponatinib being slightly more potent. Given orally in mice, ponatinib was associated with slower clearance with a longer Tmax and higher AUC0-24 h, although maximum pLCK inhibition was comparable between the two drugs. After establishing the exposure-to-response models, we simulated the steady-state pLCK inhibitory effects of each drug at currently approved dosages in humans: dasatinib at 140 mg and ponatinib at 45 mg once daily are both sufficient to achieve >50% pLCK inhibition for 13.0 and 13.9 h/day, respectively, comparable to pharmacodynamic profiles of these agents in BCR::ABL1 leukemias. Moreover, we developed a dasatinib-resistant T-ALL cell line model with LCK T316I mutation, in which ponatinib retained partial activity against LCK. In conclusion, we described the pharmacokinetic and pharmacodynamic profiles of dasatinib and ponatinib as LCK inhibitors in T-ALL, providing critical data for the development of human trials of these agents.


Conflict of interest statement

This work was partly supported by Takeda Pharmaceutical Company. J.H. is a current employee of Amgen Inc.

Figures

Figure 1.
Figure 1.. Ponatinib shows antileukemic activity in LCK-activated T-ALL ex vivo and in vivo.
A, Ponatinib LC50 distribution in human T-ALL (N=52). The black solid line and red dash line indicate the median LC50 and the cut-off (90nM) for ponatinib sensitivity, respectively. B-D, Comparison of LC50 between dasatinib and ponatinib (B, N=51), saracatinib and dasatinib (C, N=38), and saracatinib and ponatinib (D, N=38) in T-ALL samples evaluated by Pearson tests. In each panel, the red line indicates the regression line (R2=0.540, P <0.0001 in B; R2=0.793, P <0.0001 in C; R2=0.682, P <0.0001 in D) and the black dashed line represents the line of identity. E, F, In vivo efficacy of ponatinib therapy in three LCK-activated T-ALL PDX models. Leukemic burden of the mice treated with either ponatinib 30 mg/kg or vehicle were monitored by blast % in peripheral blood. Each curve represents an individual mouse and P-value was estimated using a Wilcoxon matched-pairs signed rank test (E). Survival after the injection was estimated for each T-ALL PDX model. P-value was calculated using a log-rank test (F). The ponatinib treatment arms are shown in red, while the vehicle treatment arms are in blue. Each treatment arm included six mice for PDXs #1 and #2, and eight mice per arm for PDX #3 (left, middle, and right panels, respectively). PB, peripheral blood.
Figure 2.
Figure 2.. PK and PD profiles of dasatinib and ponatinib in mice.
A, B, Time-dependent change in plasma drug concentration after single dose administered orally. For dasatinib, observed plasma concentrations are plotted in light green (20 mg/kg) and dark green (40 mg/kg) (A), while those are shown in light blue (15 mg/kg) and dark blue (30 mg/kg) for ponatinib (B). The corresponding curves and shaded regions are the median and 25th-75th percentile drug concentrations predicted by a one-compartment PK model with first-order absorption and linear elimination. The grey shaded regions are the 10th-90th percentile model predicted drug concentrations. 100 ng/ml is equivalent to 204.9nM for dasatinib, and 187.8nM for ponatinib. C, D, LCK phosphorylation over time after dasatinib and ponatinib treatment was used as the PD endpoint in the two T-ALL PDX models. pLCK was quantified by Western blotting using near-infrared fluorescence detection. Human T-ALL blasts were collected from mouse bone marrow (derived from PDXs #2 and #3 in Fig. 1E, F) at various time points after a single dose of each drug. Representative results are shown. E-H, The y axes indicate relative phosphorylation levels normalized to mice not receiving drug (0 hr). Each plot is a mean from three mice shown with S.D. as an error bar.
Figure 3.
Figure 3.. Simulation of PK-PD after repetitive dasatinib and ponatinib dosing in human T-ALL.
A, B, PK/PD modeling in mice after receiving a single dose of dasatinib (A) or ponatinib (B). For pLCK inhibition (left y axis, normalized to untreated animals), data are plotted as light green (20 mg/kg) and dark green symbols for dasatinib (40 mg/kg), while they are plotted as light blue (15 mg/kg) and dark blue symbols (30 mg/kg) for ponatinib Data from PDX #2 are shown as circles and squares, and those from PDX #3 are in rhombi and triangles. The median, 10th-90th percentile pLCK levels were predicted and are respectively shown in the curves and shaded regions in the same colors. For plasma drug concentrations (right y axis) The black circles (lower doses) and black squares (higher doses) show measured plasma drug concentrations and the black solid (lower doses) and black dashed (higher dose) curves indicate the median model estimated drug concentrations. 100 ng/ml is equivalent to 204.9nM for dasatinib, and 187.8nM for ponatinib. C, D, PK and PD simulations at FDA-approved dosages of dasatinib and ponatinib in humans. The steady-state after seven doses of dasatinib 140 mg (C) and ponatinib 45 mg (D) given daily are simulated (N=100). In the dasatinib simulation, the median, and 10th-90th percentile model estimated pLCK levels are shown by the green curve and shaded regions, respectively. For ponatinib, the blue curve and shaded regions indicate the median, 10th-90th percentile model estimated pLCK levels. In both simulations, the black solid curve and shaded regions indicate the median, 10th-90th percentile model estimated drug concentrations. The right y axes, plasma drug concentrations; the left y axes, pLCK levels normalized to the untreated mice. The red lines indicate model estimated pLCK levels equal to 50%.
Figure 4.
Figure 4.. Dasatinib-resistant KOPT-K1 retains its sensitivity to ponatinib.
A, B, The resistant cells (KOPT-K1-R, dashed line) as well as parental cells (KOPT-K1-P, solid line) were subject to either dasatinib (A) or ponatinib (B) treatment for 72 hrs at various concentrations, followed by a CTG assay to evaluate cell viability. The y axes indicate % cell viability compared to the respective untreated cells. C, D, LCK phosphorylation in dasatinib- or ponatinib-treated cells were quantified by Western blotting. The cells were treated at indicated concentrations for 3 hrs. The experiments were repeated three times and a representative image is shown (C). CTRL, no-treatment control; DAS, dasatinib; PON, ponatinib. D, The y axes indicate relative LCK phosphorylation normalized to the level in untreated cells. Each plot is a mean from independent experiments (N=3) shown with S.D. as an error bar.

References

    1. Jeha S, Pei D, Choi J, Cheng C, Sandlund JT, Coustan-Smith E, et al. Improved CNS Control of Childhood Acute Lymphoblastic Leukemia Without Cranial Irradiation: St Jude Total Therapy Study 16. J Clin Oncol. 2019;37(35):3377–91. - PMC - PubMed
    1. Moricke A, Zimmermann M, Valsecchi MG, Stanulla M, Biondi A, Mann G, et al. Dexamethasone vs prednisone in induction treatment of pediatric ALL: results of the randomized trial AIEOP-BFM ALL 2000. Blood. 2016;127(17):2101–12. - PubMed
    1. Pieters R, de Groot-Kruseman H, Van der Velden V, Fiocco M, van den Berg H, de Bont E, et al. Successful Therapy Reduction and Intensification for Childhood Acute Lymphoblastic Leukemia Based on Minimal Residual Disease Monitoring: Study ALL10 From the Dutch Childhood Oncology Group. J Clin Oncol. 2016;34(22):2591–601. - PubMed
    1. Place AE, Stevenson KE, Vrooman LM, Harris MH, Hunt SK, O’Brien JE, et al. Intravenous pegylated asparaginase versus intramuscular native Escherichia coli L-asparaginase in newly diagnosed childhood acute lymphoblastic leukaemia (DFCI 05–001): a randomised, open-label phase 3 trial. Lancet Oncol. 2015;16(16):1677–90. - PubMed
    1. Maloney KW, Devidas M, Wang C, Mattano LA, Friedmann AM, Buckley P, et al. Outcome in Children With Standard-Risk B-Cell Acute Lymphoblastic Leukemia: Results of Children’s Oncology Group Trial AALL0331. J Clin Oncol. 2020;38(6):602–12. - PMC - PubMed

Publication types

MeSH terms