. 2023 Apr;29(4):936-949.
doi: 10.1038/s41591-023-02271-1. Epub 2023 Apr 19.

Interactions between the lipidome and genetic and environmental factors in autism

Collaborators, Affiliations

Interactions between the lipidome and genetic and environmental factors in autism

Chloe X Yap et al. Nat Med. 2023 Apr.

Abstract

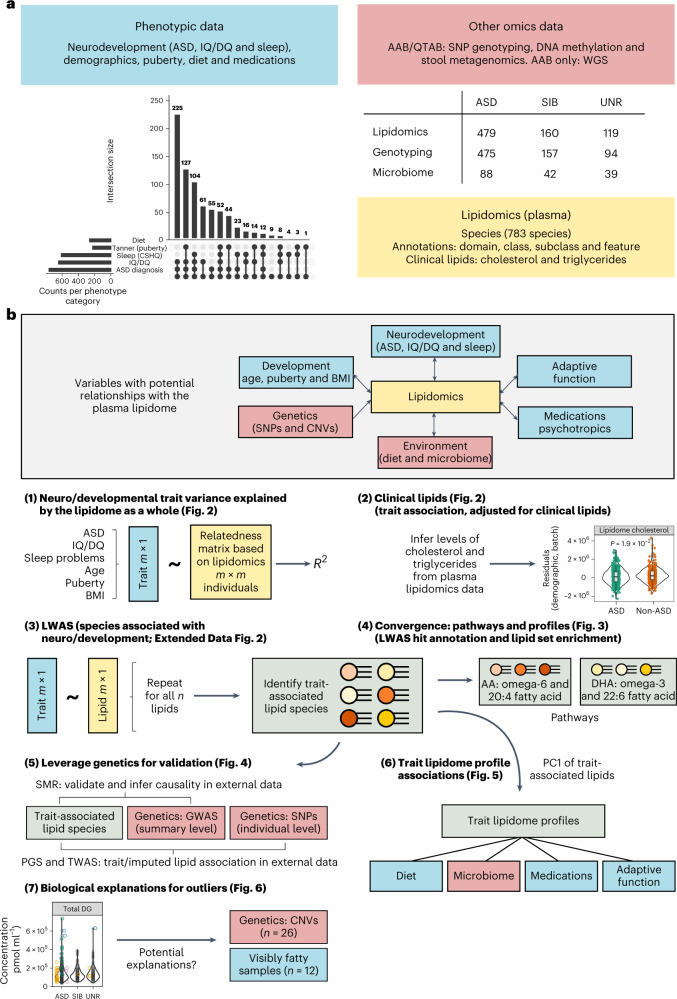
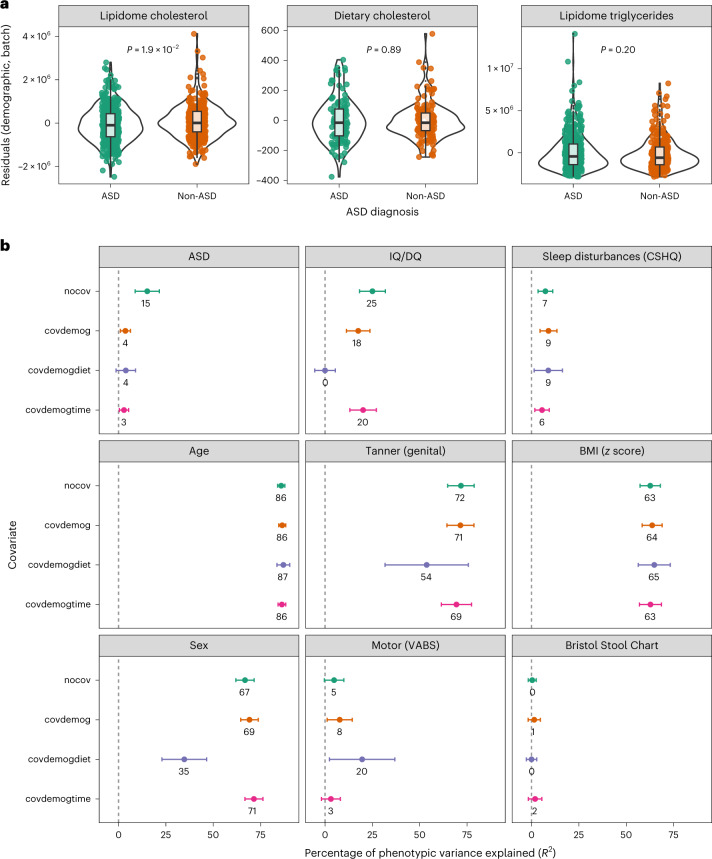
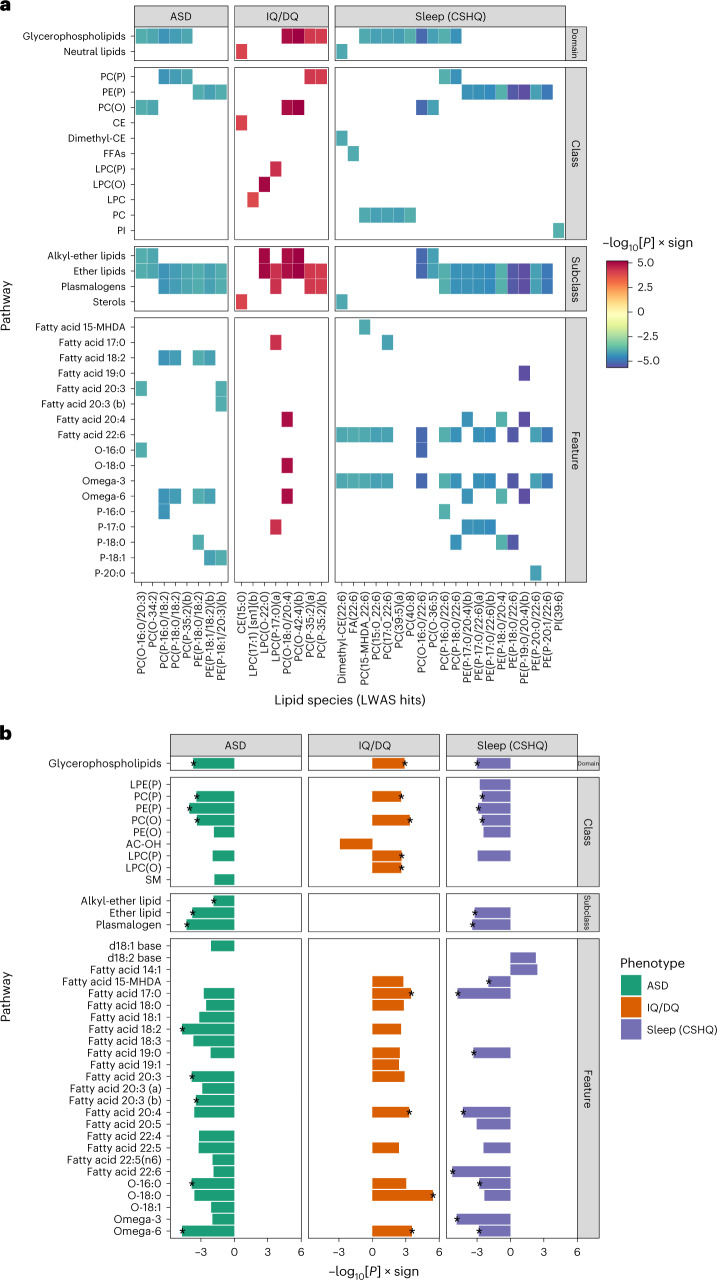
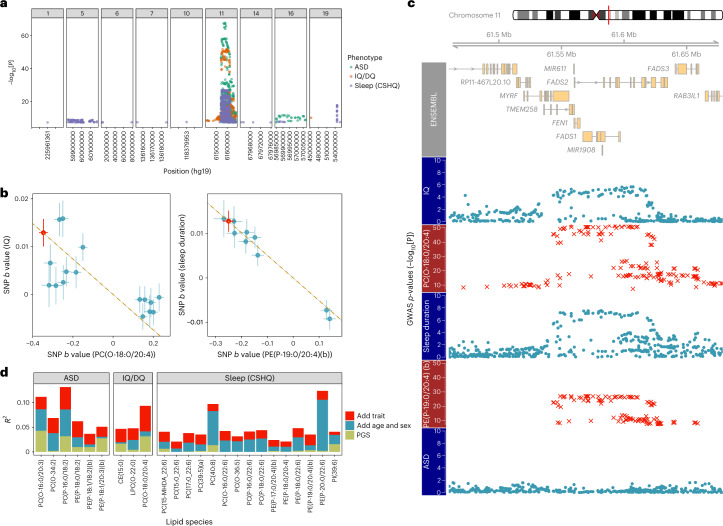
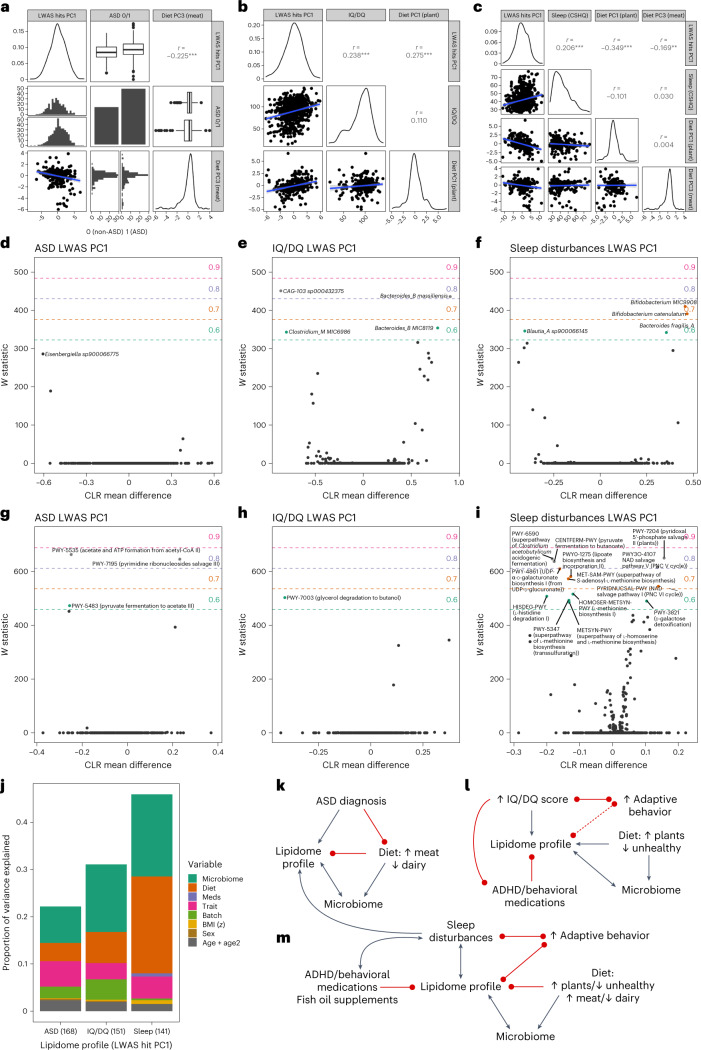
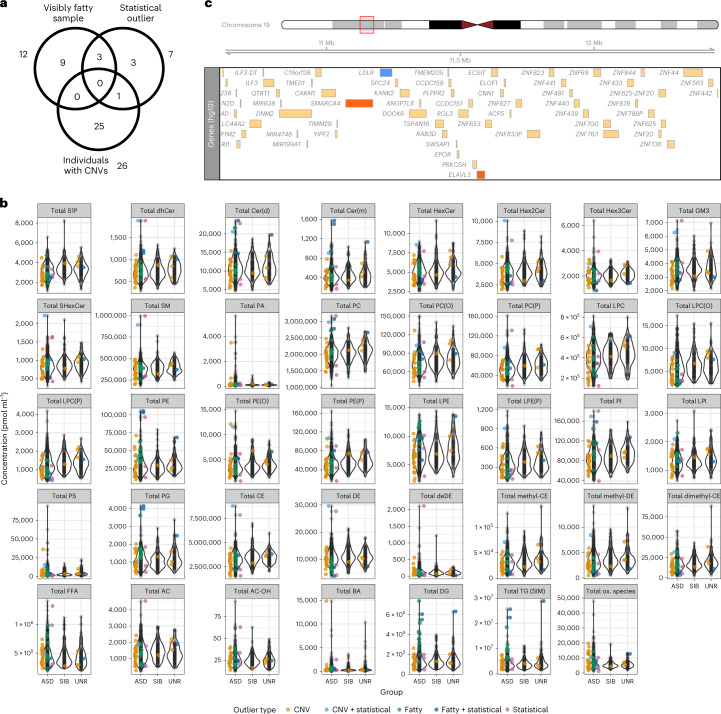
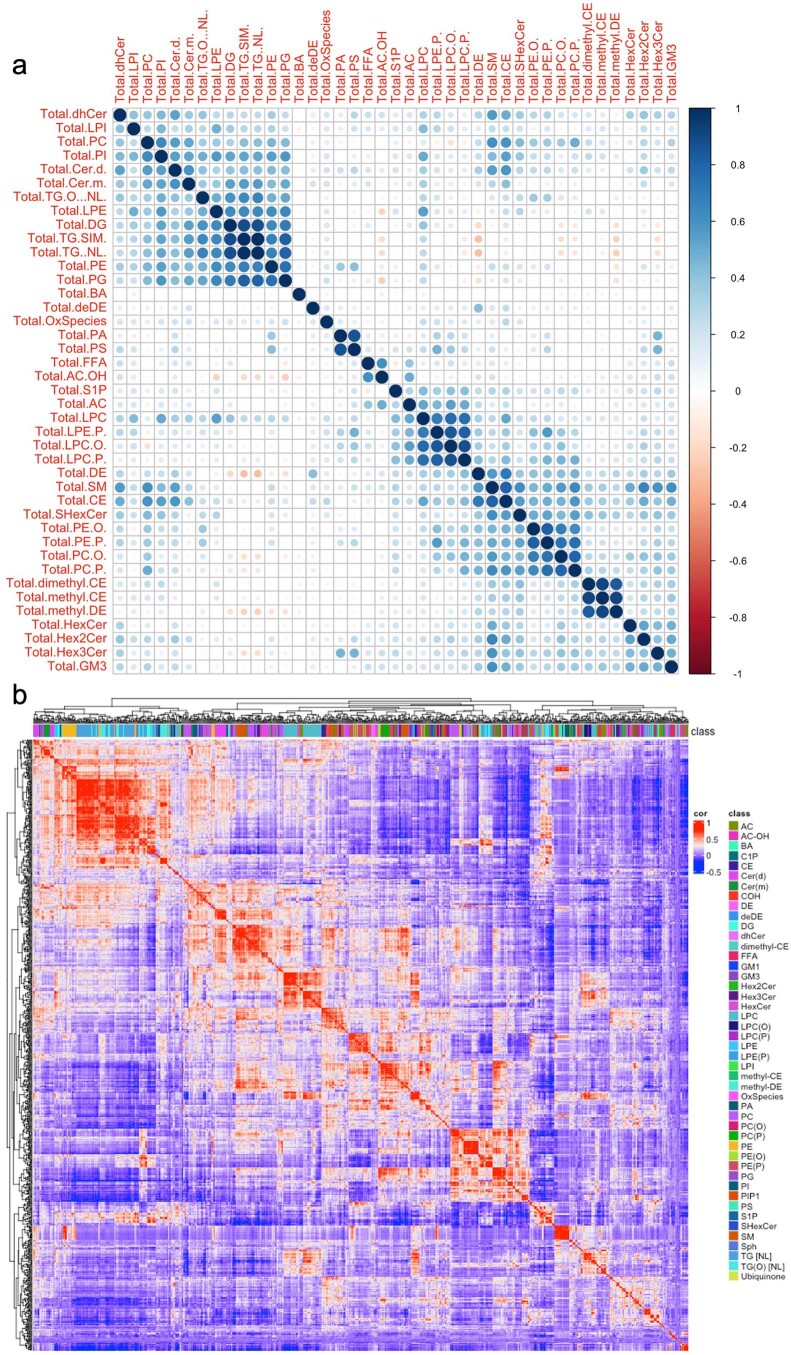
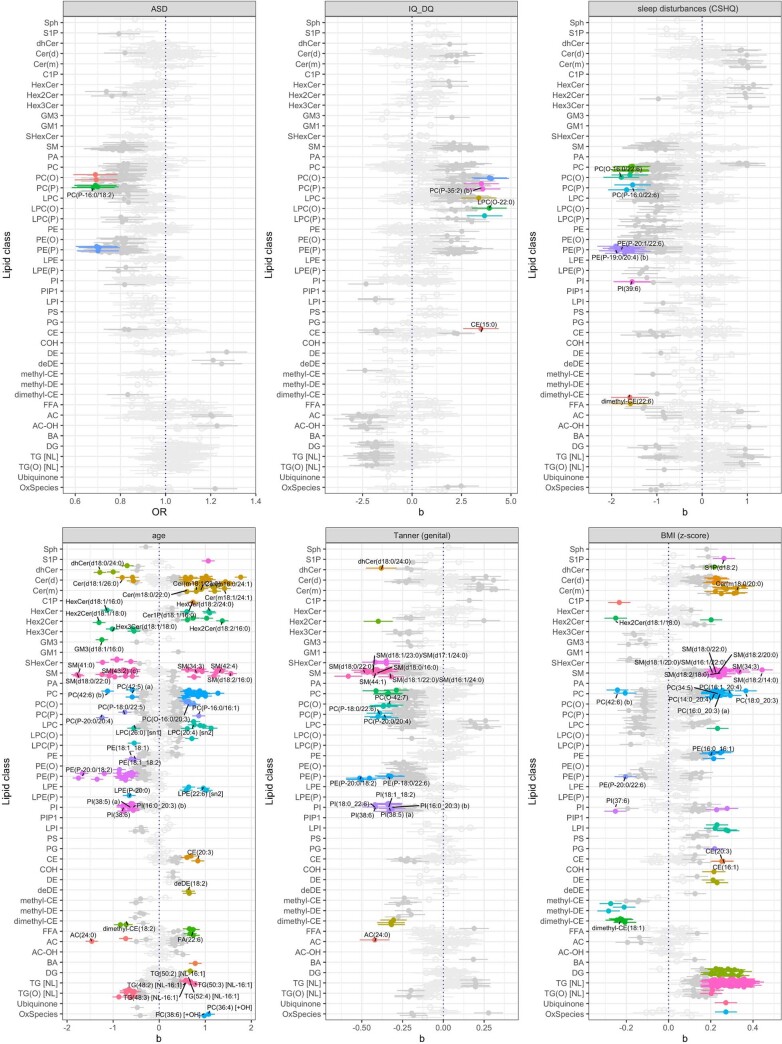
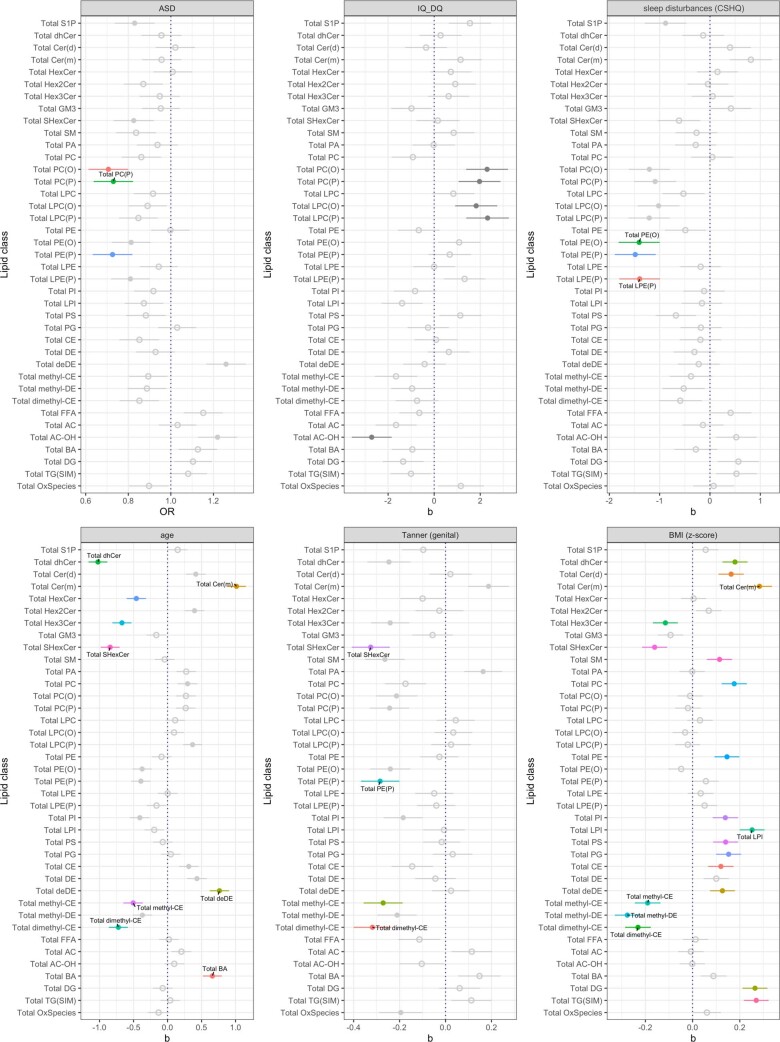
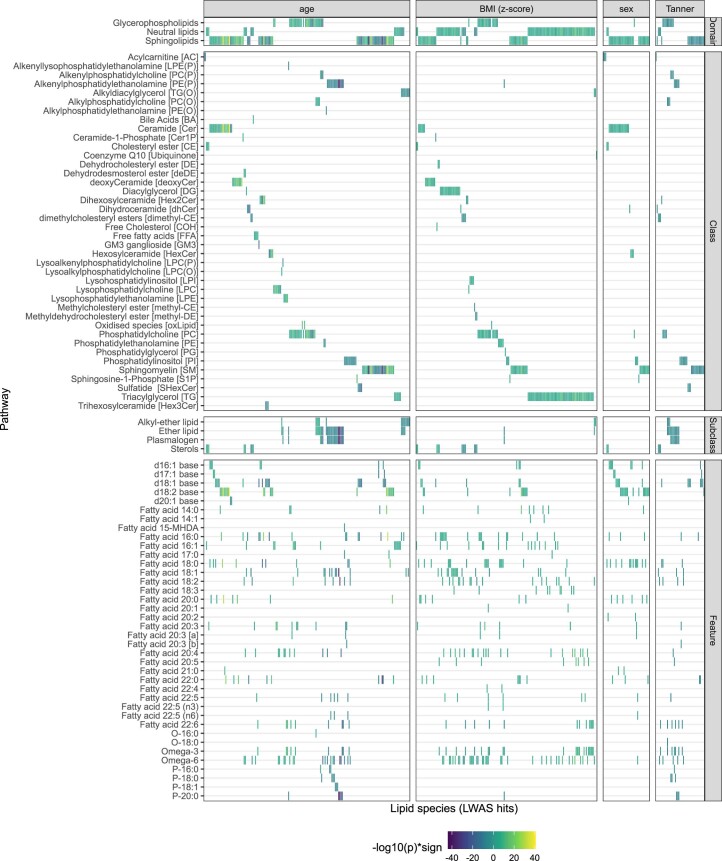
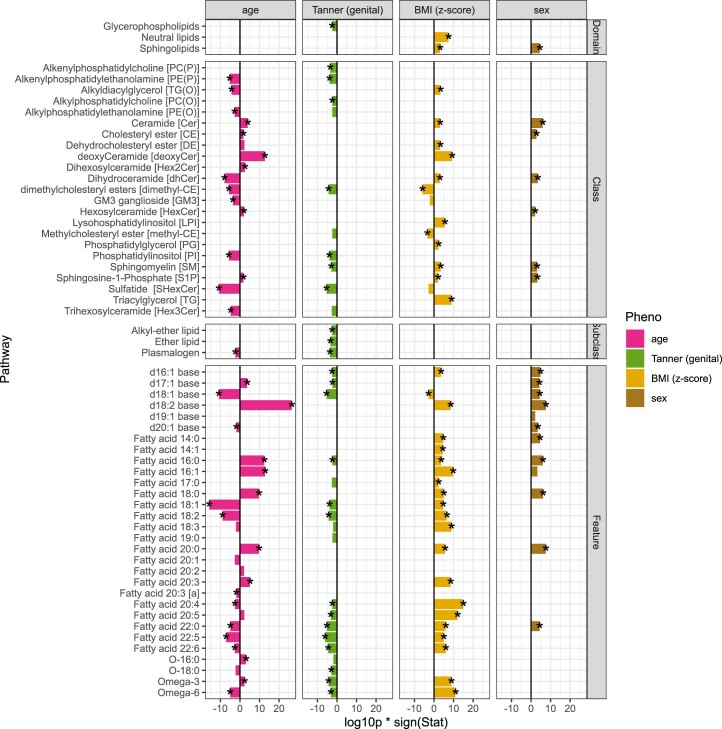
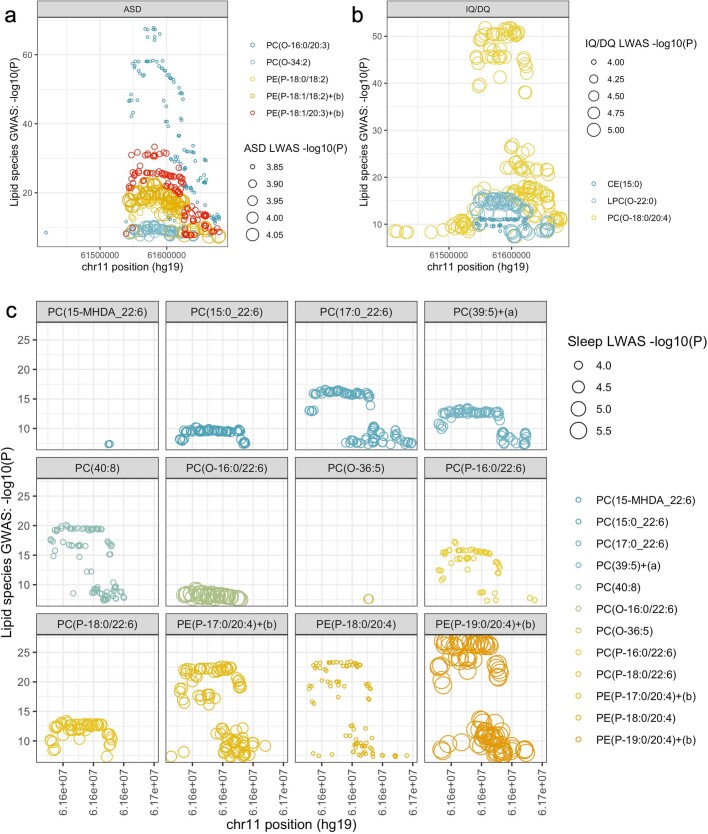
Autism omics research has historically been reductionist and diagnosis centric, with little attention paid to common co-occurring conditions (for example, sleep and feeding disorders) and the complex interplay between molecular profiles and neurodevelopment, genetics, environmental factors and health. Here we explored the plasma lipidome (783 lipid species) in 765 children (485 diagnosed with autism spectrum disorder (ASD)) within the Australian Autism Biobank. We identified lipids associated with ASD diagnosis (n = 8), sleep disturbances (n = 20) and cognitive function (n = 8) and found that long-chain polyunsaturated fatty acids may causally contribute to sleep disturbances mediated by the FADS gene cluster. We explored the interplay of environmental factors with neurodevelopment and the lipidome, finding that sleep disturbances and unhealthy diet have a convergent lipidome profile (with potential mediation by the microbiome) that is also independently associated with poorer adaptive function. In contrast, ASD lipidome differences were accounted for by dietary differences and sleep disturbances. We identified a large chr19p13.2 copy number variant genetic deletion spanning the LDLR gene and two high-confidence ASD genes (ELAVL3 and SMARCA4) in one child with an ASD diagnosis and widespread low-density lipoprotein-related lipidome derangements. Lipidomics captures the complexity of neurodevelopment, as well as the biological effects of conditions that commonly affect quality of life among autistic people.


Conflict of interest statement

P.M.T. received a research grant from Biogen for research unrelated to this paper. The other authors declare no competing interests.

Figures

Fig. 1
Fig. 1. Overview of data and analysis.
a, Phenotypic data and multi-omics data that were used in this analysis. b, Outline of the methods. Blue boxes correspond to phenotypic data, yellow boxes correspond to lipidomics-based data and red boxes correspond to other omics data. AA, arachidonic acid; WGS, whole-genome sequencing.
Fig. 2
Fig. 2. Associations with inferred clinical lipids and variance component analysis.
a, Differences in residuals for inferred clinical lipids (cholesterol and triglycerides) and dietary cholesterol (after regressing out demographic and batch variables: age, age2, sex, batch, injection order and storage time) between ASD and non-ASD groups (n = 694). The box plots show median values and quartiles of the distribution. Statistical significance was determined by logistic regression (ASD diagnosis ~ age + sex + batch + injection order + clinical lipid). The P values are unadjusted for multiple testing (Methods). b, Percentage of trait variance associated with the overall lipidome. The error bars represent s.e. Sensitivity analyses were performed for the following covariate combinations: nocov (no covariates); covdemog (demographic, batch and storage duration); covdemogdiet (covdemog and dietary PC1–PC3; this analysis had the smallest subset of individuals with complete data and hence wider CIs); and covdemogtime (covdemog and collection time of day). For the covdemog analysis (that is, the primary analysis), the sample sizes were as follows: n = 694 (ASD), n = 642 (IQ/DQ), n = 611 (sleep disturbances), n = 758 (age), n = 224 (Tanner (genital) score), n = 715 (BMI), n = 758 (sex), n = 217 (motor (VABS)) and n = 258 (Bristol Stool Chart).
Fig. 3
Fig. 3. Lipid pathways and annotations associated with ASD, IQ/DQ and sleep disturbances.
a, Tile plot showing trait-associated lipid species from LWAS (x axis) and higher-level annotations (y axis). The values on the color scale bar show −log10[P] multiplied by the test statistic sign. 15-MHDA, 15-methylhexadecanoic acid; CE, cholesteryl ester; dimethyl-CE, dimethylcholesteryl ester; FFA, free fatty acid; LPC, lysophosphatidylcholine; LPC(O), lysoalkylphosphatidylcholine; LPC(P), lysoalkenylphosphatidylcholine; PC, phosphatidylcholine; PC(O), alkylphosphatidylcholine; PC(P), alkenylphosphatidylcholine; PE(P), alkenylphosphatidylethanolamine; PI, phosphatidylinositol. b, LSEA results for ASD diagnosis, IQ/DQ and sleep disturbances (CSHQ total score). FDR-significant results (q < 0.05) are shown. The rows show lipid annotations. The bar lengths represent −log10[P value for the LSEA] multiplied by the test statistic sign. Asterisks represent annotations that were also significant by LWAS. Linoleic acid-containing lipid species map to fatty acid 18:2 and omega-6 features. Arachidonic acid-containing lipid species map to fatty acid 20:4 and omega-6 features. DHA-containing lipid species map to fatty acid 22:6 and omega-3 features. LC-PUFAs (including linoleic acid, arachidonic acid and DHA) correspond to lipids with both long fatty acid chains (18 carbons or more) and omega-3 or omega-6 features. At the feature hierarchical level, there were sometimes multiple annotations relating to a single feature (for example, feature–omega-6 as well as subclass–plasmalogen | feature–omega-6), so the values in b correspond to the most significant annotation. We have ensured that these match the LWAS hits (Supplementary Tables 11–13). AC-OH, hydroxylated acylcarnitine; LPE(P), alkenyllysophosphatidylethanolamine; PE(O), alkylphosphatidylethanolamine; SM, sphingomyelin.
Fig. 4
Fig. 4. Genetic contributions of LWAS hits for ASD, IQ/DQ and sleep disturbances.
a, Plots showing chromosomes with genetic signals for the lipid species associated with ASD, IQ/DQ and sleep disturbances. b, Effect sizes (b) of SNPs in the chromosome 11 FADS gene region (used for the HEIDI test) from GWAS summary statistics for two lipid–neurodevelopmental trait pairs: IQ–PC(O-18:0/20:4) and sleep duration–PE(P-19:0/20:4)(b). Red indicates the SMR instrument—the SNP with the most significant association with both the lipid and neurodevelopmental trait in AAB/QTAB (Extended Data Fig. 6). The gold dashed line represents the estimate from SMR of the effect of the lipid on the neurodevelopmental trait at the instrumental SNP (bxy), rather than the regression line. c, Plot of the chromosome 11 FADS gene region (top), with Manhattan plots showing colocalization of the genetic signal from lipid (red plots) and neurodevelopmental (blue plots) trait GWASs. d, Bar plot of the variance (R2) explained in the ANOVA model with terms ordered as: lipid species ~ PGS + demographic information (age, age2 and sex) + trait (ASD, IQ/DQ or CSHQ total score). The displayed lipids are limited to those with summary statistics in the BHS lipid GWAS, which were used to generate the PGSs. The sleep-associated lipid PC(P-18:0/22:6) has R2PGS = 0 as all participants had identical genotypes at the n = 2 PGS loci.
Fig. 5
Fig. 5. Relationships between neurodevelopmental traits, their lipidome profiles (LWAS hit PC1s) and dietary and microbiome variables.
ac, Relationships between ASD diagnosis (a), IQ/DQ (b) sleep disturbances (c), and their respective lipidome profiles and dietary profiles. The ASD and sleep disturbances lipidome profiles were multiplied by −1 to align the direction of effect. For the ASD plots (a), the right half of the second column corresponds to the ASD group (left half corresponds to the non-ASD group), as does the bottom half of the second row (top half of the second row corresponds to the non-ASD group). Upper triangle of ac provides Pearson’s correlation coefficients and asterisks denote significance thresholds: **P <0.01, ***P <0.001. Box and whisker plots denote quartiles. di, Differentially abundant microbiome species (df) and MetaCyc pathways (gi) for the neurodevelopmental lipidome profiles ASD LWAS PC1 (d,g), IQ/DQ LWAS PC1 (e,h) and sleep disturbances LWAS PC1 (f,i) (covariates: age, age2, sex, batch, injection order and dietary PC1–PC3). The microbiome analysis sample size was n = 188. The x-axis (CLR mean difference) indicates the effect size on the centered log-ratio transformed scale, whereas y-axis (W statistic) indicates the degree of statistical significance, whereby W statistic > 0.7 indicates robust significance, whereas > 0.6 corresponds to nominal significance. j, Dissection of variance in the neurodevelopmental lipidome profiles. The results are from ANOVA models of the trait-specific lipidome profile ~ age + age2 + sex + BMI + batch (batch, injection order and storage duration) + neurodevelopmental trait + significantly associated medications (meds) + significantly associated dietary principal components (ac) + significant microbiome features (di). km, Proposed models of the relationships between neurodevelopmental lipidome profiles (for ASD diagnosis (k), IQ/DQ (l), sleep problems (m)), neurodevelopmental traits, diet, microbiome, medications and adaptive function. The dashed line indicates that the lipidome association is not independent (that is, the association between adaptive function and the IQ/DQ lipidome profile can be explained by IQ/DQ lipidome associations). Bidirectional arrows indicate either bidirectional relationships or insufficient evidence (previous or otherwise) to suggest a direction of causality. The trait-specific lipidome profiles were the variables of interest, so analyses were not exhaustively performed between other variable pairs. The black arrows represent positive associations and the red arrows represent negative associations.
Fig. 6
Fig. 6. Outlier analysis.
a, Venn diagram showing the overlap between three groups of outliers: visibly fatty samples (total n = 12), statistical outliers (total n = 7) and individuals with large, rare CNVs (total n = 26). b, Violin plots showing the distribution of lipid class concentrations by group. Coloured points indicate where outliers sit within the overall distribution and denote the outlier category. AC, acylcarnitine; BA, bile acid; Cer, ceramide; DE, dehydrocholesteryl ester; deDE, dehydrodesmosterol ester; DG, diacylglycerol; dhCer, dihydroceramide; GM3, GM3 ganglioside; HexCer, hexosylceramide; Hex2Cer, dihexosylceramide; Hex3Cer, trihexosylceramide; methyl-CE, methylcholesteryl ester; methyl-DE, methyldehydrocholesteryl ester; PA, phosphatidic acid; PE, phosphatidylethanolamine; PG, phosphatidylglycerol; S1P sphingosine-1-phosphate; SHexCer, sulfatide; ox., oxidized. c, Locus plot showing the CNV deletion region for the individual who was in both the CNV and statistical outlier groups. Blue indicates the LDLR gene, which is well known for its association with lipid traits. Red indicates the SMARCA4 and ELAVL3 genes, which are high-confidence ASD genes in the Simons Foundation Autism Research Initiative database.
Extended Data Fig. 1
Extended Data Fig. 1. Lipidome data correlation structures.
Correlation (Pearson’s r) between a) lipid classes and b) lipid species (grouped by class).
Extended Data Fig. 2
Extended Data Fig. 2. Lipidome-wide association study (LWAS) forest plots at the lipid species level.
Plots shown for ASD, IQ/DQ, sleep disturbances (CSHQ total score), age, Tanner score (genital), and BMI (z-score). Point denotes effect estimate and error bars denote standard error. All analyses included covariates of injection order and storage time; the ASD, IQ/DQ and sleep disturbances LWAS also included age, age2 and sex as covariates; the age and Tanner score (genital) LWAS also included sex; the BMI (z-score) LWAS did not include additional covariates as these are accounted for within the population-normed z-score. The ASD analysis excluded storage time outliers. Each point denotes a lipid species, grouped by rows as lipid classes. Lighter-grey open points represent species with association p > 0.05, darker-grey filled points represent species with association p < =0.05. Colour denotes species passing multiple testing correction (dividing by the effective number of independent lipids; see Methods). Text denotes lipid species retained in a backwards stepwise regression model with covariates, representing the effective number of independent LWAS hits.
Extended Data Fig. 3
Extended Data Fig. 3. Lipidome-wide association study (LWAS) forest plots at the lipid class level.
Plots shown for ASD, IQ/DQ, sleep disturbances (CSHQ total score), age, Tanner score (genital), and BMI (z-score). Point denotes effect estimate and error bars denote standard error. All analyses included covariates of injection order and storage time; the ASD, IQ/DQ and sleep disturbances LWAS also included age, age2 and sex as covariates; the age and Tanner score (genital) LWAS also included sex; the BMI (z-score) LWAS did not include additional covariates as these are accounted for within the population-normed z-score. The ASD analysis excluded storage time outliers. Open points represent classes with association p > 0.05, filled points represent classes with association p ≤ 0.05. Colour denotes classes passing multiple testing correction (dividing by the effective number of independent lipids; see Methods). For IQ/DQ, there were no significantly associated lipid classes and the nominally significant classes (p < 0.05) are shown in dark grey. Text denotes lipid classes retained in a backwards stepwise regression model with covariates, representing the effective number of independent LWAS hits.
Extended Data Fig. 4
Extended Data Fig. 4. Lipid species annotations for age, BMI, sex and Tanner score.
Annotated lipid species significantly associated with age, BMI (z-score), sex and Tanner score (genital) in the LWAS analysis.
Extended Data Fig. 5
Extended Data Fig. 5. Lipid-set enrichment analysis (LSEA) results for age, Tanner score (genital) and BMI (z-score).
Results shown are FDR-significant (q < 0.05). Rows: lipid annotations. Length of bars: -log10 p-value for the LSEA analysis, multiplied by the test statistic sign. *: annotations that were also significant in LWAS.
Extended Data Fig. 6
Extended Data Fig. 6. GWAS locus plots (from the Busselton Health Study) in the FADS gene cluster on chromosome 11 for neurodevelopment-associated lipids.
Lipids shown here were significant in the AAB+ QTAB LWAS for a) ASD, b) IQ/DQ, c) sleep disturbances. Colours respond to individual lipids. The size of the open circle is proportional to the -log10(P) between that lipid species and the neurodevelopmental trait. In c), the sleep disturbances-associated lipids have separate panels for readability. Note that only the LWAS significant lipids that also have summary statistics in the Busselton Health Study are shown here, hence why there are fewer lipids here than in Fig. 3a.
Extended Data Fig. 7
Extended Data Fig. 7. Bar plot of variance (R2) in lipid concentration associated with polygenic score (PGS), demographic variables and ASD diagnosis, for lipid species significantly associated with age, BMI (z-score), sex and Tanner score.
ANOVA model: lipid concentration ~ PGS + (age and sex) + ASD diagnosis.
Extended Data Fig. 8
Extended Data Fig. 8. Validation of the LWAS PC1 as ‘lipidome profiles’ associated with ASD diagnosis, IQ/DQ and sleep disturbances.
A LWAS PC1 was calculated for each neurodevelopmental trait by performing PCA on the statistically significant LWAS lipid species. a-c) Scree plots demonstrating that LWAS PC1 captures >50% of variance in each set of trait-associated lipids; d-f) Plot of PCA loadings, demonstrating that PC1 captures increased levels of all trait-associated lipids. g) Heatmap demonstrating that PCs are representative of LC-PUFAs: there are strong loadings for the annotations corresponding with linoleic acid for the ASD LWAS hits PC1 (that is, fatty acid 18:2 and Omega-6), arachidonic acid (that is, fatty acid 20:4 and Omega-6) for the IQ/DQ LWAS hits PC1, and DHA (that is, fatty acid 22:6 and Omega-3) and arachidonic acid for the sleep LWAS hits PC1.
Extended Data Fig. 9
Extended Data Fig. 9. Dissection of variance in neurodevelopmental trait lipidome profiles after conditioning on total lipidome (a) cholesterol and (b) triglycerides.
Similar to Fig. 5, results are from ANOVA models of the trait-specific lipidome profile ~ age + age2 + sex + BMI + batch (batch, injection order, storage duration) + neurodevelopmental trait + significantly-associated medications + significantly-associated dietary PCs (Fig. 5a–c) + significant microbiome features (Fig. 5d–i).
Extended Data Fig. 10
Extended Data Fig. 10. Group differences in lipid variance.
(a, b) Violin plots for lipid classes and species with significant differences in variance (Levene’s test), before (a) and after (b) regressing lipid concentration against age, age2, sex, batch, injection order and storage duration. (c) Assessing the relationship between lipid classes and species with significant differences in variance and sample storage duration before (c) and after (d) regressing out covariates.

References

    1. Tye C, Runicles AK, Whitehouse AJO, Alvares GA. Characterizing the interplay between autism spectrum disorder and comorbid medical conditions: an integrative review. Front. Psychiatry. 2019;9:751. doi: 10.3389/fpsyt.2018.00751. - DOI - PMC - PubMed
    1. Frazier TW, et al. Brief report: a survey of autism research priorities across a diverse community of stakeholders. J. Autism Dev. Disord. 2018;48:3965–3971. doi: 10.1007/s10803-018-3642-6. - DOI - PubMed
    1. Pellicano E, Dinsmore A, Charman T. What should autism research focus upon? Community views and priorities from the United Kingdom. Autism. 2014;18:756–770. doi: 10.1177/1362361314529627. - DOI - PMC - PubMed
    1. Gupta AR, et al. Rare deleterious mutations of the gene EFR3A in autism spectrum disorders. Mol. Autism. 2014;5:31. doi: 10.1186/2040-2392-5-31. - DOI - PMC - PubMed
    1. Harayama T, Riezman H. Understanding the diversity of membrane lipid composition. Nat. Rev. Mol. Cell Biol. 2018;19:281–296. doi: 10.1038/nrm.2017.138. - DOI - PubMed

Publication types