

Spatial heterogeneity of low-birthweight deliveries on the Kenyan coast
- PMID: 37076795
- PMCID: PMC10114419
- DOI: 10.1186/s12884-023-05586-6
Spatial heterogeneity of low-birthweight deliveries on the Kenyan coast
Abstract
Background: Understanding spatial variations in health outcomes is a fundamental component in the design of effective, efficient public health strategies. Here we analyse the spatial heterogeneity of low birthweight (LBW) hospital deliveries from a demographic surveillance site on the Kenyan coast.
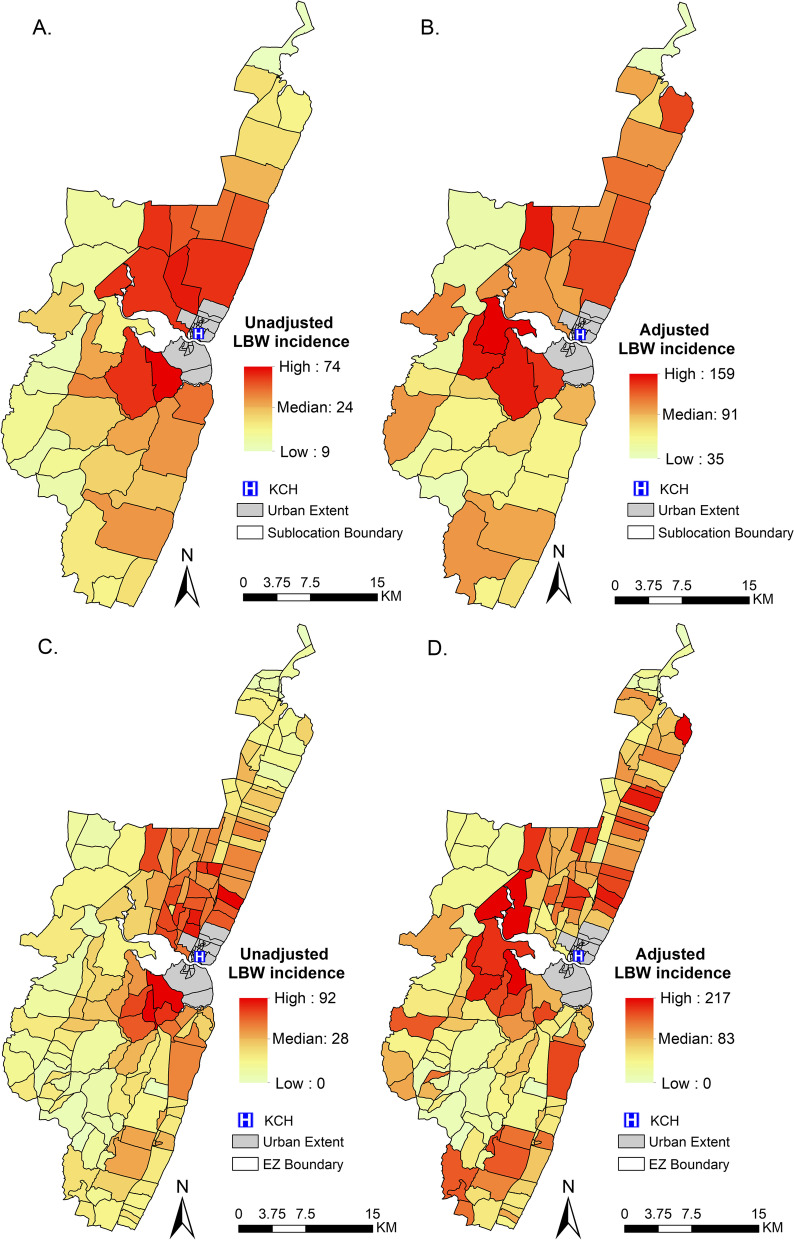
Methods: A secondary data analysis on singleton livebirths that occurred between 2011 and 2021 within the rural areas of the Kilifi Health and demographic surveillance system (KHDSS) was undertaken. Individual-level data was aggregated at enumeration zone (EZ) and sub-location level to estimate the incidence of LBW adjusted for accessibility index using the Gravity model. Finally, spatial variations in LBW were assessed using Martin Kulldorf's spatial scan statistic under Discrete Poisson distribution.
Results: Access adjusted LBW incidence was estimated as 87 per 1,000 person years in the under 1 population (95% CI: 80, 97) at the sub-location level similar to EZ. The adjusted incidence ranged from 35 to 159 per 1,000 person years in the under 1 population at sub-location level. There were six significant clusters identified at sub-location level and 17 at EZ level using the spatial scan statistic.
Conclusions: LBW is a significant health risk on the Kenya coast, possibly under-estimated from previous health information systems, and the risk of LBW is not homogenously distributed across areas served by the County hospital.
Keywords: Accessibility; Kenya; Kilifi; Low birthweight; Spatial heterogeneity.
© 2023. The Author(s).
Conflict of interest statement
The authors declare no competing interests.
Figures


Similar articles
-
Folic acid supplementation and malaria susceptibility and severity among people taking antifolate antimalarial drugs in endemic areas.Cochrane Database Syst Rev. 2022 Feb 1;2(2022):CD014217. doi: 10.1002/14651858.CD014217. Cochrane Database Syst Rev. 2022. PMID: 36321557 Free PMC article.
-
[Risk factors for low birth weight and intrauterine growth retardation in Santiago, Chile].Rev Med Chil. 1993 Oct;121(10):1210-9. Rev Med Chil. 1993. PMID: 8191127 Spanish.
-
Impact of Intermittent Presumptive Treatment for Malaria in Pregnancy on Hospital Birth Outcomes on the Kenyan Coast.Clin Infect Dis. 2023 Feb 8;76(3):e875-e883. doi: 10.1093/cid/ciac509. Clin Infect Dis. 2023. PMID: 35731850 Free PMC article.
-
Low birth weight in urban Harare.Cent Afr J Med. 1996 Nov;42(11):323-6. Cent Afr J Med. 1996. PMID: 9130415
-
An assessment of low birthweight risk in primiparae as an indicator of malaria control in pregnancy.Int J Epidemiol. 1991 Mar;20(1):276-83. doi: 10.1093/ije/20.1.276. Int J Epidemiol. 1991. PMID: 2066235 Review.
Cited by
-
Too hot to thrive: a qualitative inquiry of community perspectives on the effect of high ambient temperature on postpartum women and neonates in Kilifi, Kenya.BMC Pediatr. 2024 Jan 13;24(1):36. doi: 10.1186/s12887-023-04517-w. BMC Pediatr. 2024. PMID: 38216969 Free PMC article.
References
-
- WHO. International statistical classification of diseases and related health problems. World Health Organization; 2004. https://apps.who.int/iris/handle/10665/42980. Accessed 28 Dec 2022.
MeSH terms
Grants and funding
- OPP1131320/Bill and Melinda Gates Foundation
- 212176/Z/18/Z/Wellcome Trust Principal Research Fellowship
- MR/M007367/1/MRC/DFID/Wellcome Trust Joint Global Health Trials scheme
- MR/M007367/1/MRC_/Medical Research Council/United Kingdom
- 203077/Z/16/Z/Wellcome Trust to the Core Award for the East Africa Major Overseas Programme
LinkOut - more resources
Full Text Sources
