

Mesenchymal-epithelial transition in lymph node metastases of oral squamous cell carcinoma is accompanied by ZEB1 expression
- PMID: 37076857
- PMCID: PMC10114373
- DOI: 10.1186/s12967-023-04102-w
Mesenchymal-epithelial transition in lymph node metastases of oral squamous cell carcinoma is accompanied by ZEB1 expression
Erratum in
-
Correction: Mesenchymal-epithelial transition in lymph node metastases of oral squamous cell carcinoma is accompanied by ZEB1 expression.J Transl Med. 2024 Mar 14;22(1):277. doi: 10.1186/s12967-024-04998-y. J Transl Med. 2024. PMID: 38486213 Free PMC article. No abstract available.
Abstract
Background: Oral squamous cell carcinoma (OSCC), an HPV-negative head and neck cancer, frequently metastasizes to the regional lymph nodes but only occasionally beyond. Initial phases of metastasis are associated with an epithelial-mesenchymal transition (EMT), while the consolidation phase is associated with mesenchymal-epithelial transition (MET). This dynamic is referred to as epithelial-mesenchymal plasticity (EMP). While it is known that EMP is essential for cancer cell invasion and metastatic spread, less is known about the heterogeneity of EMP states and even less about the heterogeneity between primary and metastatic lesions.
Methods: To assess both the heterogeneity of EMP states in OSCC cells and their effects on stromal cells, we performed single-cell RNA sequencing (scRNAseq) of 5 primary tumors, 9 matching metastatic and 5 tumor-free lymph nodes and re-analyzed publicly available scRNAseq data of 9 additional primary tumors. For examining the cell type composition, we performed bulk transcriptome sequencing. Protein expression of selected genes were confirmed by immunohistochemistry.
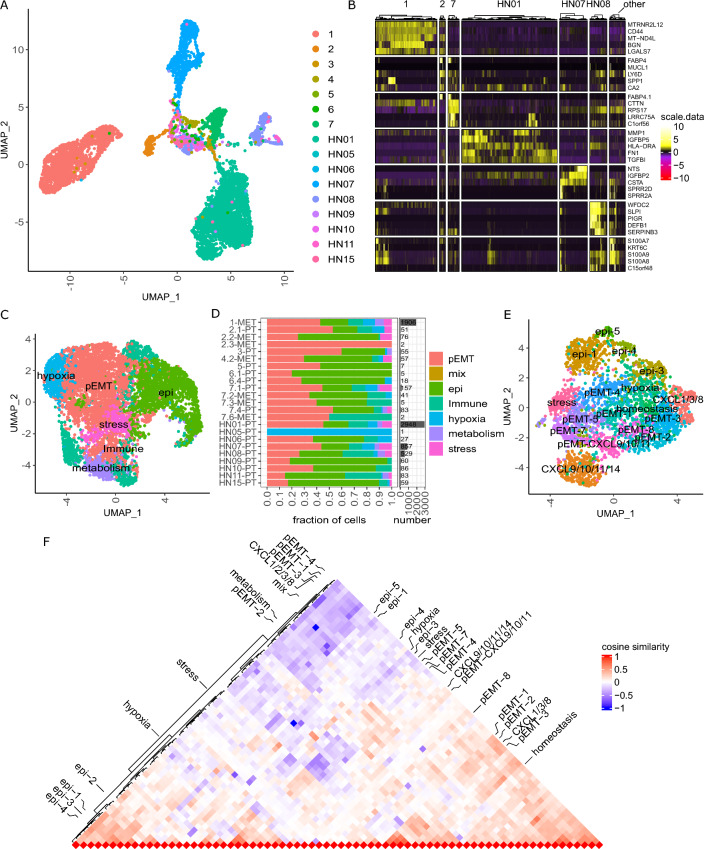
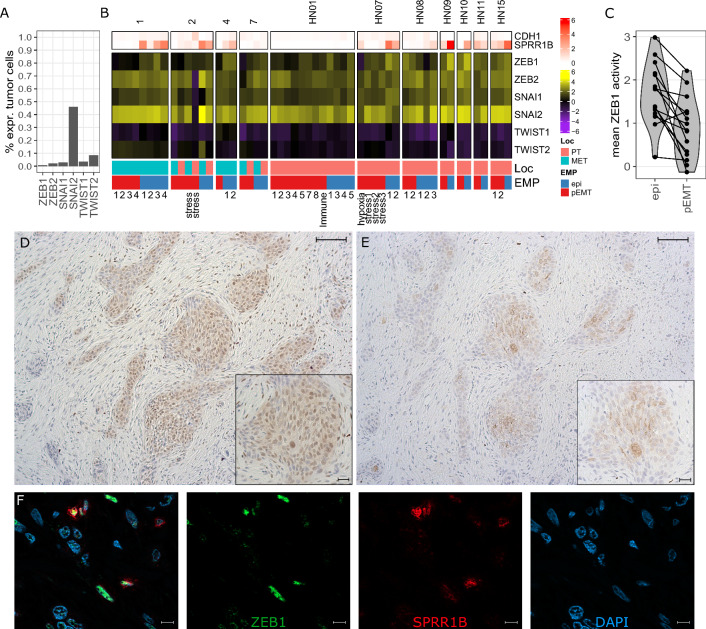
Results: From the 23 OSCC lesions, the single cell transcriptomes of a total of 7263 carcinoma cells were available for in-depth analyses. We initially focused on one lesion to avoid confounding inter-patient heterogeneity and identified OSCC cells expressing genes characteristic of different epithelial and partial EMT stages. RNA velocity and the increase in inferred copy number variations indicated a progressive trajectory towards epithelial differentiation in this metastatic lesion, i.e., cells likely underwent MET. Extension to all samples revealed a less stringent but essentially similar pattern. Interestingly, MET cells show increased activity of the EMT-activator ZEB1. Immunohistochemistry confirmed that ZEB1 was co-expressed with the epithelial marker cornifin B in individual tumor cells. The lack of E-cadherin mRNA expression suggests this is a partial MET. Within the tumor microenvironment we found immunomodulating fibroblasts that were maintained in primary and metastatic OSCC.
Conclusions: This study reveals that EMP enables different partial EMT and epithelial phenotypes of OSCC cells, which are endowed with capabilities essential for the different stages of the metastatic process, including maintenance of cellular integrity. During MET, ZEB1 appears to be functionally active, indicating a more complex role of ZEB1 than mere induction of EMT.
Keywords: EMT; Epithelial–mesenchymal plasticity; Heterogeneity; MET; Oral cavity; Partial EMT; Single cell RNA; Squamous cell carcinoma; ZEB1.
© 2023. The Author(s).
Conflict of interest statement
JCB is receiving speaker’s bureau honoraria from Amgen, Pfizer, MerckSerono, Recordati and Sanofi, is a paid consultant/advisory board member/DSMB member for Boehringer Ingelheim, InProTher, MerckSerono, Pfizer, 4SC, and Sanofi/Regeneron. His group receives research grants from Bristol-Myers Squibb, Merck Serono, HTG, IQVIA, and Alcedis. None of these activities are related to the present manuscript. The other authors including KH, CS, LP, FF, PG, JG, NS, IS declare no competing of interests.
Figures


Similar articles
-
The FUS/COL11A1/ZEB1 Axis Contributes to the Development of Oral Squamous Cell Carcinoma.J Oral Pathol Med. 2025 Mar;54(3):182-191. doi: 10.1111/jop.13610. Epub 2025 Feb 6. J Oral Pathol Med. 2025. PMID: 39915978
-
Tumor-suppressive roles of ΔNp63β-miR-205 axis in epithelial-mesenchymal transition of oral squamous cell carcinoma via targeting ZEB1 and ZEB2.J Cell Physiol. 2018 Oct;233(10):6565-6577. doi: 10.1002/jcp.26267. Epub 2018 May 10. J Cell Physiol. 2018. PMID: 29150940 Free PMC article.
-
GATA6 regulates expression of annexin A10 (ANXA10) associated with epithelial-mesenchymal transition of oral squamous cell carcinoma.Arch Oral Biol. 2022 Dec;144:105569. doi: 10.1016/j.archoralbio.2022.105569. Epub 2022 Oct 10. Arch Oral Biol. 2022. PMID: 36265396
-
Molecular Markers of Occult Lymph Node Metastasis in Head and Neck Squamous Cell Carcinoma (HNSCC) Patients.Front Biosci (Landmark Ed). 2025 Feb 20;30(2):25267. doi: 10.31083/FBL25267. Front Biosci (Landmark Ed). 2025. PMID: 40018925 Review.
-
Epithelial-to-mesenchymal transition in oral squamous cell carcinoma: Challenges and opportunities.Int J Cancer. 2021 Apr 1;148(7):1548-1561. doi: 10.1002/ijc.33352. Epub 2020 Oct 29. Int J Cancer. 2021. PMID: 33091960 Review.
Cited by
-
The spatial distribution of intermediate fibroblasts and myeloid-derived cells dictate lymph node metastasis dynamics in oral cancer.J Transl Med. 2024 Aug 13;22(1):759. doi: 10.1186/s12967-024-05511-1. J Transl Med. 2024. PMID: 39138492 Free PMC article.
-
The PTTG1/VASP axis promotes oral squamous cell carcinoma metastasis by modulating focal adhesion and actin filaments.Mol Oncol. 2025 May;19(5):1517-1531. doi: 10.1002/1878-0261.13779. Epub 2025 Jan 10. Mol Oncol. 2025. PMID: 39792809 Free PMC article.
-
New perspectives on biology, disease progression, and therapy response of head and neck cancer gained from single cell RNA sequencing and spatial transcriptomics.Oncol Res. 2023 Nov 15;32(1):1-17. doi: 10.32604/or.2023.044774. eCollection 2023. Oncol Res. 2023. PMID: 38188682 Free PMC article. Review.
-
Harnessing the tumor microenvironment: targeted cancer therapies through modulation of epithelial-mesenchymal transition.J Hematol Oncol. 2025 Jan 13;18(1):6. doi: 10.1186/s13045-024-01634-6. J Hematol Oncol. 2025. PMID: 39806516 Free PMC article. Review.
-
Correction: Mesenchymal-epithelial transition in lymph node metastases of oral squamous cell carcinoma is accompanied by ZEB1 expression.J Transl Med. 2024 Mar 14;22(1):277. doi: 10.1186/s12967-024-04998-y. J Transl Med. 2024. PMID: 38486213 Free PMC article. No abstract available.
References
Publication types
MeSH terms
Substances
Associated data
LinkOut - more resources
Full Text Sources
Medical
Molecular Biology Databases
Miscellaneous
