. 2023 Apr 19;16(1):11.
doi: 10.1186/s13072-023-00485-8.

Ovulatory signal-triggered chromatin remodeling in ovarian granulosa cells by HDAC2 phosphorylation activation-mediated histone deacetylation

Affiliations

Ovulatory signal-triggered chromatin remodeling in ovarian granulosa cells by HDAC2 phosphorylation activation-mediated histone deacetylation

Jiamin Jin et al. Epigenetics Chromatin. .

Abstract

Background: Epigenetic reprogramming is involved in luteinizing hormone (LH)-induced ovulation; however, the underlying mechanisms are largely unknown.

Results: We here observed a rapid histone deacetylation process between two waves of active transcription mediated by the follicle-stimulating hormone (FSH) and the LH congener human chorionic gonadotropin (hCG), respectively. Analysis of the genome-wide H3K27Ac distribution in hCG-treated granulosa cells revealed that a rapid wave of genome-wide histone deacetylation remodels the chromatin, followed by the establishment of specific histone acetylation for ovulation. HDAC2 phosphorylation activation coincides with histone deacetylation in mouse preovulatory follicles. When HDAC2 was silenced or inhibited, histone acetylation was retained, leading to reduced gene transcription, retarded cumulus expansion, and ovulation defect. HDAC2 phosphorylation was associated with CK2α nuclear translocation, and inhibition of CK2α attenuated HDAC2 phosphorylation, retarded H3K27 deacetylation, and inactivated the ERK1/2 signaling cascade.

Conclusions: This study demonstrates that the ovulatory signal erases histone acetylation through activation of CK2α-mediated HDAC2 phosphorylation in granulosa cells, which is an essential prerequisite for subsequent successful ovulation.

Keywords: Chromatin remodeling; Granulosa cells; H3K27Ac; HDAC2; Luteinizing hormone; Ovulation.


Conflict of interest statement

The authors declare no competing interests.

Figures
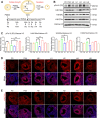
Fig. 1
Fig. 1
Transcription and Histone Acetylation Dynamics during the Process of Follicle Growth and Ovulation. A Depiction of the controlled ovarian hyperstimulation protocol in a mouse. Immature female mice were primed with pregnant mare chorionic gonadotropin (PMSG) to stimulate follicular growth, followed by injection with human chorionic gonadotropin (hCG) 48 h later to induce ovulation. At the indicated timepoints, the ovaries were collected for analysis. P0, P24, H0: 0 h, 24 h, and 48 h after PMSG treatment. H1-8: 1 h, 2 h, 4 h, and 8 h after hCG treatment, equal to LH surge. The arrowheads indicate two types of granulosa cells (GCs) in the antral follicle. B The levels of transcription and histone acetylation were dramatically downregulated between the two surges mediated by PMSG and hCG. The ovaries at the indicated timepoints were collected and lysed for Western blotting with antibodies against phosphorylated RNA polymerase CTD S2 (pPol II(S2)), H3K27Ac, H4K16Ac, H3K9Ac, and histone H3. C Quantitative analysis of pPol II(S2), H3K27Ac, H4K16Ac, and H3K9Ac levels with histone H3 normalization in panel B using the ImageJ software. The data were expressed as the mean ± SD. P value was determined by two-way ANOVA, followed by Tukey’s post-test. *P < 0.05, **P < 0.01. D, E The immunofluorescence results exhibiting the dynamics of pPol II (S2) (D, red) and H3K27Ac (E, red) in ovarian antral follicles at the indicated timepoints post-PMSG or/and hCG treatment. The nuclei were stained with DAPI (blue). Scale bar = 100 μm. N = 3 biologically independent experiments
Fig. 2
Fig. 2
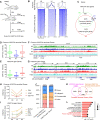
The Ovulatory Hormone Signal Induces Genome-wide H3K27Ac Deacetylation and Subsequent Histone Acetylation. A A diagram exhibiting the sample collection for H3K27Ac ChIP-seq. H0, H1, H4: 0 h, 1 h and 4 h after hCG treatment. B H3K27Ac enrichment around peak center for ovaries at 0 h, 1 h, and 4 h post-hCG treatment. The upper panels show the average signal profile around detected peak centers (± 2 kb). The lower heatmap shows H3K27Ac read density for a total of 9,868 shared peaks of H0 and H4 around the peak centers. Two independent ChIP-seq experiments were sequenced, as were two matched input controls. C A Venn diagram of H3K27Ac ChIP-seq genes. H3K27Ac ChIP-seq was performed using the ovaries at 0 h, 1 h, and 4 h post-hCG treatment. The numbers indicate the total genes identified in each timepoint. D, E The box blot represents the average RPKM (reads per kilobase per million) of common H3K27Ac-enriched genes (D) and H3K27Ac-gain genes (E). The data are presented as the mean ± SD. F, G The UCSC Genome Browser tracks demonstrating the occupancy of H3K27Ac on Fshr and Lhcgr genes (representing the common H3K27Ac-enriched genes before and after ovulatory signal trigger) and Ereg, Sult1e1, and Star genes (belonging to the H3K27Ac-gain genes). H, I The ChIP-qPCR validation of common H3K27Ac-enriched genes and H3K27Ac-gain at 0, 1, and 4 h post-hCG injection. J The stacked bar chart showing the genomic distribution of H3K27Ac occupancy of common H3K27Ac-enriched genes and H3K27Ac-gain genes. K Venn diagram depicting the overlapped gene number of significantly upregulated genes after hCG induction (extracted from GSE119508) with H3K27Ac-gain or common H3K27Ac-enriched genes. L Gene Ontology (GO) analysis demonstrates the biological process (BP) of upregulated genes with H3K27Ac-gain post-hCG induction
Fig. 3
Fig. 3
The Expression and Activity of HDAC2 at the Initial Stage of Ovulation. A RT-qPCR results demonstrate the mRNA expression levels of HDACs (Hdac1-10) in ovaries at different timepoints. B The protein levels of HDAC1, HDAC2, pHDAC2, and Histone H3 were determined by Western blotting in ovaries at different timepoints. P0, P24: 0 h and 24 h after PMSG treatment. H0–H8: 0, 1, 2, 4, and 8 h after hCG treatment followed by PMSG treatment for 48 h. C, D Representative immunofluorescence for HDAC2 (red in C) and pHDAC2 (red in D) in large antral follicles at different timepoints after PMSG and hCG treatment. Scale Bar = 100 μm. H0, H1, and H4: 0 h, 1 h, and 4 h after hCG treatment followed by PMSG treatment for 48 h. White dotted circles indicate cumulus cells and oocyte complex (COC). E, F Quantities of HDAC2 and pHDAC2 signal intensity in the COC in panels C and D. Data are presented as the mean ± SD (two-tailed unpaired t-test). G The levels of HDAC2 activity in GCs at different timepoints were determined using an in vitro assay kit. P24: 24 h after PMSG treatment. H0–H4: 0, 1, 2, and 4 h after hCG treatment, followed by PMSG treatment for 48 h. All data are presented as the mean ± SD. Two-tailed unpaired t-tests were performed for experiments depicted in panels E–F. One-way ANOVA was performed, followed by Turkey’s multiple comparisons test for experiments depicted in panel G. NS, no significance, *P < 0.05, **P < 0.01, ***P < 0.001
Fig. 4
Fig. 4
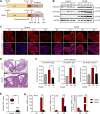
HDAC2 is Essential for Histone Deacetylation, Ovulation-specific Genes’ Transcription, and Cumulus Expansion. A Western blotting results demonstrating the dynamics of pHDAC2 and the increased H3K27Ac level with the transfection of Hdca2 siRNAs in mouse primary GCs. Primary GCs were transfected with siRNAs against negative control (siNC) or Hdac2 (siHdac2) for 24 h, followed by the addition of 10 uM Forskolin (FSK) and 20 nM PMA to activate the ovulatory signal. B The representative images show the cumulus cell expansion capacity in the si-NC and si-Hdac2 groups. C The Hdac2 mRNA level was determined by RT-qPCR in cumulus cells derived from COCs of the si-NC and si-Hdac2 groups. The data are presented as the mean ± SD with a t-test on log-transformed values. ***P < 0.001. D Quantification of the indicated ovulatory specific genes expression in primary GCs by RT-qPCR following ovulatory signal in the si-NC and si-Hdac2 groups. E The RT-qPCR results for ovulatory specific genes’ mRNA levels in COCs from the si-NC and si-Hdac2 groups. The data are presented as the mean ± SD. One-way ANOVA followed by Turkey’s multiple comparisons test on log-transformed values. NS, no significance, *P < 0.05, ***P < 0.001, ANOVA, analysis of variance. P0, P24, H0: 0 h, 24 h, and 48 h after PMSG treatment. H1–H8: 1, 2, 4, and 8 h post-hCG treatment
Fig. 5
Fig. 5
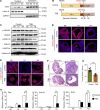
HDAC2-mediated Deacetylation is Essential for Transcription Switching and Successful Ovulation. A A diagram depicting the experimental design. FK228, the inhibitor of HDAC1/2, was pretreated for 4 h before hCG injection to induce ovulation. Black arrows indicate the time points when the ovaries were collected. H0–14: 0 h, 1 h, 4 h, 8 h, and 14 h after hCG treatment. B Western blotting of the main acetylated histones at different timepoints post-hCG in the control and FK228 groups. C Immunofluorescence of H3K27Ac at different timepoints (0, 1, 4, and 8 h) after hCG treatment in the control and FK228 groups. Scale bar = 100 μm. D The ovary morphology with hematoxylin and eosin staining from the control and FK228 groups at 14 h post-hCG. E The average oocyte numbers ovulated per mouse. The results are presented as the mean ± SD. ***P < 0.001, calculated by t-test. F ChIP-qPCR analysis of H3K27Ac on Ereg, Star, and Sult1e1 at 0 h and 4 h post-hCG pre-treated with or without FK228. G The relative mRNA levels by RT-qPCR of Ereg, Star, and Sult1e1 at 0, 4, and 8 h post-hCG in the control and FK228 groups. The fold change was represented by setting the relative level of 0 h in the control group as 1. The results (panels F and G) are presented as the mean ± SD. *P < 0.05, **P < 0.01, as calculated by one-way ANOVA, followed by Turkey’s multiple comparisons test on log-transformed values
Fig. 6
Fig. 6
CK2α Nuclear Translocation is Required for HDAC2 Phosphorylation, H3K27Ac Deacetylation, and Ovulation. A Western blotting of CK2α in nuclear and cytoplasm fragmentation of ovaries at the indicated timepoints of PMSG or hCG. B A diagram depicting the experimental design. TBB is an inhibitor of CK2α. H0–H4: 0, 1, and 4 h after the hCG treatment. C Western blotting analysis for H3K27Ac, HDAC2, pHDAC2, ERK1/2, and pERK1/2 at different timepoints (0, 1, and 4 h) post-hCG in the control and TBB groups. D, E Immunofluorescence of pHDAC2 (D, red) and H3K27Ac (E, red) at different timepoints (0, 1, and 4 h) after hCG treatment in the control and TBB groups. Nuclei were co-stained with DAPI (n = 3). Scale bar = 100 μm. F Hematoxylin and eosin staining showed that the TTB treatment inhibits cumulus expansion and ovulation. The mice ovaries were collected at 14-h post-hCG in mice of the control and TBB groups (n = 9). Scale bar = 100 um. G The bar graph depicting the ovulated oocyte numbers from mice in the control and TBB groups (n = 9). Data are presented by the mean ± SD. P value was determined by t-test. ***P < 0.001. H RT-qPCR analysis of the mRNA levels of ovulatory specific genes, including Ereg, Star, and Sult1e1. The fold change was represented by setting the relative level of 0 h in the control group as 1. The results are represented as mean ± SD. *P < 0.05, **P < 0.01, calculated by one-way ANOVA followed by Turkey’s multiple comparisons tests
Fig. 7
Fig. 7
Proposed Chromatin Remodeling Model for LH/hCG-induced Ovulation. During the antral follicle growth, the GCs display high levels of histone acetylation catalyzed by histone acetylation transferases (HATs) as well as active transcription in response to FSH. Once LH surge or hCG trigger, the nuclear translocation CK2α enhances HDAC2 phosphorylation, thereby deacetylating histones non-selectively. Meanwhile, LH/hCG induces ERK1/2 phosphorylation activation to induce histone acetylation by HATs at ovulation-specific genes

Similar articles

Cited by

References

    1. Richards JS, Jahnsen T, Hedin L, Lifka J, Ratoosh S, Durica JM, Goldring NB. Ovarian follicular development: from physiology to molecular biology. Recent Prog Horm Res. 1987;43:231–276. - PubMed
    1. Nef S, Stevant I, Greenfield A. Characterizing the bipotential mammalian gonad. Curr Top Dev Biol. 2019;134:167–194. doi: 10.1016/bs.ctdb.2019.01.002. - DOI - PubMed
    1. Richards JS, Russell DL, Robker RL, Dajee M, Alliston TN. Molecular mechanisms of ovulation and luteinization. Mol Cell Endocrinol. 1998;145(1–2):47–54. doi: 10.1016/S0303-7207(98)00168-3. - DOI - PubMed
    1. Casarini L, Lispi M, Longobardi S, Milosa F, La Marca A, Tagliasacchi D, Pignatti E, Simoni M. LH and hCG action on the same receptor results in quantitatively and qualitatively different intracellular signalling. PLoS ONE. 2012;7(10):e46682. doi: 10.1371/journal.pone.0046682. - DOI - PMC - PubMed
    1. Park JY, Su YQ, Ariga M, Law E, Jin SL, Conti M: EGF-like growth factors as mediators of LH action in the ovulatory follicle. Science (80- ) 2004, 303(5658):682–684. - PubMed

Publication types