. 2021 Apr 26:2:e4.
doi: 10.1017/qpb.2021.6. eCollection 2021.

Comparative transcriptomics reveals desynchronisation of gene expression during the floral transition between Arabidopsis and Brassica rapa cultivars

Affiliations

Comparative transcriptomics reveals desynchronisation of gene expression during the floral transition between Arabidopsis and Brassica rapa cultivars

Alexander Calderwood et al. Quant Plant Biol. .

Abstract

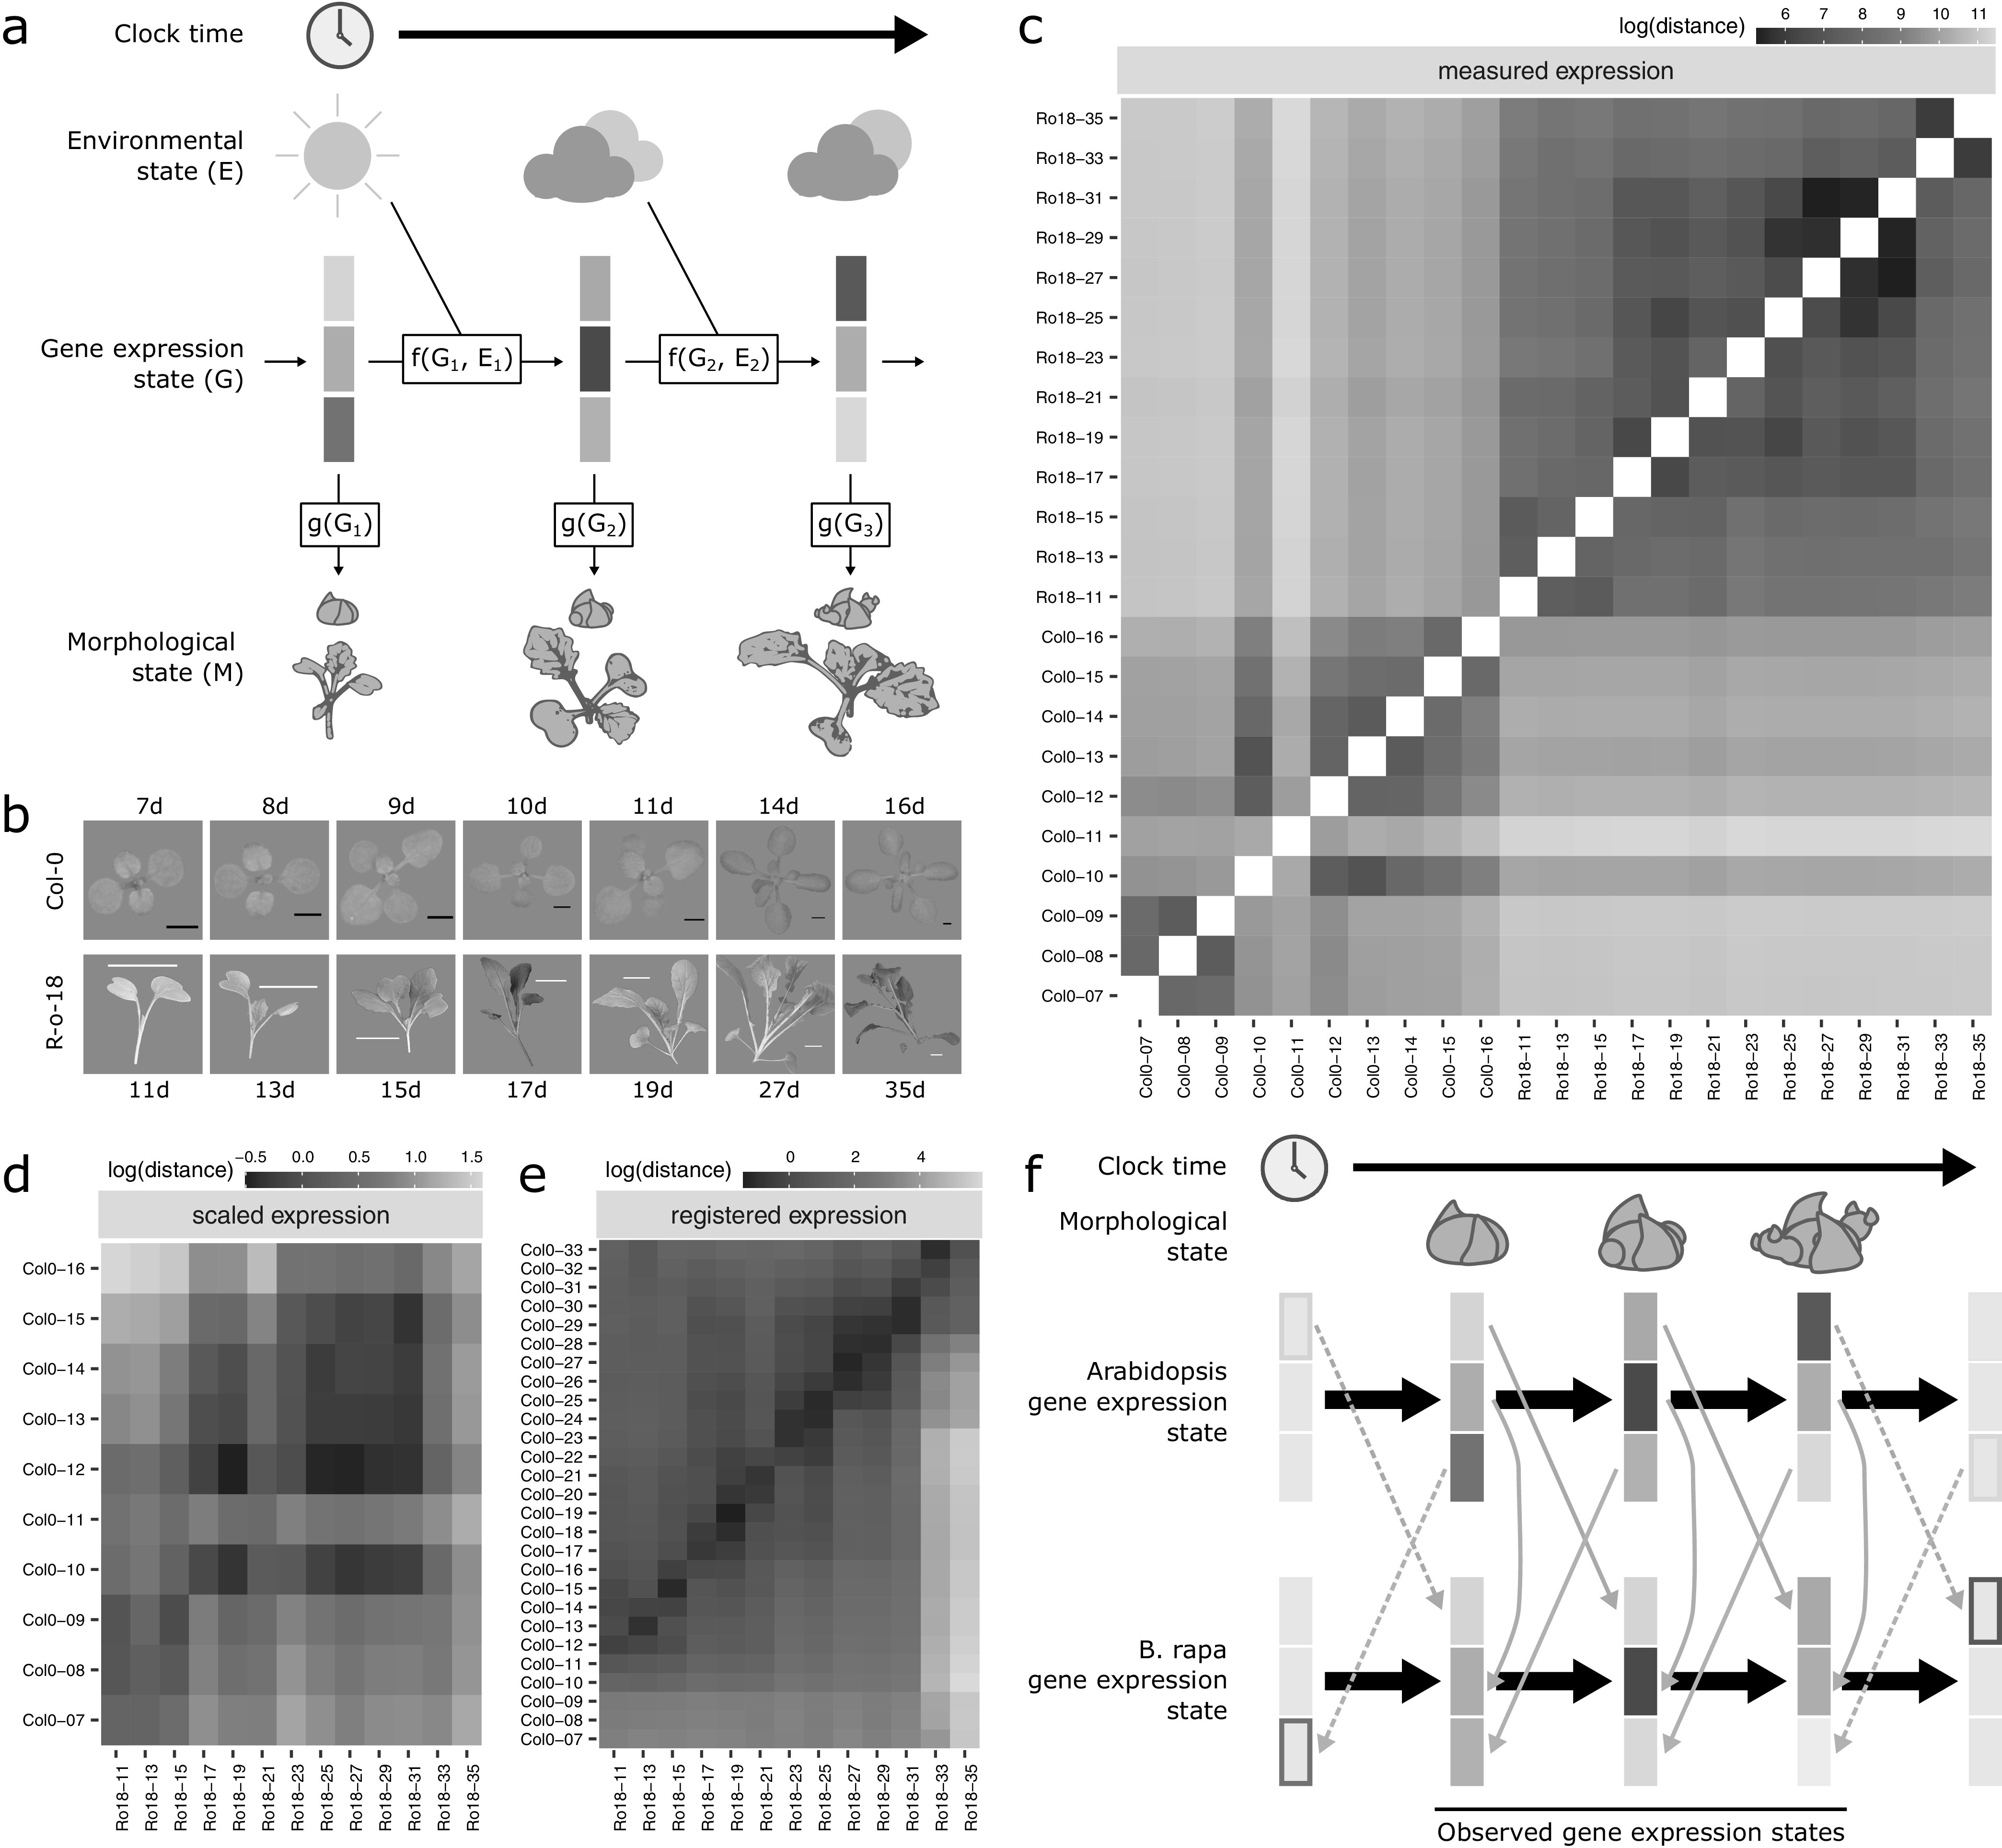
Comparative transcriptomics can be used to translate an understanding of gene regulatory networks from model systems to less studied species. Here, we use RNA-Seq to determine and compare gene expression dynamics through the floral transition in the model species Arabidopsis thaliana and the closely related crop Brassica rapa. We find that different curve registration functions are required for different genes, indicating that there is no single common 'developmental time' between Arabidopsis and B. rapa. A detailed comparison between Arabidopsis and B. rapa and between two B. rapa accessions reveals different modes of regulation of the key floral integrator SOC1, and that the floral transition in the B. rapa accessions is triggered by different pathways. Our study adds to the mechanistic understanding of the regulatory network of flowering time in rapid cycling B. rapa and highlights the importance of registration methods for the comparison of developmental gene expression data.

Keywords: Arabidopsis; Brassica rapa; FT; SOC1; comparative transcriptomics; flowering.


Conflict of interest statement

The authors declare no significant competing financial, professional or personal interests which might influence the performance or presentation of this study.

Figures

Fig. 1.
Fig. 1.
Registration resolves differences in gene expression states during development between Arabidopsis and Brassica rapa in the shoot apex. (a) During its life cycle, a plant develops as a consequence of interacting environmental and gene expression states. Current developmental state is a direct consequence of gene expression and can often be assayed based on morphology. (b) Representative pictures of plants over the developmental time series. Black scale bar is 2 mm, and white scale bar is 2 cm. Col-0 images are reproduced from Klepikova et al., 2015). (c–e) Heatmaps show the gene expression distance between samples taken from the apex of R-o-18 or Col-0 at varying days after germination. Gene expression distance between pairs of samples is calculated as the average squared difference in expression between homologous pairs of genes. (c) Measured gene expression counts are not similar between species over time. For comparisons made within each genotype (lower-left and upper-right quadrants), samples taken from points close in time (points near diagonal line) are more similar to each other than to samples taken from different times (points far from diagonal). Comparing between species (upper-left and lower-right quadrants), however, reveals no obvious structure. This suggests that species in similar morphological developmental states do not necessarily exhibit similar gene expression. (d) Scaled expression values are used to control for differences in magnitude. Note the change of axes from (c) to compare only between species. In contrast to (c), some diagonal structure is now apparent, reflecting some correspondence between expression at similar times in different species. (e) Bayesian model selection suggests that for many genes, differences between Col-0 and R-o-18 are more likely to stem from desynchronisation of the same expression patterns, rather than different expression patterns per se (see Section 2). The degree of desynchronisation differs between genes, and after this is accounted for, similar gene expression states between R-o-18 and Col-0 become apparent (block structure along the diagonal). This shows that there is a common progression through more gene states than just the blocks evident in (d). (f) Genes with similar individual expression profiles exhibit different optimal registration functions between Arabidopsis and B. rapa, and so are differently synchronised. Here, the green gene is earlier in Arabidopsis than B. rapa, and the orange gene is later. Consequently, although each individual gene has a similar expression profile over time in both species, no equivalent gene expression states exist.
Fig. 2.
Fig. 2.
Key floral transition genes expression profiles are similar, but their timings are different between organisms. (a) Floral transition occurs at around Day 14 in Col-0 and Day 17 in R-o-18. The earliest morphologically identifiable floral meristems are highlighted by white arrows. By the next day, the meristem is clearly floral in both cases. Col-0 SEM images are reproduced from Klepikova et al. (2015). (b) Gene expression profile for five key floral transition genes in Arabidopsis thaliana Col-0, and Brassica rapa R-o-18. Expression of paralogues in R-o-18 are summed. Morphologically identified floral transition time is identified by vertical line. The timings of gene expression changes relative to other genes, and the floral transitions differ between R-o-18 and Col-0. mRNA abundance is reported in Trimmed Mean of M values normalised counts (TMMC). (c) In spite of this, individual gene expression profiles are similar between these two organisms, as they superimpose after a registration transformation. The expression profiles of some genes are stretched out in R-o-18 relative to Arabidopsis (stretch), and also may be delayed, or brought forward relative to other genes (shift). The table shows the registration transformations applied to these genes; stretch indicates the stretch factor applied to Col-0 data and shift indicates the delay applied in days after this transformation.
Fig. 3.
Fig. 3.
SOC1 is differentially regulated between B. rapa R-o-18 and Arabidopsis Col-0. CSI inferred gene regulatory networks between SVP, FLC, FUL and SOC1 in (a) Arabidopsis and (b) R-o-18. The likelihood of the observed gene expression data given an assumed regulatory link between each pair of genes is plotted. In the absence of prior information, this is proportional to the probability of a regulatory link between the gene pair given the observed gene expression data. (c) the difference between log likelihood in Col-0 and R-o-18. Numbers after gene abbreviation indicates the chromosome numbers of the orthologue. (d) proposed mechanistic model for the role of FUL during the floral transition, modified from Balanzà et al. (2014), in which FUL and FLC compete to dimerise with SVP. In Arabidopsis, the CSI method infers that regulation of SOC1 is via a balance of changing FLC and FUL expression. Conversely, in R-o-18, association is primarily between SOC1, and the A2 and A3 copies of FUL, suggesting that changes in the expression level of FLC are not relevant to controlling the upregulation of SOC1.
Fig. 4.
Fig. 4.
Developmental rates differ between Sarisha-14 and R-o-18 in the apex, and is not explained by FT expression. Plots of time (days) against t-SNE estimated projection of gene expression to one dimension. This is an estimate of the optimal projection of the gene expression data while maintaining the correct distances between samples. Samples nearer to each other on the y-axis in each plot have more similar gene expression. Samples taken from (a) leaf and (b) apex in R-o-18 (red) and Sarisha-14 (blue). In leaf, development of gene expression profiles over time appears to occur at approximately the same rate between accessions, such that the most similar samples are taken at the same time. In apex, development appears to occur faster in Sarisha-14 than R-o-18. Genes were filtered to only include genes which variation over time explained >50% of variance in gene expression in both accessions. In apex, 3,097 genes were used. In leaf, 10,035 genes were used (c). Gene expression of BraFT in R-o-18 and Sarisha-14 over development, inset graph shows expression before Day 18, so that early gene expression behaviour can be clearly seen. Vertical lines indicate the first timepoint with floral meristems identified in each accession. mRNA abundance is reported in TMM normalised counts (TMMC). Registration indicates that expression of FT in the leaf is approximately 2 days advanced in Sarisha-14 relative to R-o-18. This is not sufficient to account for the 7-day difference in timing of the floral transition. Upon examination of the expression profiles, FT expression in the R-o-18 leaf increases between Day 13 and Day 15, prior to floral transition at Day 17. FT expression is not detectible in Sarisha-14 prior to the floral transition at Day 10. Expression of FT in the Sarisha-14 leaf at floral transition is lower than in R-o-18 (Day 17). This shows that Sarisha-14 undergoes floral transition at the apex coincident with lower FT expression in the leaf than in R-o-18. It is not clear from these data whether FT is expressed in Sarisha-14 below the experimentally detectible limit prior to the floral transition. It is, therefore, unclear from these data whether the transition occurs in response to a reduced leaf FT signal, or even in its absence in Sarisha-14 grown under long-day conditions.
Fig. 5.
Fig. 5.
The aging pathway proceeds more rapidly in Sarisha-14 than in R-o-18. (a) Modified from the Flowering Interactive Database website (Bouché et al., 2016b), elements which were found to be differently expressed in the apex in prefloral Sarisha-14 (Day 9) and the nearest equivalent R-o-18 sample (Day 11) are highlighted in bold and underlined. The table gives the details of differently expressed gene identities, and log-fold change in Sarisha-14 relative to R-o-18. Differential expression of SOC1 is coincident with differential expression of SPLs and AP2-like genes, rather than FLC, FT, SVP or FD, implicating the endogenous Aging, Hormone or Sugar signalling pathways in priming the early floral transition of Sarisha-14. Phytohormone signalling is integrated through the regulation of DELLA proteins. The activity of DELLA proteins is regulated posttranslationally by GA, ABA, auxin and ethylene either directly or indirectly (Achard et al., ; Fu & Harberd, ; Lorrai et al., 2018). Activities of SPLs are regulated by DELLA proteins (Conti, 2017). miR156 and miR172 are master regulators of the transition from the juvenile to adult phase of vegetative development (Wu & Poethig, 2006). During the development, initially, high levels of mature miR156 and low levels of miR172 transition to low levels of miR156 and high levels of miR172 contribute to the juvenile to adult transition (Hong & Jackson, ; Wu & Poethig, 2006). miR156 primarily regulates SPLs via translational regulation (He et al., 2018). SOC1 is regulated by AP2-like transcription factors, and SPLs (Yant et al., 2010). AP2-like genes are regulated by the aging pathway, via largely via translational repression by miR172, although expression of the AP2-like gene SMZ has been found to depend on miR172 (Aukerman & Sakai, ; Chen, ; Yu et al., 2012a). (b) Pri-miRNA abundance is plotted as TMM normalised counts (TMMC) against days since germination. Pri-miRNA gene models were identified as described in Section 2. The ratio of miR156 to miR172 precursor RNA is lower in Sarisha-14 than in R-o-18 at equivalent timepoints. This is achieved primarily although reduced expression of pri-miR156, although pri-miR172 is also expressed at a slightly higher level in Sarisha-14 than in R-o-18. SMZ is transcriptionally regulated by miR172 (Yu et al., 2012a), and so its lower expression level in Sarisha-14 suggests that miR172 activity as well as precursor levels are also greater in Sarisha-14. Mean and 95% CIs are shown.

Similar articles

Cited by

References

    1. Abe, M., Kobayashi, Y., Yamamoto, S., Daimon, Y., Yamaguchi, A., Ikeda, Y., Ichinoki, H., Notaguchi, M., Goto, K., & Araki, T. (2005). FD, a bZIP protein mediating signals from the floral pathway integrator FT at the shoot apex. Science, 309, 1052–1056 - PubMed
    1. Achard, P., Cheng, H., De Grauwe, L., Decat, J., Schoutteten, H., Moritz, T., Van Der Straeten, D., Peng, J., & Harberd, N. P. (2006). Integration of plant responses to environmentally activated phytohormonal signals. Science, 311, 91–94 - PubMed
    1. Andrés, F., & Coupland, G. (2012). The genetic basis of flowering responses to seasonal cues. Nature Reviews Genetics, 13, 627–639 - PubMed
    1. Aukerman, M. J., & Sakai, H. (2003). Regulation of flowering time and floral organ identity by a microRNA and its APETALA2-like target genes. The Plant Cell, 15, 2730–2741 - PMC - PubMed
    1. Balanzà, V., Martínez-Fernández, I., & Ferrándiz, C. (2014). Sequential action of FRUITFULL as a modulator of the activity of the floral regulators SVP and SOC1. Journal of Experimental Botany, 65, 1193–1203 - PMC - PubMed

LinkOut - more resources