

Comprehensive analysis of prognostic value, immune implication and biological function of CPNE1 in clear cell renal cell carcinoma
- PMID: 37077419
- PMCID: PMC10106647
- DOI: 10.3389/fcell.2023.1157269
Comprehensive analysis of prognostic value, immune implication and biological function of CPNE1 in clear cell renal cell carcinoma
Abstract
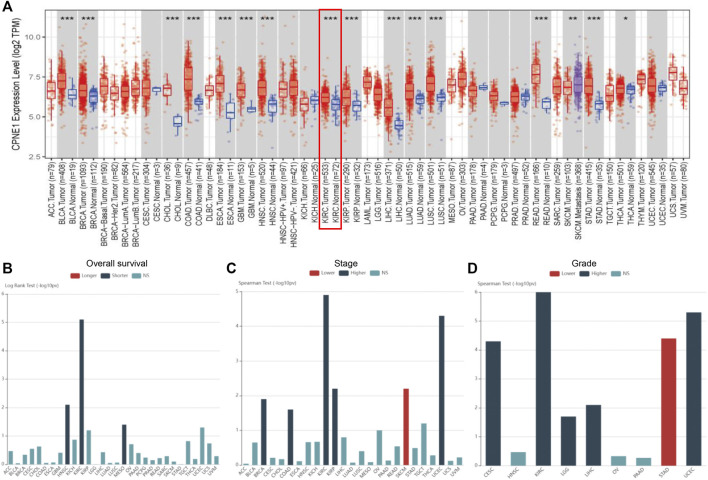
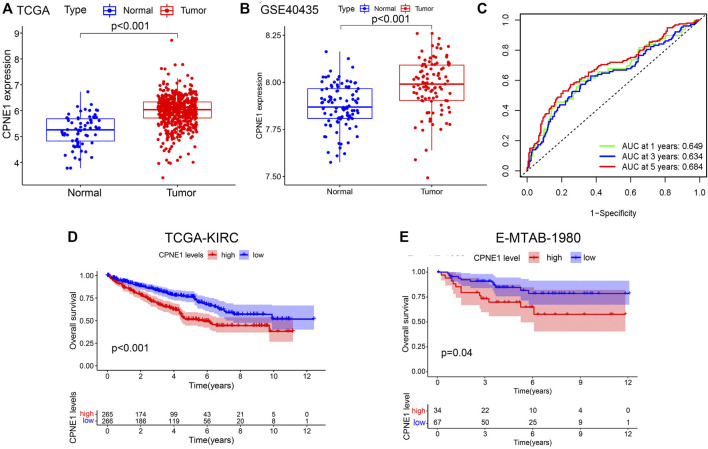
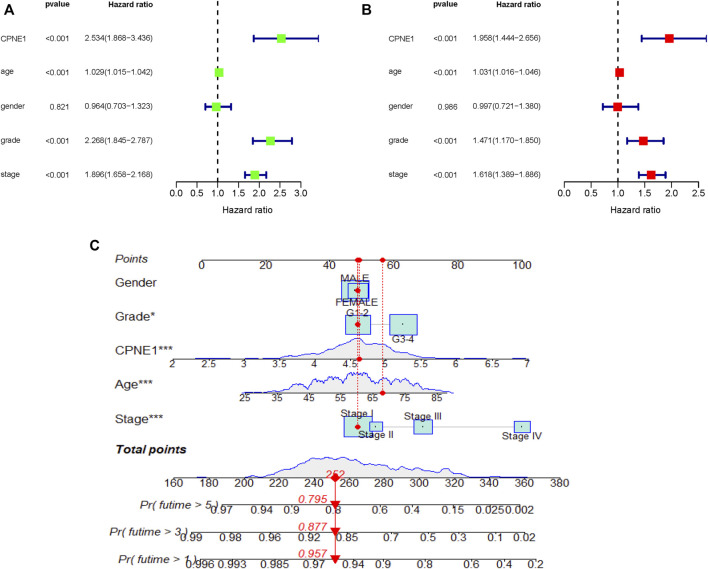
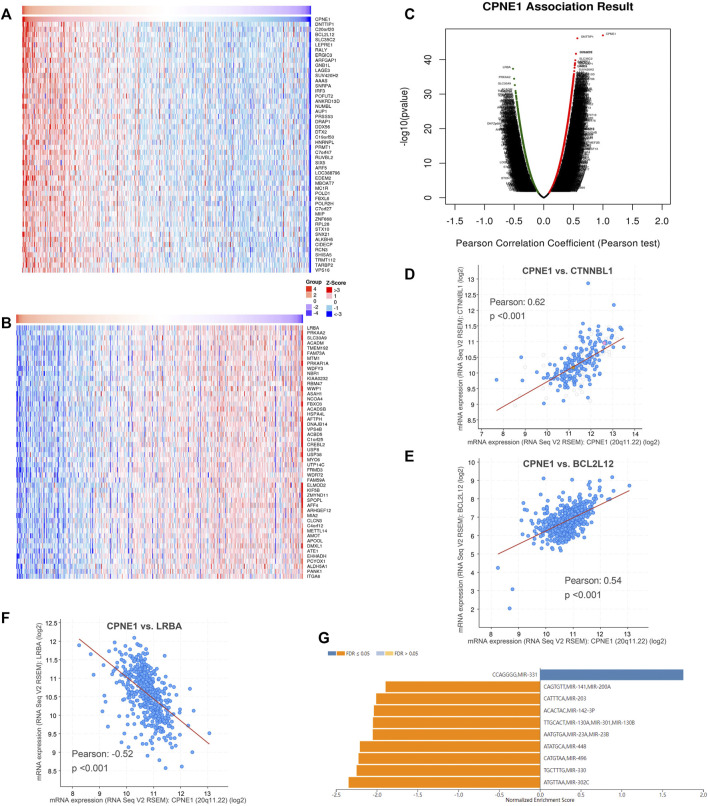
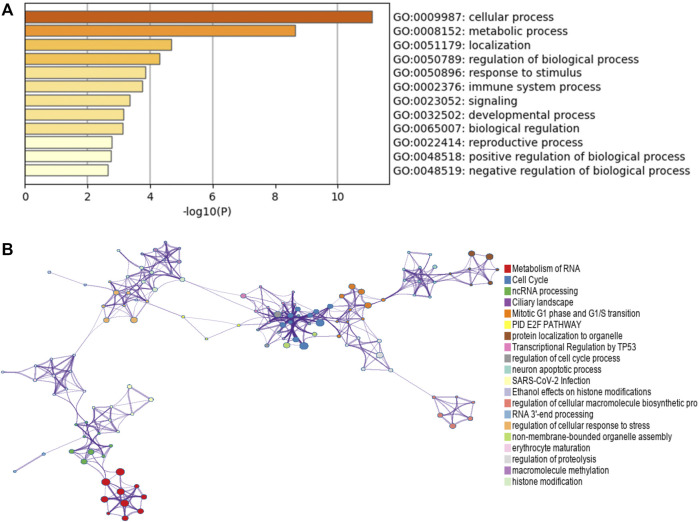
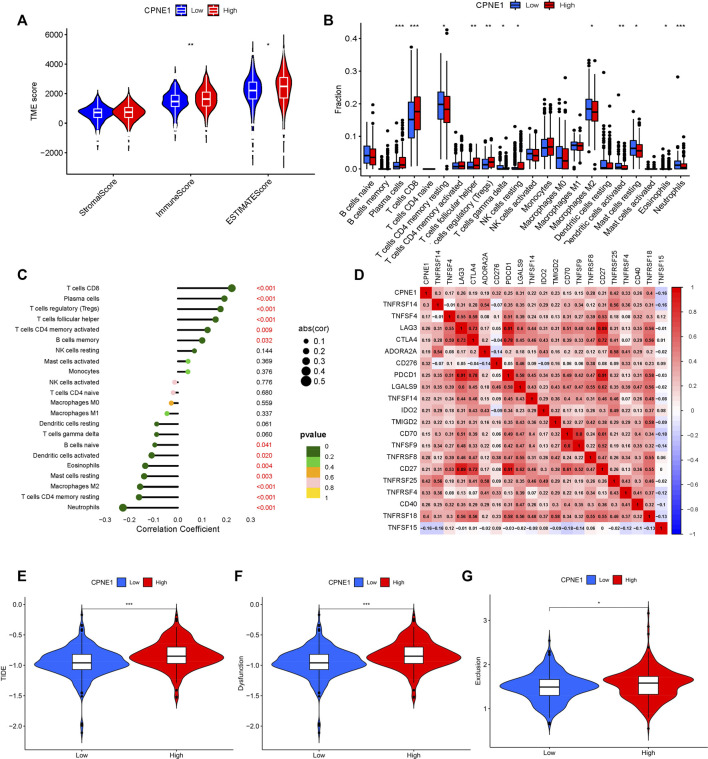
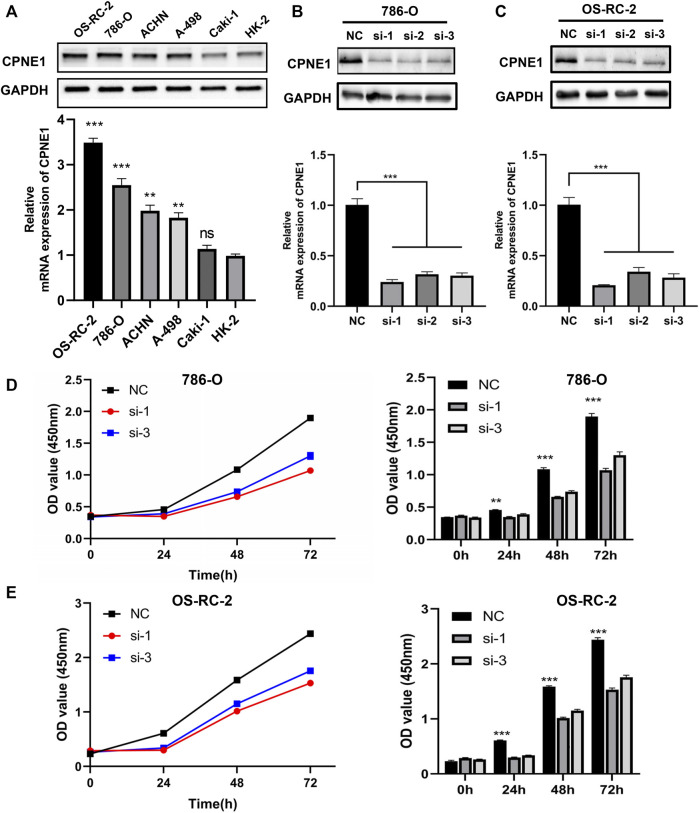
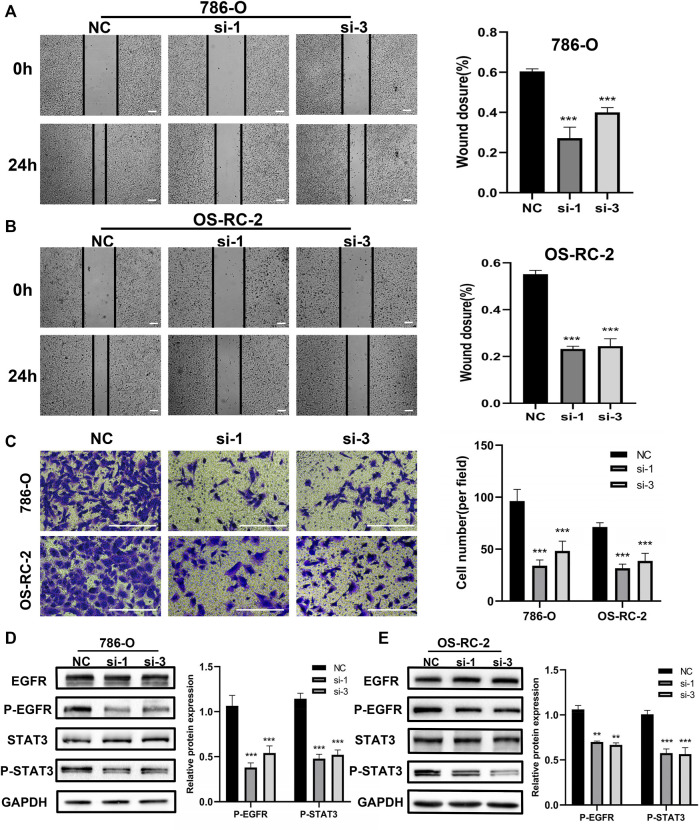
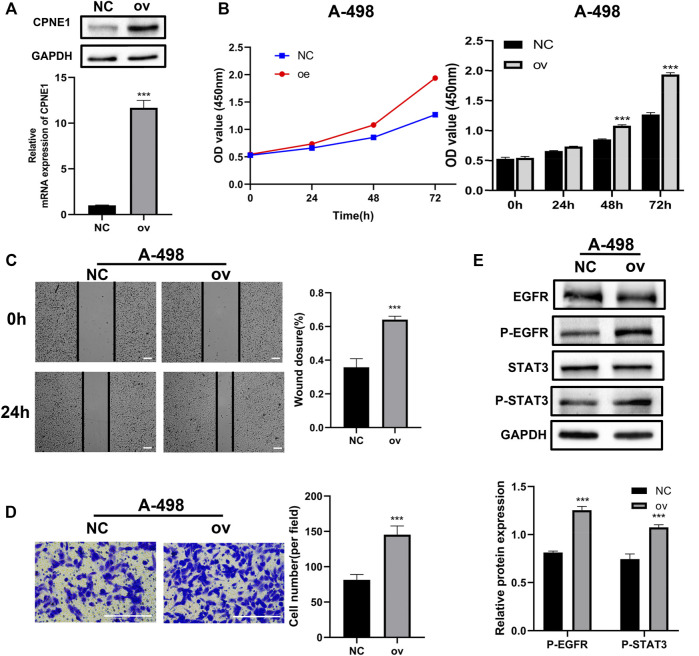
Background: Elevated expression of Copine-1 (CPNE1) has been proved in various cancers; however, the underlying mechanisms by which it affects clear cell renal cell carcinoma (ccRCC) are unclear. Methods: In this study, we applied multiple bioinformatic databases to analyze the expression and clinical significance of CPNE1 in ccRCC. Co-expression analysis and functional enrichment analysis were investigated by LinkedOmics, cBioPortal and Metascape. The relationships between CPNE1 and tumor immunology were explored using ESTIMATE and CIBERSORT method. In vitro experiments, CCK-8, wound healing, transwell assays and western blotting were conducted to investigate the effects of gain- or loss-of-function of CPNE1 in ccRCC cells. Results: The expression of CPNE1 was notably elevated in ccRCC tissues and cells, and significantly correlated with grade, invasion range, stage and distant metastasis. Kaplan-Meier and Cox regression analysis displayed that CPNE1 expression was an independent prognostic factor for ccRCC patients. Functional enrichment analysis revealed that CPNE1 and its co-expressed genes mainly regulated cancer-related and immune-related pathways. Immune correlation analysis showed that CPNE1 expression was significantly related to immune and estimate scores. CPNE1 expression was positively related to higher infiltrations of immune cells, such as CD8+ T cells, plasma cells and regulatory T cells, exhibited lower infiltrations of neutrophils. Meanwhile, elevated expression of CPNE1 was characterized by high immune infiltration levels, increased expression levels of CD8+ T cell exhaustion markers (CTLA4, PDCD1 and LAG3) and worse response to immunotherapy. In vitro functional studies demonstrated that CPNE1 promoted proliferation, migration and invasion of ccRCC cells through EGFR/STAT3 pathway. Conclusion: CPNE1 is a reliable clinical predictor for the prognosis of ccRCC and promotes proliferation and migration by activating EGFR/STAT3 signaling. Moreover, CPNE1 significantly correlates with immune infiltration in ccRCC.
Keywords: CPNE1; EGFR/STAT3; immune infiltration; prognosis; renal cell carcinoma.
Copyright © 2023 Zhou, He, Huang, Li, Zhang, Xia and Xiong.
Conflict of interest statement
The authors declare that the research was conducted in the absence of any commercial or financial relationships that could be construed as a potential conflict of interest.
Figures

Similar articles
-
CPNE1 is a potential prognostic biomarker, associated with immune infiltrates and promotes progression of hepatocellular carcinoma.Cancer Cell Int. 2022 Feb 9;22(1):67. doi: 10.1186/s12935-022-02485-2. Cancer Cell Int. 2022. PMID: 35139863 Free PMC article.
-
High GTSE1 expression promotes cell proliferation, metastasis and cisplatin resistance in ccRCC and is associated with immune infiltrates and poor prognosis.Front Genet. 2023 Mar 14;14:996362. doi: 10.3389/fgene.2023.996362. eCollection 2023. Front Genet. 2023. PMID: 36999057 Free PMC article.
-
Upregulation of CENPM is associated with poor clinical outcome and suppression of immune profile in clear cell renal cell carcinoma.Hereditas. 2023 Jan 13;160(1):1. doi: 10.1186/s41065-023-00262-3. Hereditas. 2023. PMID: 36635779 Free PMC article.
-
POLD1 as a Prognostic Biomarker Correlated with Cell Proliferation and Immune Infiltration in Clear Cell Renal Cell Carcinoma.Int J Mol Sci. 2023 Apr 6;24(7):6849. doi: 10.3390/ijms24076849. Int J Mol Sci. 2023. PMID: 37047824 Free PMC article.
-
Wiskott-Aldrich syndrome gene as a prognostic biomarker correlated with immune infiltrates in clear cell renal cell carcinoma.Front Immunol. 2023 Apr 12;14:1102824. doi: 10.3389/fimmu.2023.1102824. eCollection 2023. Front Immunol. 2023. PMID: 37122750 Free PMC article.
Cited by
-
Copine 1 predicts poor clinical outcomes by promoting M2 macrophage activation in ovarian cancer.Carcinogenesis. 2023 Dec 15;44(10-11):748-759. doi: 10.1093/carcin/bgad067. Carcinogenesis. 2023. PMID: 37747823 Free PMC article.
-
Integration of Single-Cell RNA Sequencing Data and Bulk Sequencing Data to Characterise the CD8+ T-Cell Exhaustion Mediated Immune Microenvironment in CRC.J Cell Mol Med. 2025 May;29(9):e70556. doi: 10.1111/jcmm.70556. J Cell Mol Med. 2025. PMID: 40356050 Free PMC article.
-
Characterization of extrachromosomal circular DNAs in plasma of patients with clear cell renal cell carcinoma.World J Urol. 2024 May 16;42(1):328. doi: 10.1007/s00345-024-05031-z. World J Urol. 2024. PMID: 38753087
References
-
- Bremnes R. M., Busund L. T., Kilvær T. L., Andersen S., Richardsen E., Paulsen E. E., et al. (2016). The role of tumor-infiltrating lymphocytes in development, progression, and prognosis of non-small cell lung cancer. J. Thorac. Oncol. official Publ. Int. Assoc. Study Lung Cancer 11 (6), 789–800. 10.1016/j.jtho.2016.01.015 - DOI - PubMed
LinkOut - more resources
Full Text Sources
Research Materials
Miscellaneous