. 2023 Apr;15(1):261-287.
doi: 10.1007/s12561-022-09354-6. Epub 2022 Sep 5.

A functional model for studying common trends across trial time in eye tracking experiments

Affiliations

A functional model for studying common trends across trial time in eye tracking experiments

Mingfei Dong et al. Stat Biosci. 2023 Apr.

Abstract

Eye tracking (ET) experiments commonly record the continuous trajectory of a subject's gaze on a two-dimensional screen throughout repeated presentations of stimuli (referred to as trials). Even though the continuous path of gaze is recorded during each trial, commonly derived outcomes for analysis collapse the data into simple summaries, such as looking times in regions of interest, latency to looking at stimuli, number of stimuli viewed, number of fixations or fixation length. In order to retain information in trial time, we utilize functional data analysis (FDA) for the first time in literature in the analysis of ET data. More specifically, novel functional outcomes for ET data, referred to as viewing profiles, are introduced that capture the common gazing trends across trial time which are lost in traditional data summaries. Mean and variation of the proposed functional outcomes across subjects are then modeled using functional principal components analysis. Applications to data from a visual exploration paradigm conducted by the Autism Biomarkers Consortium for Clinical Trials showcase the novel insights gained from the proposed FDA approach, including significant group differences between children diagnosed with autism and their typically developing peers in their consistency of looking at faces early on in trial time.

Keywords: Autism spectrum disorder; Eye tracking; Functional data analysis; Functional principal components analysis; Multilevel functional principal component analysis.


Conflict of interest statement

McPartland consults with Customer Value Partners, Bridgebio, Determined Health, and BlackThorn Therapeutics, has received research funding from Janssen Research and Development, serves on the Scientific Advisory Boards of Pastorus and Modern Clinics, and receives royalties from Guilford Press, Lambert, and Springer. Dawson is on the Scientific Advisory Boards of Janssen Research and Development, Akili Interactive, Inc, LabCorp, Inc, Roche Pharmaceutical Company, and Tris Pharma, and is a consultant to Apple, Gerson Lehrman Group, Guidepoint Global, Inc, and is CEO of DASIO, LLC. Dawson has stock interests in Neuvana, Inc. Dawson has the following patent No. 10,912,801 and patent applications: 62,757,234, 25,628,402, and 62,757,226. Dawson has developed technology, data, and/or products that have been licensed to Apple, Inc. and Cryocell, Inc. and Dawson and Duke University have benefited financially. Shic consults for Roche Pharmaceutical Company, Janssen Research and Development, BlackThorn Therapeutics, and BioStream Technologies.

Figures
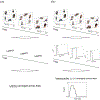
Fig. 1:
Fig. 1:
(a) Derivation of ET outcomes in traditional analyses. Sample arrays from the visual exploration paradigm contained 5 full-color stimuli: face with direct gaze (social object, black bar inserted over eyes to protect identity of actress), outline of face filled with blurred pattern, bird, mobile phone, and motor vehicle. (b) Derivation of functional ET outcomes (viewing profiles) retaining information across trial time.
Fig. 2:
Fig. 2:
(a) A trial-level indicator for the initial gaze being at the social object where the initial gaze lasts approximately 400 ms. (b) A trial-level indicator for the initial gaze being at the social object where a child’s initial gaze is on a nonsocial object. (c) A sample viewing profile for a subject from baseline in our application to the VE paradigm. (d) The longitudinally observed (T1, T2, T3) viewing profiles of the same sample subject from our application to the VE paradigm.
Fig. 3:
Fig. 3:
(a) Estimated overall mean viewing profile, μ(t). (b) Estimated group level shifts from the overall mean, ηd(t), d = 1,2. (c) Estimated mean viewing profiles, μ(t) + ηd(t), d = 1,2, for the two diagnosis groups (ASD and TD).
Fig. 4:
Fig. 4:
(a),(d) The first two leading eigenfunctions, ϕk(d)(t), k = 1, 2, d = 1, 2, estimated from FPCA of the viewing profiles in the VE application. (b), (c) Group-specific mean estimates plus and minus two times the amount of variation along the leading eigenfunction, μ(t)+ηd(t)±2λ1(d)ϕ1(d)(t), d = 1, 2. (e), (f) Group-specific mean estimates plus and minus two times the amount of variation along the second leading eigenfunction, μ(t)+ηd(t)±2λ1(d)ϕ2(d)(t), d = 1, 2.
Fig. 5:
Fig. 5:
(a) Estimated first two leading eigenscores for the ASD group. Three ASD subjects with either the first or the second leading eigenscore outside 2 standard deviations from the mean are highlighted in green and red. (b) Estimated first two leading eigenscores for the TD group. (c) Viewing profiles of the three outlying ASD subjects. (Profiles for subjects highlighted by a red dot, circled dot and green dot are given in solid red, dashed red and solid green.)
Fig. 6:
Fig. 6:
(a) Estimated overall mean viewing profile, μ(t). (b) Estimated group-visit shifts from the overall mean, ηdj(t), d = 1, 2, j = 1, 2, 3. (c) Estimated mean viewing profiles, μ(t)+ηd·(t), d = 1, 2, for the two diagnosis groups (ASD and TD). (d) Estimated mean viewing profiles, μ(t)+η·j(t), j = 1, 2, 3, at the three visits (T1, T2 and T3) in the VE application.
Fig. 7:
Fig. 7:
(a), (d), (g), (h) The first two leading subject- and visit-level eigenfunctions, ϕk(t), k = 1, 2 (a, d), ψk(t), k = 1, 2 (g, h) estimated from MFPCA. (b), (c), (e), (f) Group-specific mean estimates plus and minus two times the amount of variation along the leading two subject-level eigenfunctions, μ(t)+ηd(t)±2λ1ϕ1(t) (b, c), and μ(t)+ηd(t)±2λ2ϕ2(t) (e, f). (h), (i), (k), (l) Group-specific mean estimates plus and minus two times the amount of variation along the leading two visit-level eigenfunctions, μ(t)+ηd±2ν1ψ1(t) (h, i), and μ(t)+ηd±2ν2ψ2(t) (k. l).
Fig. 8:
Fig. 8:
(a) Estimated first two leading subject-level eigenscores for the ASD group. Three ASD subjects with either the first or the second leading eigenscore outside 2 standard deviations from the mean, also identified in the baseline analysis, are highlighted in green and red. (b) Estimated first two leading subject-level eigenscores for the TD group. (c), (d) Estimated first two leading visit-level eigenscores for the ASD and TD groups, respectively.
Fig. 9:
Fig. 9:
(a) Significant negative correlations are detected between average consistency of the initial gaze being at the social object and the average logarithm of latency to social object in the entire data (r = −.758, p-value< .001) as well as the ASD (r = −.768, p-value< .001) and TD groups (r = −.678, p-value< .001) (b), (c) Significant negative correlations are also detected between the leading subject-level eigenscores (positive scores signaling higher consistency) in both ASD and TD groups (ASD: r = −.0.706, p-value < .001, TD: r = −.678, p-value < .001).

References

    1. van Renswoude DR, Raijmakers ME, Koornneef A, Johnson SP, Hunnius S, Visser I (2018) Gazepath: An eye-tracking analysis tool that accounts for individual differences and data quality. Behavior Research Methods 50(2):834–852. 10.3758/s13428-017-0909-3. - DOI - PMC - PubMed
    1. Shultz S, Klin A, Jones W (2018) Neonatal transitions in social behavior and their implications for autism. Trends in Cognitive Sciences. 22(5):452–469. 10.1016/j.tics.2018.02.012. - DOI - PMC - PubMed
    1. Nayar K, Shic F, Winston M, Losh M (2021) A Constellation of eye-Tracking measures reveals social attention differences in ASD and the broad autism phenotype. Under review. - PMC - PubMed
    1. McPartland JC, Bernier RA, Jeste SS, Dawson G, Nelson CA, Chawarska K, et al. (2020) The Autism Biomarkers Consortium for Clinical Trials (ABC-CT): Scientific context, study design, and progress toward biomarker qualification. Frontiers in Integrative Neuroscience. Apr 9;14:16. 10.1101/2019.12.18.19014548. - DOI - PMC - PubMed
    1. Allopenna PD, Magnuson JS, Tanenhaus MK (1998) Tracking the time course of spoken word recognition using eye movements: Evidence for continuous mapping models. Journal of Memory and Language 38(4):419–439. 10.1006/jmla.1997.2558. - DOI

LinkOut - more resources