

Tier-specific contextualised high-intensity running profiles in the English Premier League: more on-ball movement at the top
- PMID: 37077798
- PMCID: PMC10108770
- DOI: 10.5114/biolsport.2023.118020
Tier-specific contextualised high-intensity running profiles in the English Premier League: more on-ball movement at the top
Abstract
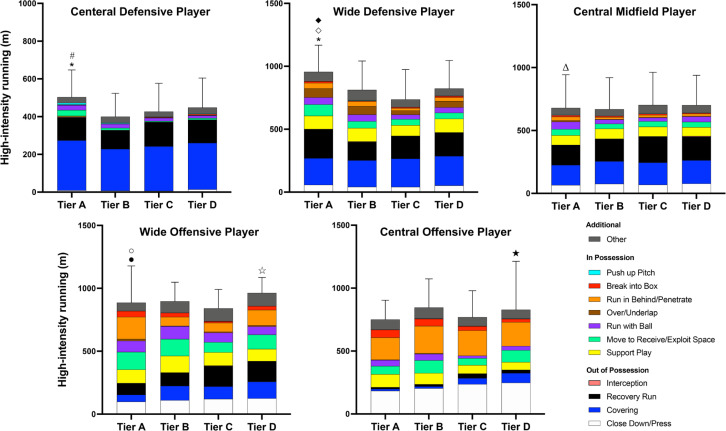
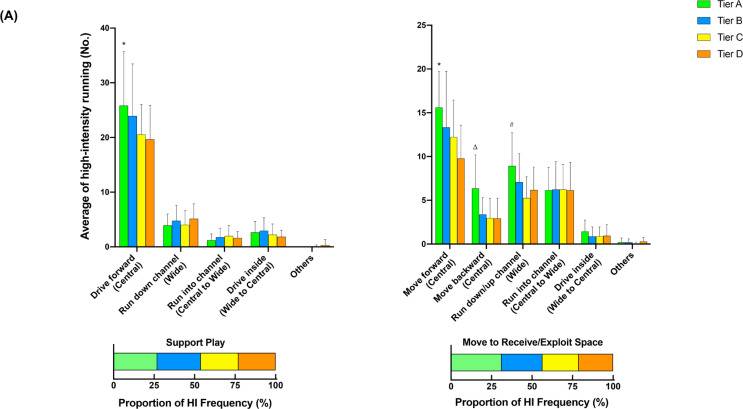
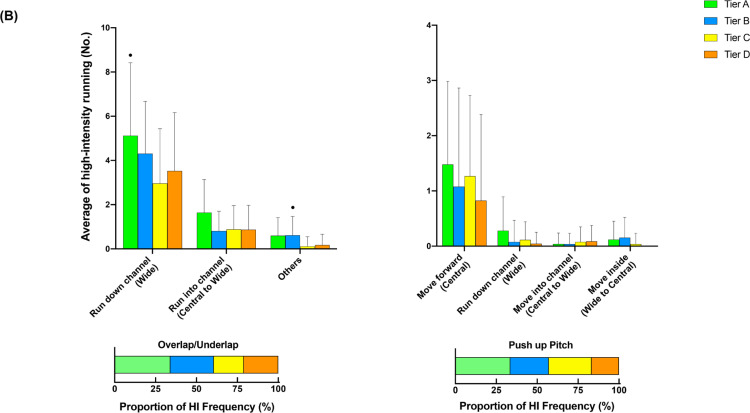
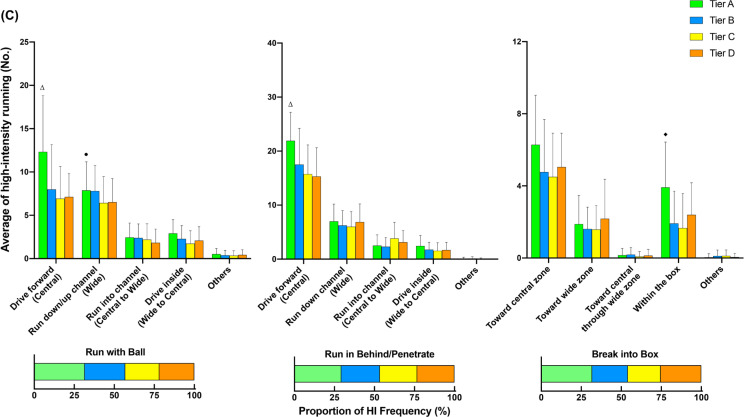
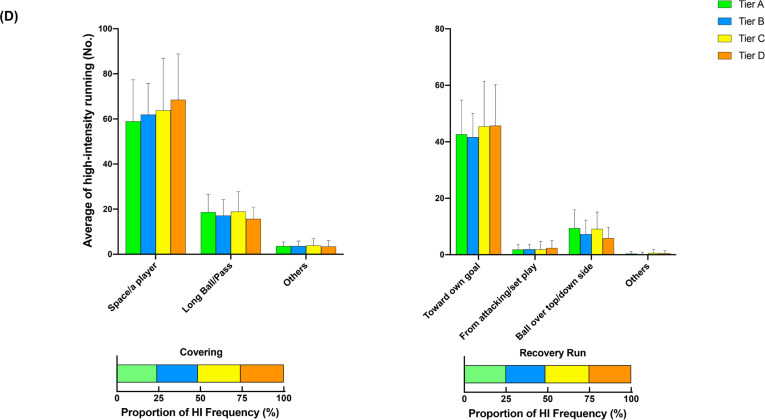
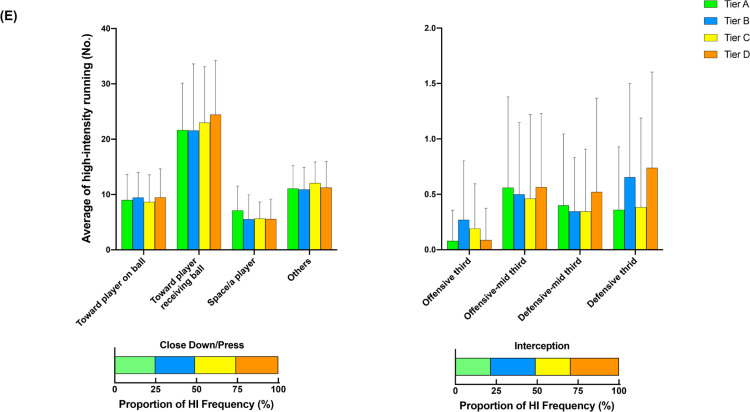
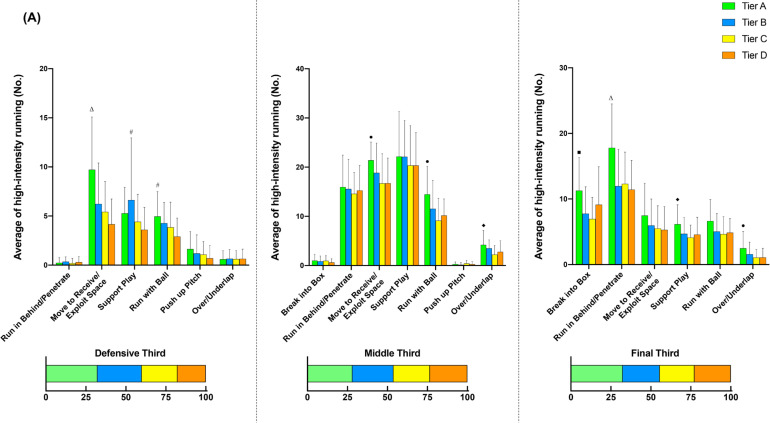
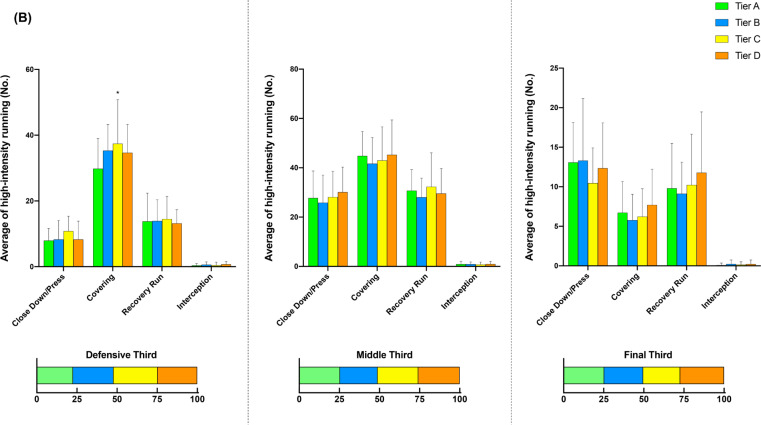
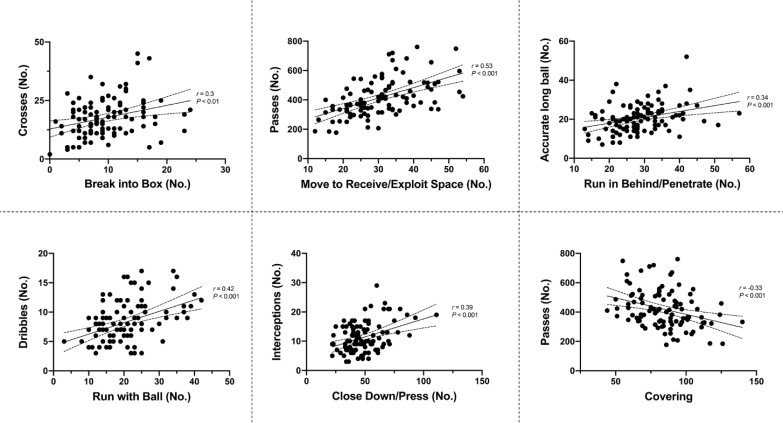
The present study aimed to determine the physical-tactical profiles of elite football teams and individual players according to final league rankings. A total of 50 English Premier League matches (n = 100 match and 583 player observations) were analysed by coding the player's physical-tactical actions through synchronising tracking data and video. Final league rankings were categorised into Tiers: (A) 1st-5th ranking (n = 25), (B) 6th-10th ranking (n = 26), (C) 11th-15th ranking (n = 26), and (D) 16th-20th ranking (n = 23). One-way analyses of variance were used to compare match performances between different Tiers, and effect size (ES) was determined for the meaningfulness of the difference. Tier A teams covered 39-51% more high-intensity distance for 'Move to Receive/Exploit Space' (ES: 1.3-1.6, P < 0.01) and 'Run with Ball' (ES: 0.9-1.0, P < 0.05) than Tier C and D, and 23-94% more distance for 'Over/Underlap' (ES: 1.0, P < 0.01), 'Run in Behind/Penetrate' (ES: 0.7, P < 0.05), and 'Break into Box' (ES: 0.9, P < 0.05) compared to Tier C. Central and Wide Defensive Players in Tier A covered 65-551% more high-intensity 'Move to Receive/Exploit Space' distance compared to other Tiers (ES: 0.6-1.0, P < 0.01). Moreover, the additional options within the physical-tactical actions and zonal differences unveiled more meaningful insights into 'HOW' the top Tier teams physically and tactically perform. Thus, the amalgamated physical-tactical data help improve our understanding of a team's playing style relative to their competitive standard.
Keywords: Football; Match performance; Physical-tactical data; Ranking; Standard.
Copyright © Biology of Sport 2023.
Conflict of interest statement
The authors declare no conflict of interest.
Figures
Similar articles
-
Contextualised high-intensity running profiles of elite football players with reference to general and specialised tactical roles.Biol Sport. 2023 Jan;40(1):291-301. doi: 10.5114/biolsport.2023.116003. Epub 2022 May 10. Biol Sport. 2023. PMID: 36636193 Free PMC article.
-
Tier-specific evolution of match performance characteristics in the English Premier League: it's getting tougher at the top.J Sports Sci. 2016;34(10):980-7. doi: 10.1080/02640414.2015.1082614. Epub 2015 Sep 11. J Sports Sci. 2016. PMID: 26359805
-
Contextualised peak periods of play in English Premier League matches.Biol Sport. 2022 Oct;39(4):973-983. doi: 10.5114/biolsport.2022.112083. Epub 2021 Dec 30. Biol Sport. 2022. PMID: 36247964 Free PMC article.
-
Assessment of Physical, Technical, and Tactical Analysis in the Australian Football League: A Systematic Review.Sports Med Open. 2022 Oct 8;8(1):124. doi: 10.1186/s40798-022-00518-8. Sports Med Open. 2022. PMID: 36209264 Free PMC article.
-
Reference values for collective tactical behaviours based on positional data in professional football matches: a systematic review.Biol Sport. 2022 Jan;39(1):110-114. doi: 10.5114/biolsport.2021.102921. Epub 2021 Mar 6. Biol Sport. 2022. PMID: 35173369 Free PMC article. Review.
Cited by
-
'Setting the Benchmark' Part 4: Contextualising the Match Demands of Teams at the FIFA Women's World Cup Australia and New Zealand 2023.Biol Sport. 2025 Apr;42(2):57-69. doi: 10.5114/biolsport.2025.142638. Epub 2024 Aug 30. Biol Sport. 2025. PMID: 40182706 Free PMC article.
-
Are fluctuations in physical performance affected by contextual factors in women's handball matches? An analysis using five-minute fixed phases.Biol Sport. 2025 Jan;42(1):113-121. doi: 10.5114/biolsport.2025.139086. Epub 2024 Jun 4. Biol Sport. 2025. PMID: 39758178 Free PMC article.
-
Match running performance is similar in lower and higher competitive standards of Spanish professional soccer accounting for effective playing time.Biol Sport. 2024 Jul;41(3):39-46. doi: 10.5114/biolsport.2024.132993. Epub 2023 Dec 20. Biol Sport. 2024. PMID: 38952918 Free PMC article.
-
Contextualized high-speed running and sprinting during English Premier League match-play with reference to possession, positional demands and opponent ranking.Biol Sport. 2025 Jan 24;42(3):119-127. doi: 10.5114/biolsport.2025.147011. eCollection 2025 Jul. Biol Sport. 2025. PMID: 40657003 Free PMC article.
-
Exploring the impact of professional soccer substitute players on physical and technical performance.BMC Sports Sci Med Rehabil. 2023 Oct 28;15(1):143. doi: 10.1186/s13102-023-00752-x. BMC Sports Sci Med Rehabil. 2023. PMID: 37898786 Free PMC article.
References
-
- Carling C, Bloomfield J, Nelsen L, Reilly T. The role of motion analysis in elite soccer. Sports Med. 2008; 38(10):839–862. - PubMed
-
- Castellano J, Blanco-Villasenor A, Alvarez D. Contextual variables and time-motion analysis in soccer. Int J Sports Med. 2011; 32(6):415–421. - PubMed
-
- Mohr M, Krustrup P, Bangsbo J. Match performance of high-standard soccer players with special reference to development of fatigue. J Sports Sci. 2003; 21(7):519–528. - PubMed
-
- Rampinini E, Coutts AJ, Castagna C, Sassi R, Impellizzeri FM. Variation in top level soccer match performance. Int J Sports Med. 2007; 28(12):1018–1024. - PubMed
-
- Bradley PS, Carling C, Archer D, Roberts J, Dodds A, Di Mascio M, et al. . The effect of playing formation on high-intensity running and technical profiles in English FA Premier League soccer matches. J Sports Sci. 2011; 29(8):821–830. - PubMed
LinkOut - more resources
Full Text Sources