Integrative bioinformatics approaches to establish potential prognostic immune-related genes signature and drugs in the non-small cell lung cancer microenvironment
- PMID: 37077811
- PMCID: PMC10106634
- DOI: 10.3389/fphar.2023.1153565
Integrative bioinformatics approaches to establish potential prognostic immune-related genes signature and drugs in the non-small cell lung cancer microenvironment
Abstract
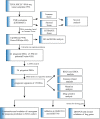
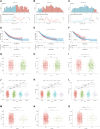
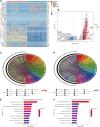
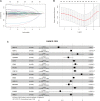
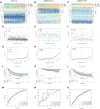
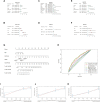
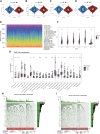
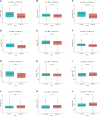
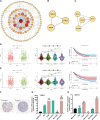
Introduction: Research has revealed that the tumor microenvironment (TME) is associated with the progression of malignancy. The combination of meaningful prognostic biomarkers related to the TME is expected to be a reliable direction for improving the diagnosis and treatment of non-small cell lung cancer (NSCLC). Method and Result: Therefore, to better understand the connection between the TME and survival outcomes of NSCLC, we used the "DESeq2" R package to mine the differentially expressed genes (DEGs) of two groups of NSCLC samples according to the optimal cutoff value of the immune score through the ESTIMATE algorithm. A total of 978 up-DEGs and 828 down-DEGs were eventually identified. A fifteen-gene prognostic signature was established via LASSO and Cox regression analysis and further divided the patients into two risk sets. The survival outcome of high-risk patients was significantly worse than that of low-risk patients in both the TCGA and two external validation sets (p-value < 0.05). The gene signature showed high predictive accuracy in TCGA (1-year area under the time-dependent ROC curve (AUC) = 0.722, 2-year AUC = 0.708, 3-year AUC = 0.686). The nomogram comprised of the risk score and related clinicopathological information was constructed, and calibration plots and ROC curves were applied, KEGG and GSEA analyses showed that the epithelial-mesenchymal transition (EMT) pathway, E2F target pathway and immune-associated pathway were mainly involved in the high-risk group. Further somatic mutation and immune analyses were conducted to compare the differences between the two groups. Drug sensitivity provides a potential treatment basis for clinical treatment. Finally, EREG and ADH1C were selected as the key prognostic genes of the two overlapping results from PPI and multiple Cox analyses. They were verified by comparing the mRNA expression in cell lines and protein expression in the HPA database, and clinical validation further confirmed the effectiveness of key genes. Conclusion: In conclusion, we obtained an immune-related fifteen-gene prognostic signature and potential mechanism and sensitive drugs underling the prognosis model, which may provide accurate prognosis prediction and available strategies for NSCLC.
Keywords: drug sensitivity; estimate; non-small cell lung cancer; prognostic gene signature; tumor microenvironment.
Copyright © 2023 Zhou, Shi, Qiu, Jin, Yu, Xie and Zhang.
Conflict of interest statement
The authors declare that the research was conducted in the absence of any commercial or financial relationships that could be construed as a potential conflict of interest.
Figures

Similar articles
-
Identification of prognostic gene signature associated with microenvironment of lung adenocarcinoma.PeerJ. 2019 Nov 29;7:e8128. doi: 10.7717/peerj.8128. eCollection 2019. PeerJ. 2019. PMID: 31803536 Free PMC article.
-
Identification of cuproptosis-related subtypes, construction of a prognosis model, and tumor microenvironment landscape in gastric cancer.Front Immunol. 2022 Nov 21;13:1056932. doi: 10.3389/fimmu.2022.1056932. eCollection 2022. Front Immunol. 2022. PMID: 36479114 Free PMC article.
-
An Intratumor Heterogeneity-Related Signature for Predicting Prognosis, Immune Landscape, and Chemotherapy Response in Colon Adenocarcinoma.Front Med (Lausanne). 2022 Jul 7;9:925661. doi: 10.3389/fmed.2022.925661. eCollection 2022. Front Med (Lausanne). 2022. PMID: 35872794 Free PMC article.
-
A Novel Hypoxia-Related Gene Signature with Strong Predicting Ability in Non-Small-Cell Lung Cancer Identified by Comprehensive Profiling.Int J Genomics. 2022 May 19;2022:8594658. doi: 10.1155/2022/8594658. eCollection 2022. Int J Genomics. 2022. PMID: 35634481 Free PMC article.
-
Tumor microenvironment related novel signature predict lung adenocarcinoma survival.PeerJ. 2021 Jan 14;9:e10628. doi: 10.7717/peerj.10628. eCollection 2021. PeerJ. 2021. PMID: 33520448 Free PMC article.
References
-
- Arriagada R., Dunant A., Pignon J. P., Bergman B., Chabowski M., Grunenwald D., et al. (2010). Long-term results of the international adjuvant lung cancer trial evaluating adjuvant Cisplatin-based chemotherapy in resected lung cancer. J. Clin. Oncol. 28 (1), 35–42. 10.1200/JCO.2009.23.2272 - DOI - PubMed
-
- Benzon Larsen S., Vogel U., Christensen J., Hansen R. D., Wallin H., Overvad K., et al. (2010). Interaction between ADH1C Arg(272)Gln and alcohol intake in relation to breast cancer risk suggests that ethanol is the causal factor in alcohol related breast cancer. Cancer Lett. 295 (2), 191–197. 10.1016/j.canlet.2010.02.023 - DOI - PubMed
LinkOut - more resources
Full Text Sources

