

Identification of a prognostic biomarker predicting biochemical recurrence and construction of a novel nomogram for prostate cancer
- PMID: 37077837
- PMCID: PMC10106702
- DOI: 10.3389/fonc.2023.1115718
Identification of a prognostic biomarker predicting biochemical recurrence and construction of a novel nomogram for prostate cancer
Abstract
Background: Biochemical recurrence (BCR) is common in prostate cancer (PCa), but its prediction is based predominantly on clinicopathological characteristics with low accuracy. We intend to identify a potential prognostic biomarker related to the BCR and construct a nomogram for improving the risk stratification of PCa patients.
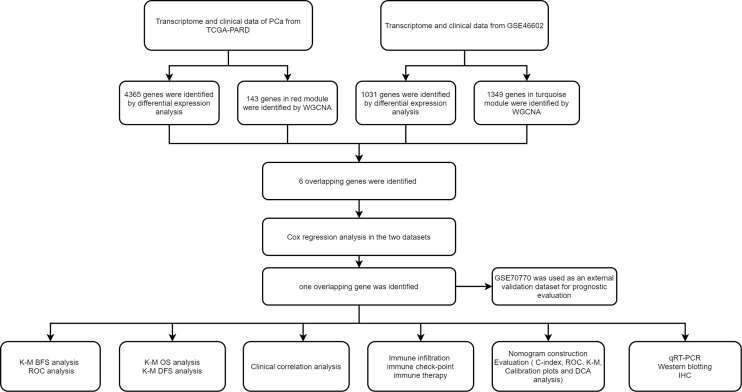
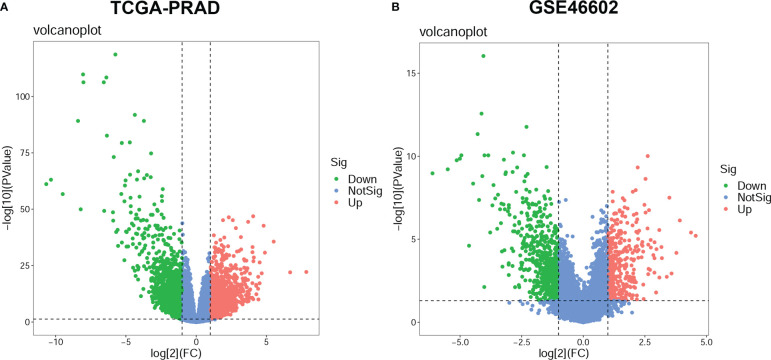
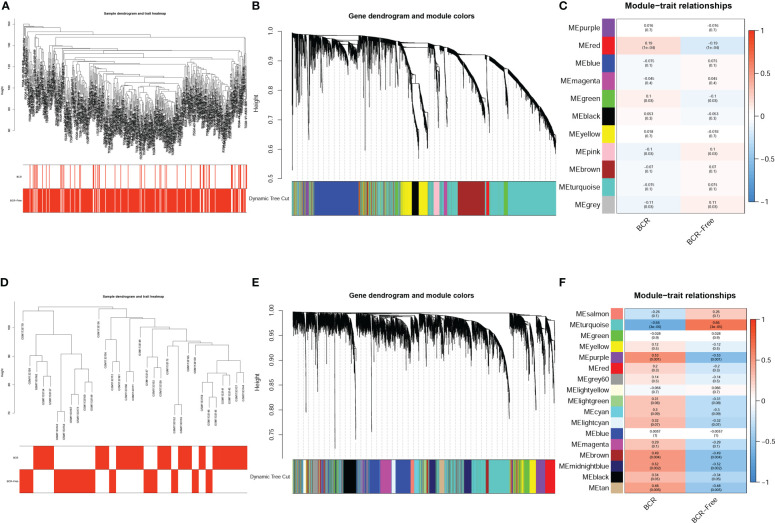
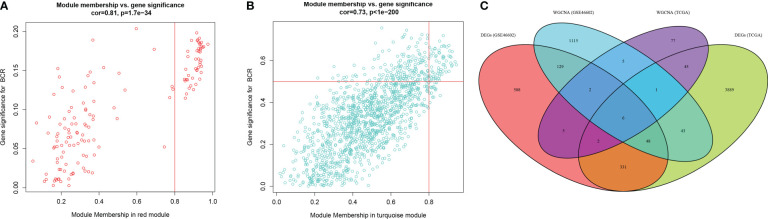
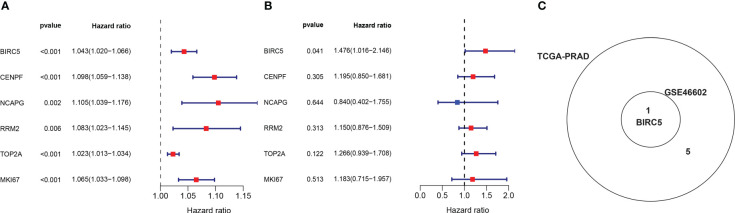
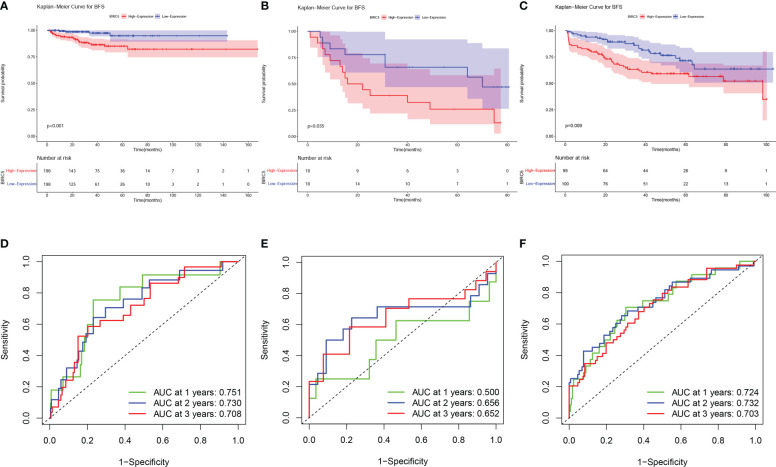
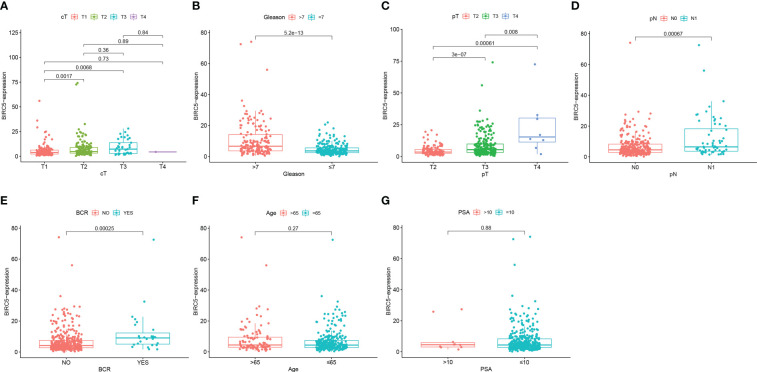
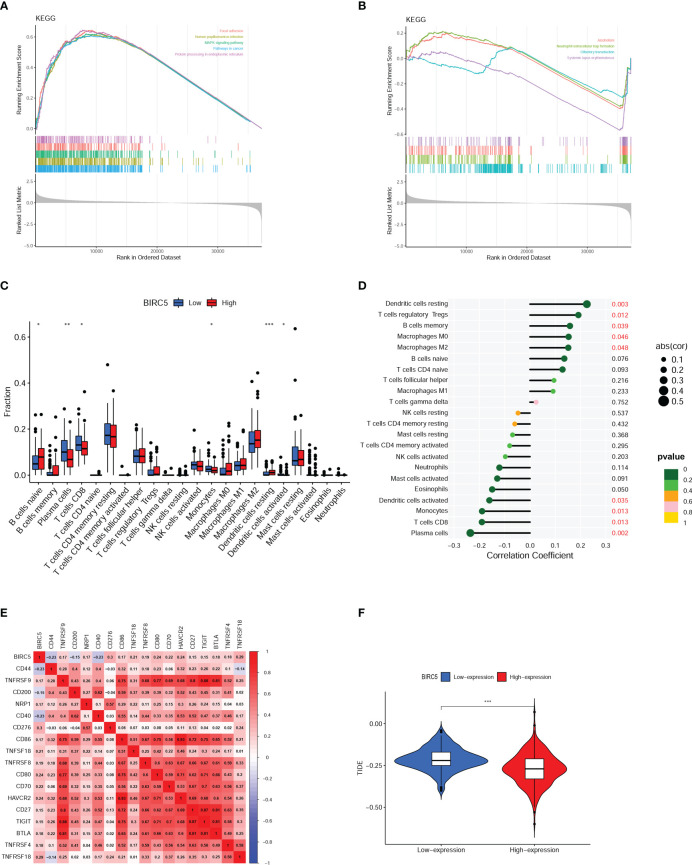
Methods: The transcriptome and clinical data of PCa patients were obtained from TCGA and GEO databases. Differential expression analysis and weighted gene co-expression network analysis (WGCNA) were used to screen out differentially expressed genes (DEGs) related to the BCR of PCa. Cox regression analysis was further applied to screen out DEGs related to BCR-free survival (BFS). Time-dependent receiver operating curve (ROC) analysis and Kaplan-Meier (K-M) survival analysis were conducted to assess the prognostic value. Then, a prognostic nomogram was established and evaluated. The clinicopathological correlation analysis, GSEA analysis, and immune analysis were used to explore the biological and clinical significance of the biomarker. Finally, the qRT-PCR, western blotting, and immunohistochemistry (IHC) were conducted to validate the expression of the biomarker.
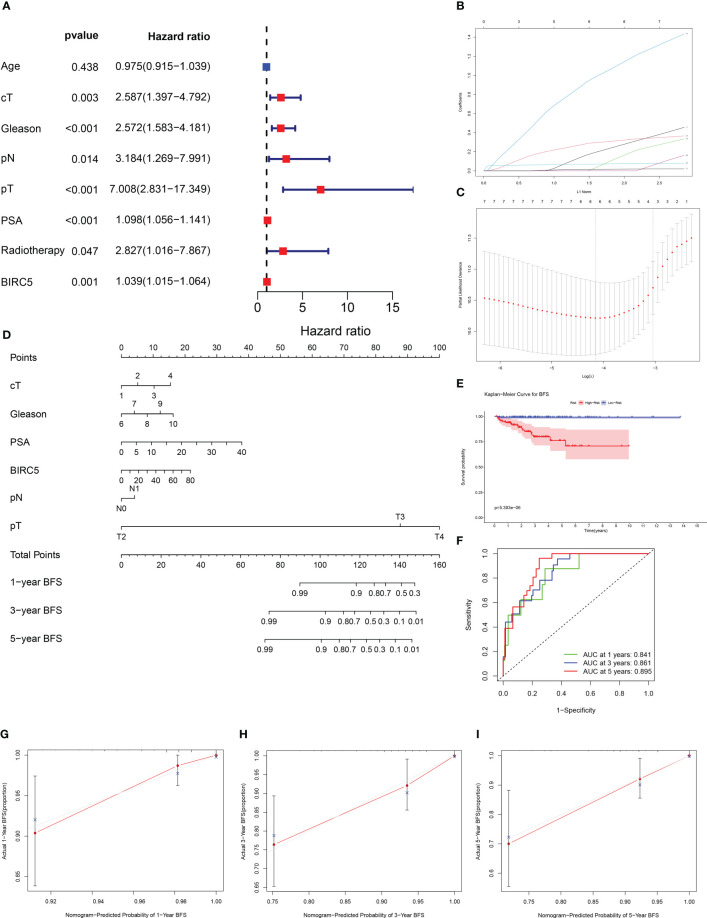
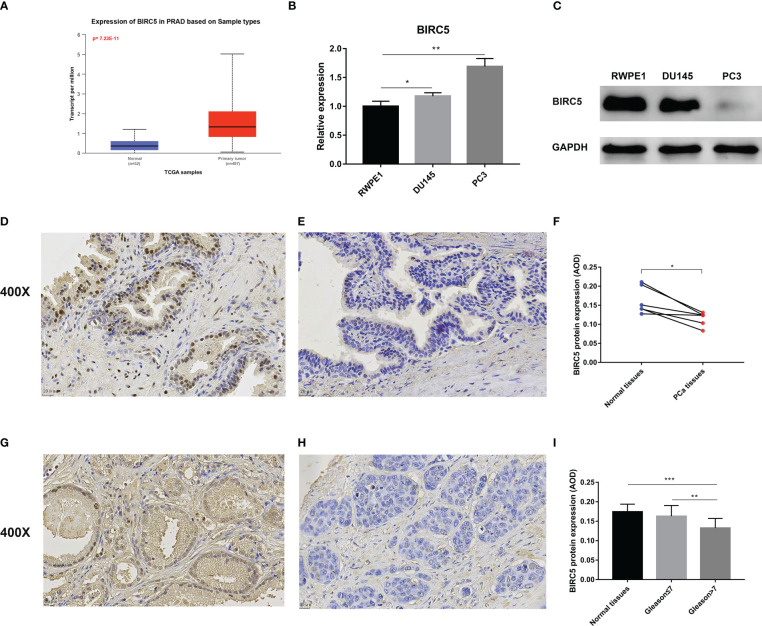
Results: BIRC5 was identified to be the potential prognostic biomarker. The clinical correlation analysis and K-M survival analysis found that the BIRC5 mRNA expression was positively associated with disease progression and negatively associated with the BFS rate. Time-dependent ROC curves verified its accurate prediction performance. The GSEA and immune analysis suggested that the BIRC5 was related to immunity. A nomogram with an accurate prediction for BFS of PCa patients was constructed. qRT-PCR, western blotting, and IHC results validated the expression level of BIRC5 in PCa cells and tissues.
Conclusion: Our study identified BIRC5 as a potential prognostic biomarker related to BCR of PCa and constructed an efficacy nomogram for predicting BFS to assist clinical decision-making.
Keywords: biochemical recurrence; biomarker; nomogram; prognosis; prostate cancer.
Copyright © 2023 Yu, Chao, Xu, Deng, Deng, Song and Zeng.
Conflict of interest statement
The authors declare that the research was conducted in the absence of any commercial or financial relationships that could be construed as a potential conflict of interest.
Figures
Similar articles
-
A Novel Set of Immune-associated Gene Signature predicts Biochemical Recurrence in Localized Prostate Cancer Patients after Radical Prostatectomy.J Cancer. 2021 May 1;12(12):3715-3725. doi: 10.7150/jca.51059. eCollection 2021. J Cancer. 2021. PMID: 33995646 Free PMC article.
-
A Novel Four Mitochondrial Respiration-Related Signature for Predicting Biochemical Recurrence of Prostate Cancer.J Clin Med. 2023 Jan 13;12(2):654. doi: 10.3390/jcm12020654. J Clin Med. 2023. PMID: 36675580 Free PMC article.
-
Construction of a novel mRNA-signature prediction model for prognosis of bladder cancer based on a statistical analysis.BMC Cancer. 2021 Jul 27;21(1):858. doi: 10.1186/s12885-021-08611-z. BMC Cancer. 2021. PMID: 34315402 Free PMC article.
-
Predicting biochemical-recurrence-free survival using a three-metabolic-gene risk score model in prostate cancer patients.BMC Cancer. 2022 Mar 4;22(1):239. doi: 10.1186/s12885-022-09331-8. BMC Cancer. 2022. PMID: 35246070 Free PMC article.
-
Identification and Validation of a Prognostic 5-Protein Signature for Biochemical Recurrence Following Radical Prostatectomy for Prostate Cancer.Front Surg. 2021 May 31;8:665115. doi: 10.3389/fsurg.2021.665115. eCollection 2021. Front Surg. 2021. PMID: 34136527 Free PMC article.
Cited by
-
Transcriptomic signatures of prostate cancer progression: a comprehensive RNA-seq study.3 Biotech. 2025 May;15(5):135. doi: 10.1007/s13205-025-04297-3. Epub 2025 Apr 19. 3 Biotech. 2025. PMID: 40260408
-
TWIK Complex Expression in Prostate Cancer: Insights into the Biological and Therapeutic Significances of Potassium Ion Channels in Clinical Cancer.Biology (Basel). 2025 May 19;14(5):569. doi: 10.3390/biology14050569. Biology (Basel). 2025. PMID: 40427758 Free PMC article.
-
Imaging assessment of prostate cancer recurrence: advances in detection of local and systemic relapse.Abdom Radiol (NY). 2025 Feb;50(2):807-826. doi: 10.1007/s00261-024-04412-7. Epub 2024 Sep 10. Abdom Radiol (NY). 2025. PMID: 39254707 Review.
-
Crucial role of hsa-mir-503, hsa-mir-1247, and their validation in prostate cancer.Aging (Albany NY). 2023 Nov 16;15(22):12966-12981. doi: 10.18632/aging.205213. Epub 2023 Nov 16. Aging (Albany NY). 2023. PMID: 37980162 Free PMC article.
-
Exploring BIRC family genes as prognostic biomarkers and therapeutic targets in prostate cancer.Discov Oncol. 2025 Feb 26;16(1):240. doi: 10.1007/s12672-025-02002-7. Discov Oncol. 2025. PMID: 40009266 Free PMC article.
References
LinkOut - more resources
Full Text Sources