. 2023 Apr 3:14:1106652.
doi: 10.3389/fimmu.2023.1106652. eCollection 2023.

Distinct subpopulations of DN1 thymocytes exhibit preferential γδ T lineage potential

Affiliations

Distinct subpopulations of DN1 thymocytes exhibit preferential γδ T lineage potential

Seungyoul Oh et al. Front Immunol. .

Abstract

The αβ and γδ T cell lineages both differentiate in the thymus from common uncommitted progenitors. The earliest stage of T cell development is known as CD4-CD8- double negative 1 (DN1), which has previously been shown to be a heterogenous mixture of cells. Of these, only the CD117+ fraction has been proposed to be true T cell progenitors that progress to the DN2 and DN3 thymocyte stages, at which point the development of the αβ and γδ T cell lineages diverge. However, recently, it has been shown that at least some γδ T cells may be derived from a subset of CD117- DN thymocytes. Along with other ambiguities, this suggests that T cell development may not be as straightforward as previously thought. To better understand early T cell development, particularly the heterogeneity of DN1 thymocytes, we performed a single cell RNA sequence (scRNAseq) of mouse DN and γδ thymocytes and show that the various DN stages indeed comprise a transcriptionally diverse subpopulations of cells. We also show that multiple subpopulations of DN1 thymocytes exhibit preferential development towards the γδ lineage. Furthermore, specific γδ-primed DN1 subpopulations preferentially develop into IL-17 or IFNγ-producing γδ T cells. We show that DN1 subpopulations that only give rise to IL-17-producing γδ T cells already express many of the transcription factors associated with type 17 immune cell responses, while the DN1 subpopulations that can give rise to IFNγ-producing γδ T cell already express transcription factors associated with type 1 immune cell responses.

Keywords: T cell development; gamma delta (γδ) T cells; lineage decision; scRNAseq; thymocyte.


Conflict of interest statement

The authors declare that the research was conducted in the absence of any commercial or financial relationships that could be construed as a potential conflict of interest.

Figures
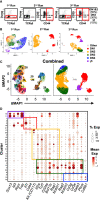
Figure 1
Figure 1
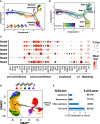
Single-cell RNA sequencing analysis of early T cell development. (A) Shown are the gating strategies used to sort DN and γδ thymocytes from C57BL/6 mice for 10x scRNAseq. Three separate runs were completed: 1st = total DN and TCRγδ+ cells; 2nd = Only DN1 and DN2 cells; 3rd = DN1 plus DN2, DN3 and TCRγδ+ cells were sorted separately, and then mixed back together post-sort at a ratio of 55% to 30% to 15% respectively. Dump = CD4, CD8, B220, CD11b, CD11c, NK1.1 and TCRβ. (B) Following processing of the 10x data on CellRanger, each dataset was analyzed for clustering based on the first 12 principal components in Seurat. Shown is the UMAP visualization of each run color-coded to DN developmental stage, TCRγδ+ thymocytes or other (non-thymocytes). (C) The three datasets, totaling 22,094 cells, were integrated with SCTransform, then clustered with Seurat. A minimal resolution of 2.0 was selected such that no cluster contained a mixture of pre- and post-T lineage commitment cells (DN2a versus DN2b) or pre- and post-β-selection cells (DN3a versus DN3b). The resulting clusters (left plot) were then annotated to DN developmental stage, TCRγδ+ thymocytes or other (non-thymocytes) (right plot). (D) Dot plots showing expression of selected markers used to assign individual clusters to DN development stage. The markers are grouped (colored boxes) based on contribution to assigning to each of the 5 broad populations.
Figure 2
Figure 2
Trajectory analysis suggests that at least some γδ thymocytes develop directly from DN1 thymocytes. (A) Pseudotime analysis of total DN and γδ thymocytes (first 10x run) with Monocle 2. The cells are color-coded by thymocyte development stage (DN1 to 4 or γδ) based on expression of key marker genes (described in Supplementary Figure 2 ) by the individual clusters. (B) Six distinct states were identified within this asymmetric trajectory. (C) Dot plots for expression of key genes across the six states. Markers genes are grouped based on usage to assign to the indicated stages in early T cell development. (D) The three 10x datasets were integrated then subjected to Slingshot analysis, with the farthest grouping of DN1 thymocytes assigned as the starting point. (E) Differential gene expression (DE) analysis was performed on States 4, 5 and 6 (combined) compared to State 3. The DE genes were then analyzed for KEGG term enrichment. Shown are four of the terms with significant enrichment. The number of DE genes for each term is also indicated.
Figure 3
Figure 3
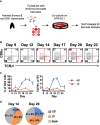
Cellular barcoding of DN1 thymocytes suggests that individual cells more frequently give rise to a single lineage than to both αβ and γδ cells in OP9-DL1 cocultures. (A) Overview of the experimental setup to track lineage outcomes of DN1 thymocytes. Total DN1 (CD25-CD44+CD4-CD8-B220-CD11b-CD11c-NK1.1-TCRβ-TCRγδ-) thymocytes were sorted from the thymus of C57BL/6 mice and tagged with unique genetic barcodes encoded in a lentiviral library. The cells were then differentiated on OP9-DL1 monolayers. (B) Shown is a representative of the αβ versus γδ lineage profiles over a time course in these OP9-DL1 cocultures. αβ lineage cells were identified as CD8α+, which captures cells from late DN4 onwards, while γδ lineage cells were identified as TCRγδ+. CD4 expression was also analyzed and was largely concomitant with CD8α expression as most αβ cells were DP (not shown). For the cellular barcoding analysis, αβ (CD90.2+CD8+CD4+/-TCRγδ-) and γδ (CD90.2+TCRγδ+) lineage cells were sorted at Day 14 from half the culture. The remaining half was further differentiated out to Day 20 and then sorted. (C) Shown are the percentages and absolute cell numbers (mean ± S.E.M.) of 4–7 replicates over the time course starting from 103 total DN1 thymocytes. (D) The barcode composition of the αβ and γδ populations at Day 14 and 20 were analyzed by Illumina sequencing. Shown is the fraction of unique barcode sequences that were found only in the resulting αβ cells, γδ cells or in both populations for that time point. The values indicate the mean ± S.E.M. of two independent sort/transduction experiments.
Figure 4
Figure 4
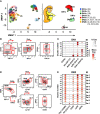
Identification of cell surface markers for delineating the DN1 and DN2 subpopulations inferred from scRNAseq. (A) UMAP visualization of 8,851 DN1 and DN2 thymocytes from the second 10x run clustered with Seurat. A minimal resolution of 2.0 was selected such that no cluster contained a mixture of pre- and post-T lineage commitment cells (DN2a versus DN2b). This yielded 26 clusters (left plot), which were then annotated as DN1a, DN1b, DN1c, DN1d, DN1e, DN2a, or DN2b (right plot). (B) The DN1 subpopulations were analyzed for differentially expressed genes encoding cell surface proteins. Antibodies against these proteins were then tested. Shown is the flow cytometric strategy to subdivide the eight DN1 subpopulations using a panel of five antibodies. Total DN1 cells were identified as CD25-CD44+CD4-CD8-B220-CD11b-CD11c-NK1.1-TCRβ-TCRγδ-. (C) Dot plots showing the expression of the genes encoding cell surface markers used to delineate the DN1 subpopulations. (D) The flow cytometric strategy to subdivide four populations of DN2a cells and seven populations of DN2b cells using a panel of five antibodies. Total DN2 cells were identified as CD25+CD44+CD4-CD8-B220-CD11b-CD11c-NK1.1-TCRβ-TCRγδ-. (E) Dot plots showing the expression of the genes encoding the cell surface markers use to delineate the DN2 subpopulations.
Figure 5
Figure 5
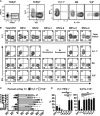
Assessing the αβ or γδ potential of DN1 subpopulations. (A) Sorted DN1 subpopulations were cultured on OP9-DL1 monolayers to assess their lineage potential. The cultures were analyzed at 14 and 20 days of culture by flow cytometry. αβ lineage cells were identified as CD8+ (capturing late DN4 and DP cells) while γδ lineage cells were identified as TCRγδ+. Representative flow cytometric plots are shown. (B, C) Pooled data analyzing αβ versus γδ differentiation from sorted DN1 subpopulations. The means ± S.E.M. of four to nine replicates performed over four 4 independent experiments are shown. See Supplementary Tables 2, 3 for p-value calculations. (D, E) Pooled data analyzing αβ versus γδ differentiation from sorted DN2 subpopulations. The means ± S.E.M. of four to nine replicates performed over four independent experiments are shown. See Supplementary Tables 4, 5 for p-value calculations. (F) Overview of the experimental setup to repopulate dGuo-depleted FTOCs with sorted thymocytes. (G) The indicated DN1 subpopulations were sorted from the thymus of adult mice and introduced into dGuo-depleted E14.5 fetal thymic lobes. The reconstituted lobes were cultured for 14 days before analysis by flow cytometry for CD8 versus TCRγδ expression. Shown is a representative from three independent experiments.
Figure 6
Figure 6
The gene expression profiles of the different DN1 subpopulations correlate with distinct γδ effector subsets. (A) Heatmap showing genes differentially expressed (p-value <0.05 and twofold difference) between the two γδ thymocyte subpopulations (clusters 11 and 19) identified in the scRNAseq analysis of DN and γδ thymocytes in Figure 1C . Each column is an individual cell in the dataset while each row is a differentially expressed gene. Genes associated with either type 17 immune responses (IL-17A-production) or type 1 immune responses (IFNγ production) are indicated. (B) Analysis of DN1 subpopulations for expression of the 210 genes differentially expressed between the two γδ thymocyte populations. The genes are grouped based on higher expression in the cluster 11 or 19 γδ thymocytes. Indicated are some of the transcription factors and cell surface receptors that are associated with either type 1 or 17 immune responses.
Figure 7
Figure 7
Analysis of γδ effector outcomes from DN1 subpopulations. (A) Gating strategy for analyzing the phenotype of γδ T cells generated from DN1 subpopulations after culturing on OP9-DL1 monolayers for 14 days. TCRγδ+ (CD4-CD8-TCRβ-) cells were first divided based on Vγ1.1 versus Vγ2 expression. The three subpopulations, including Vγ1.1-Vγ2- double negative (DN) cells were then analyzed for intracellular IL-17A and IFNγ expression. (B) Shown are the flow cytometric plots from a representative experiment. The top row shows the Vγ1.1 versus Vγ2 expression on gated TCRγδ+ cells. The Vγ1.1+, Vγ2+ and double negative (DN) cells were then analyzed for IL-17A versus IFNγ expression in the bottom three rows. (C) Pooled data analyzing the percentage of Vγ1.1 versus Vγ2 cells differentiated from sorted DN1 subpopulations. The means ± S.E.M of four to six replicates performed over three independent experiments is shown. See Supplementary Table 6 for p-value calculations. (D) Pooled data analyzing percentage of Vγ1.1+IFNγ+ (left) and Vγ2+IL-17A+ (right) cells out of total TCRγδ+ cells. The means ± S.E.M is shown (*p < 0.05, **p < 0.01).
Figure 8
Figure 8
Graphical summary of the heterogeneity of DN1 thymocytes.

Similar articles

Cited by

References

    1. Ciofani M, Zuniga-Pflucker JC. Determining gammadelta versus alphass T cell development. Nat Rev Immunol (2010) 10(9):657–63. doi: 10.1038/nri2820 - DOI - PubMed
    1. Taghon T, Yui MA, Pant R, Diamond RA, Rothenberg EV. Developmental and molecular characterization of emerging β- and γδ-selected pre-T cells in the adult mouse thymus. Immunity (2006) 24(1):53–64. doi: 10.1016/j.immuni.2005.11.012 - DOI - PubMed
    1. Porritt HE, Rumfelt LL, Tabrizifard S, Schmitt TM, Zuniga-Pflucker JC, Petrie HT. Heterogeneity among DN1 prothymocytes reveals multiple progenitors with different capacities to generate T cell and non-T cell lineages. Immunity (2004) 20(6):735–45. doi: 10.1016/j.immuni.2004.05.004 - DOI - PubMed
    1. Matsuzaki Y, Gyotoku J, Ogawa M, Nishikawa S, Katsura Y, Gachelin G, et al. . Characterization of c-kit positive intrathymic stem cells that are restricted to lymphoid differentiation. J Exp Med (1993) 178(4):1283–92. doi: 10.1084/jem.178.4.1283 - DOI - PMC - PubMed
    1. Benz C, Martins VC, Radtke F, Bleul CC. The stream of precursors that colonizes the thymus proceeds selectively through the early T lineage precursor stage of T cell development. J Exp Med (2008) 205(5):1187–99. doi: 10.1084/jem.20072168 - DOI - PMC - PubMed

Publication types