

Dynamic apico-basal enrichment of the F-actin during cytokinesis in Arabidopsis cells embedded in their tissues
- PMID: 37077960
- PMCID: PMC10095810
- DOI: 10.1017/qpb.2022.1
Dynamic apico-basal enrichment of the F-actin during cytokinesis in Arabidopsis cells embedded in their tissues
Abstract
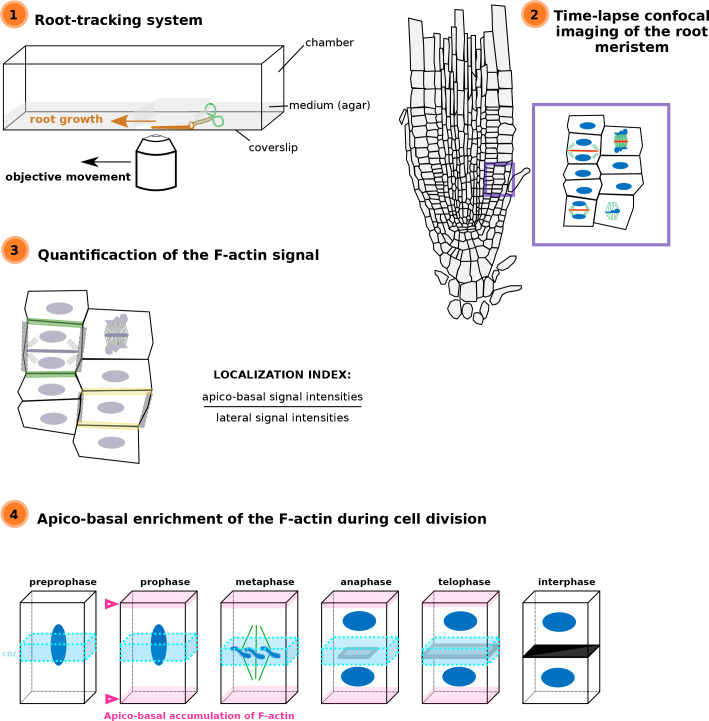
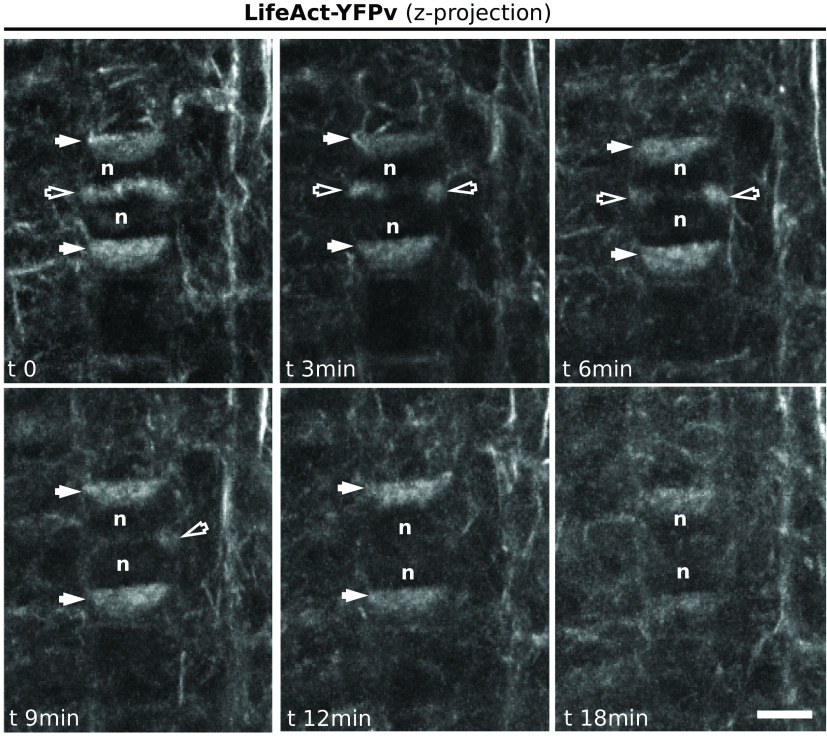
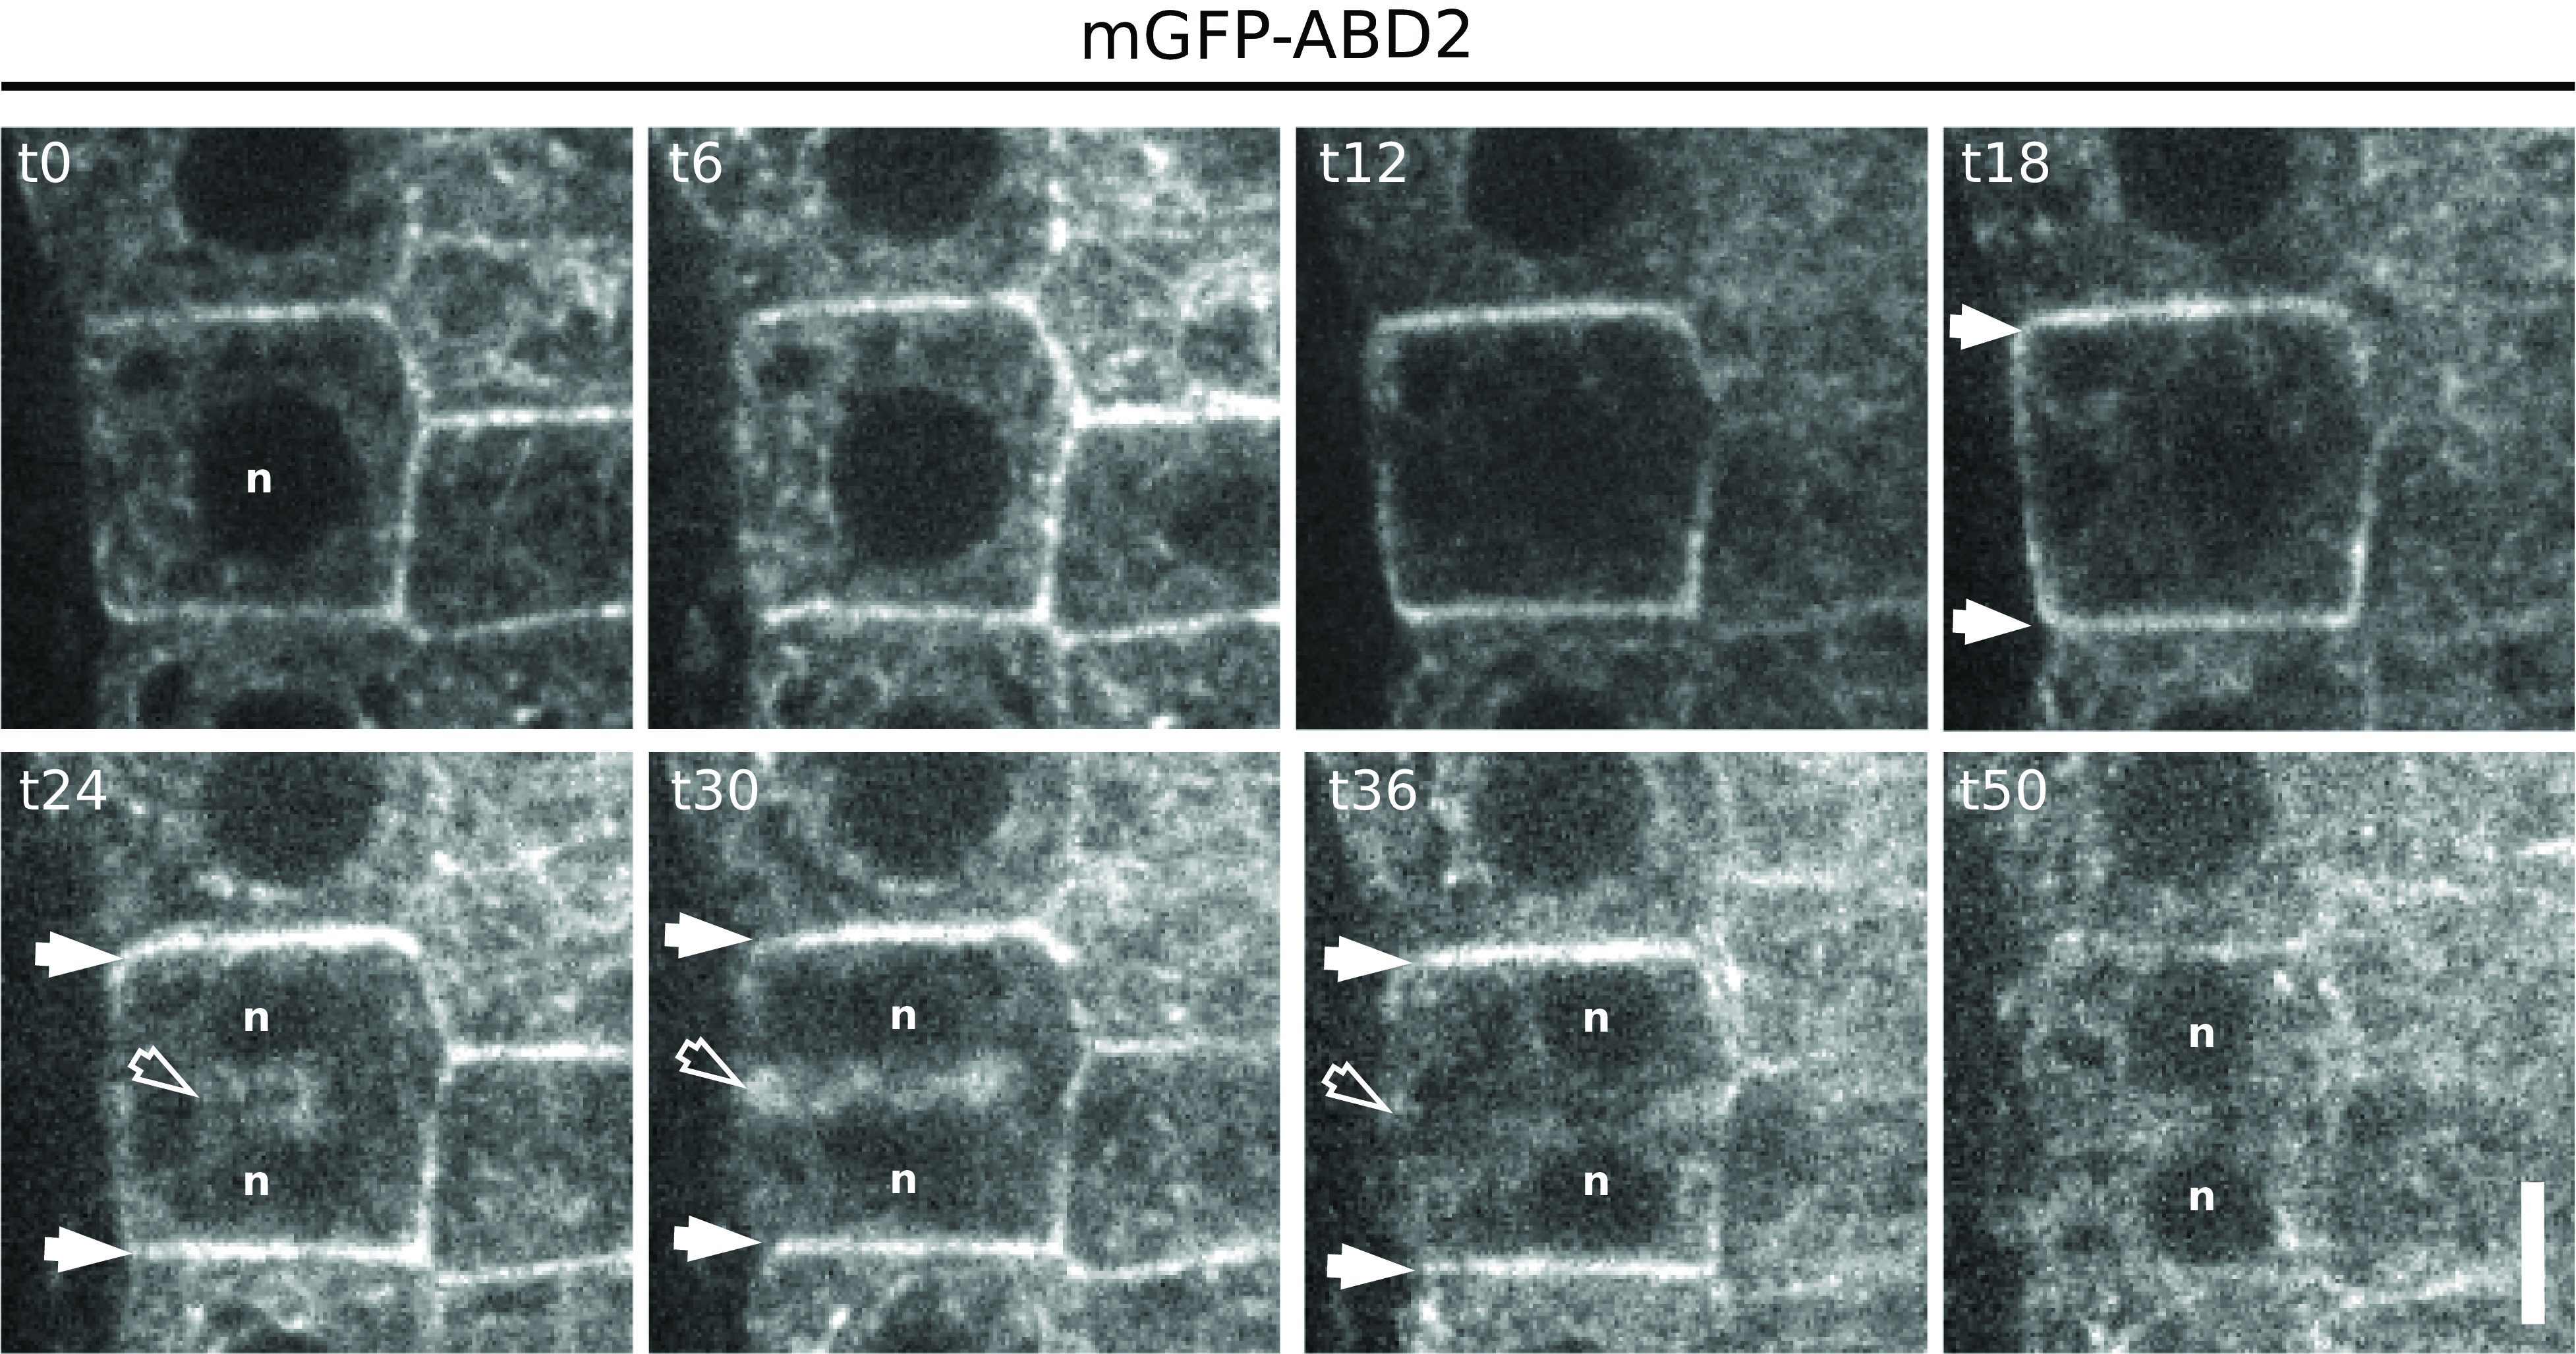
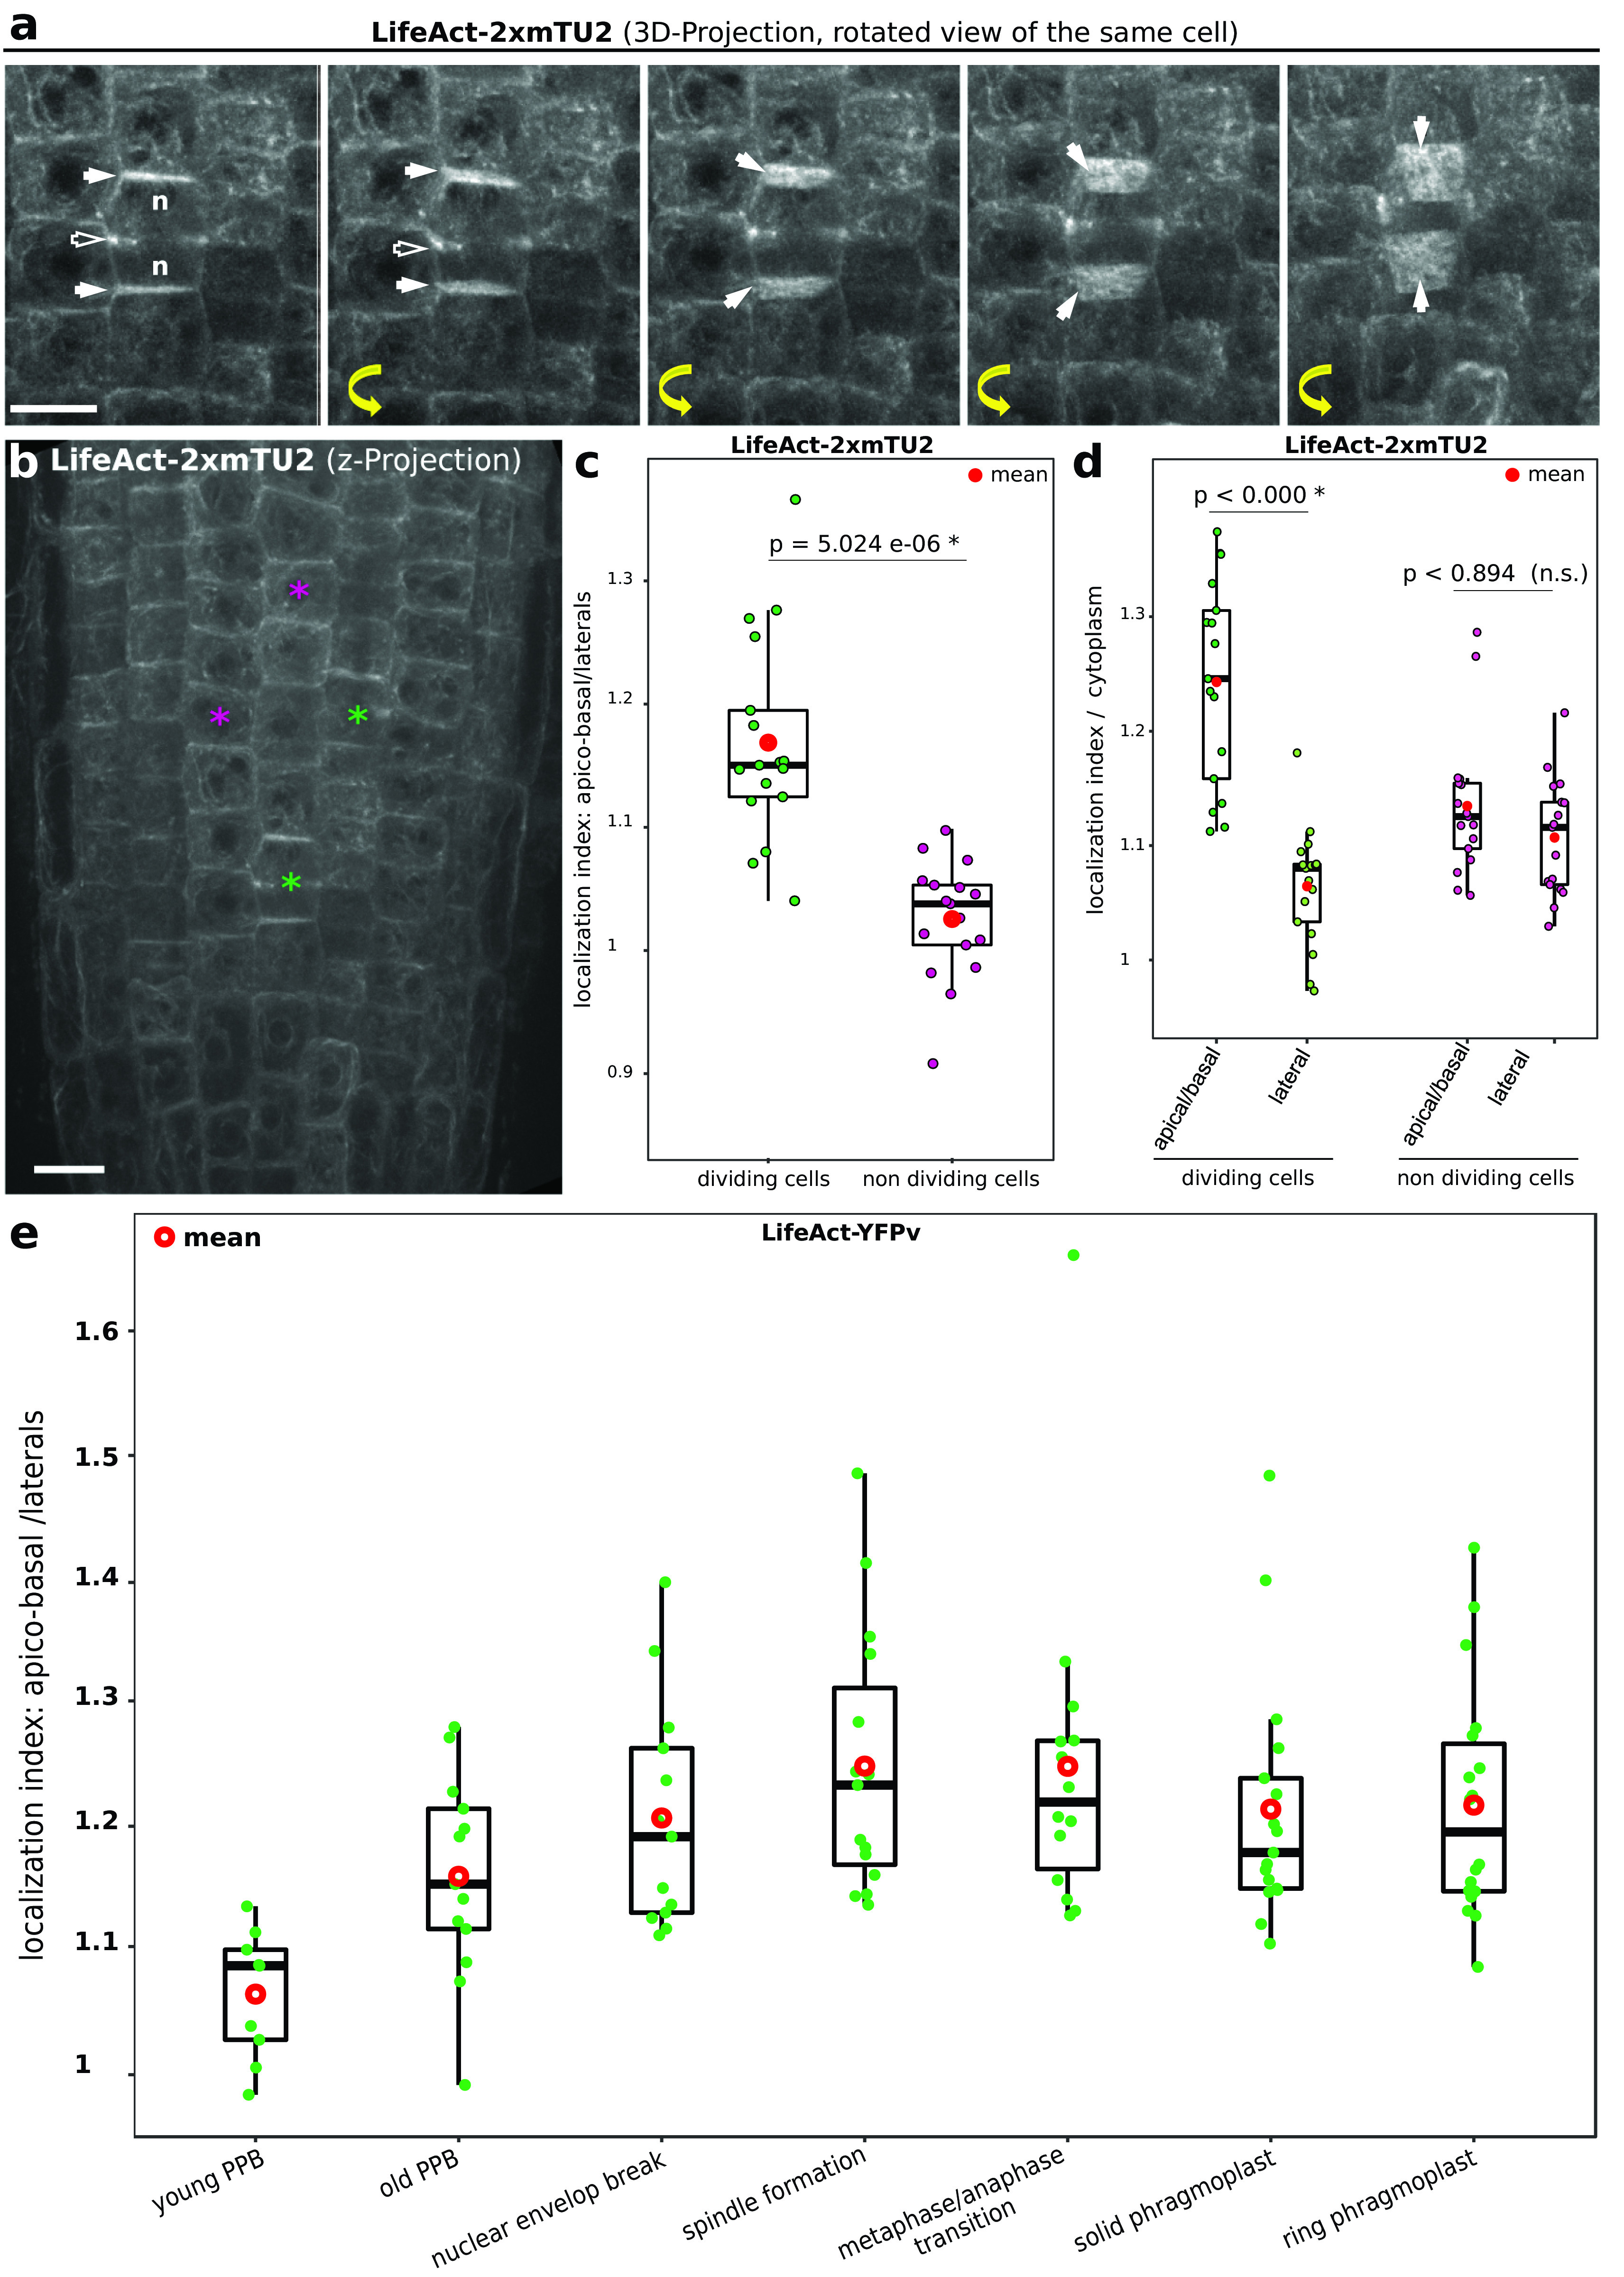
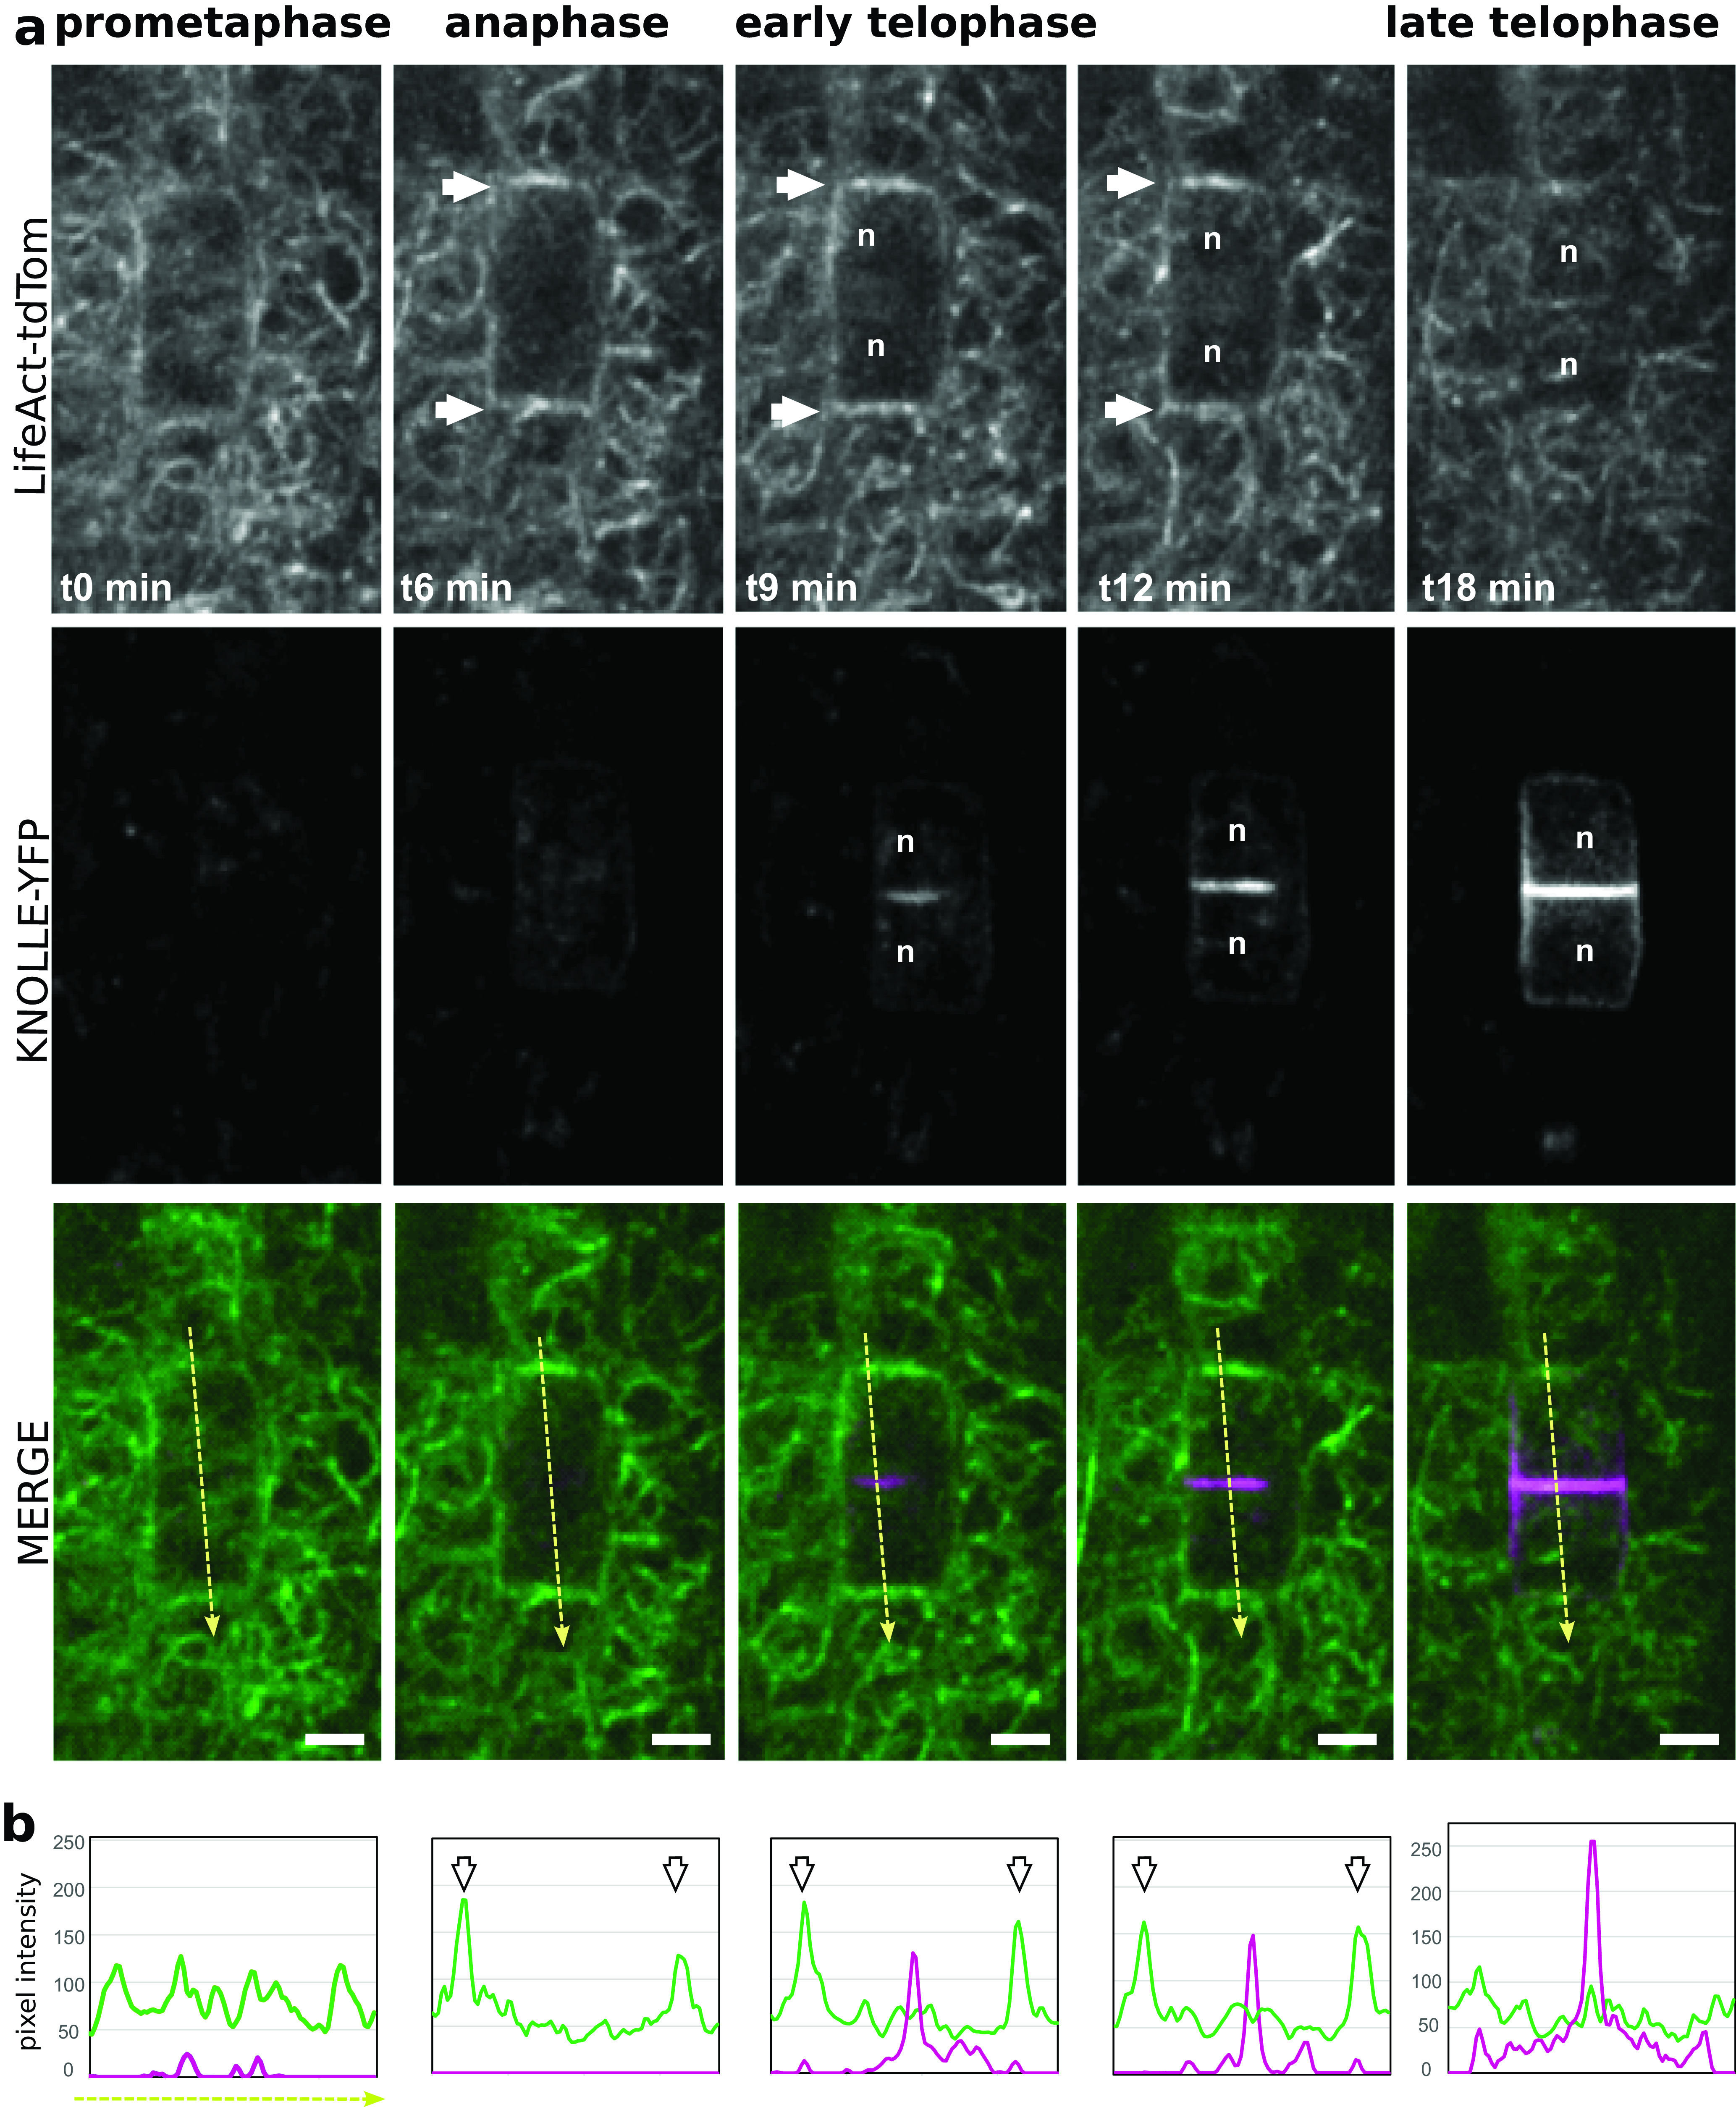
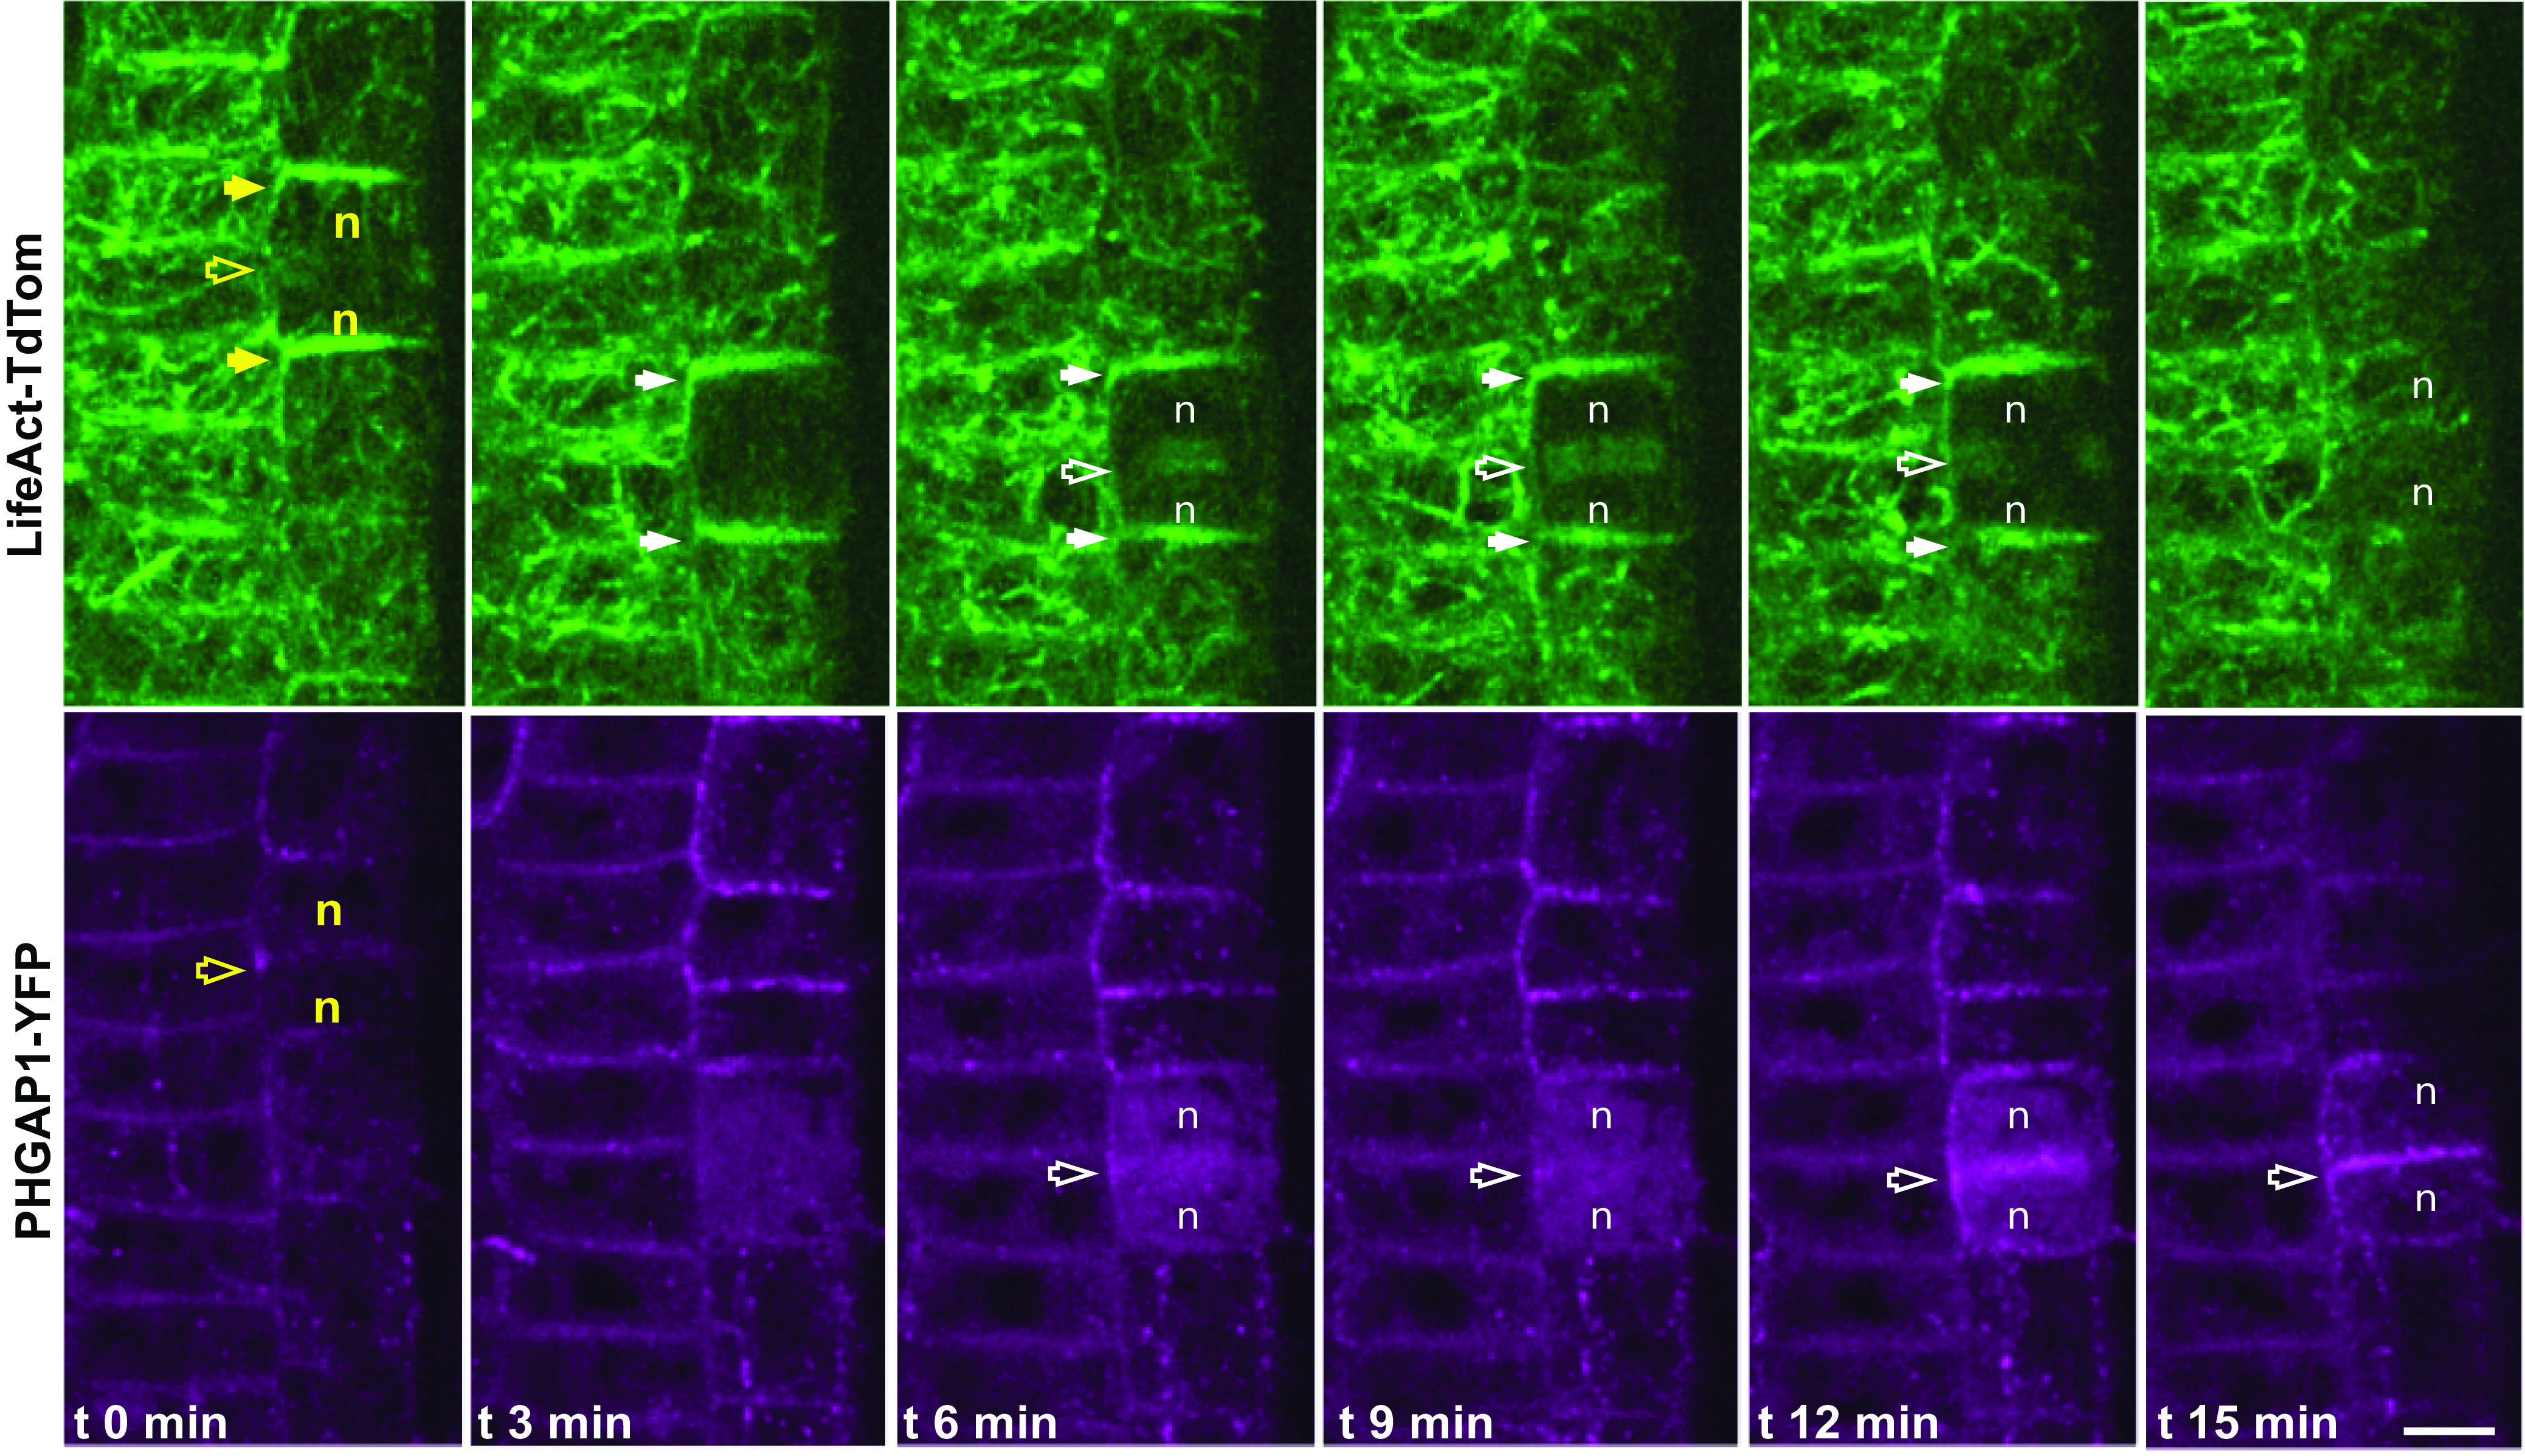
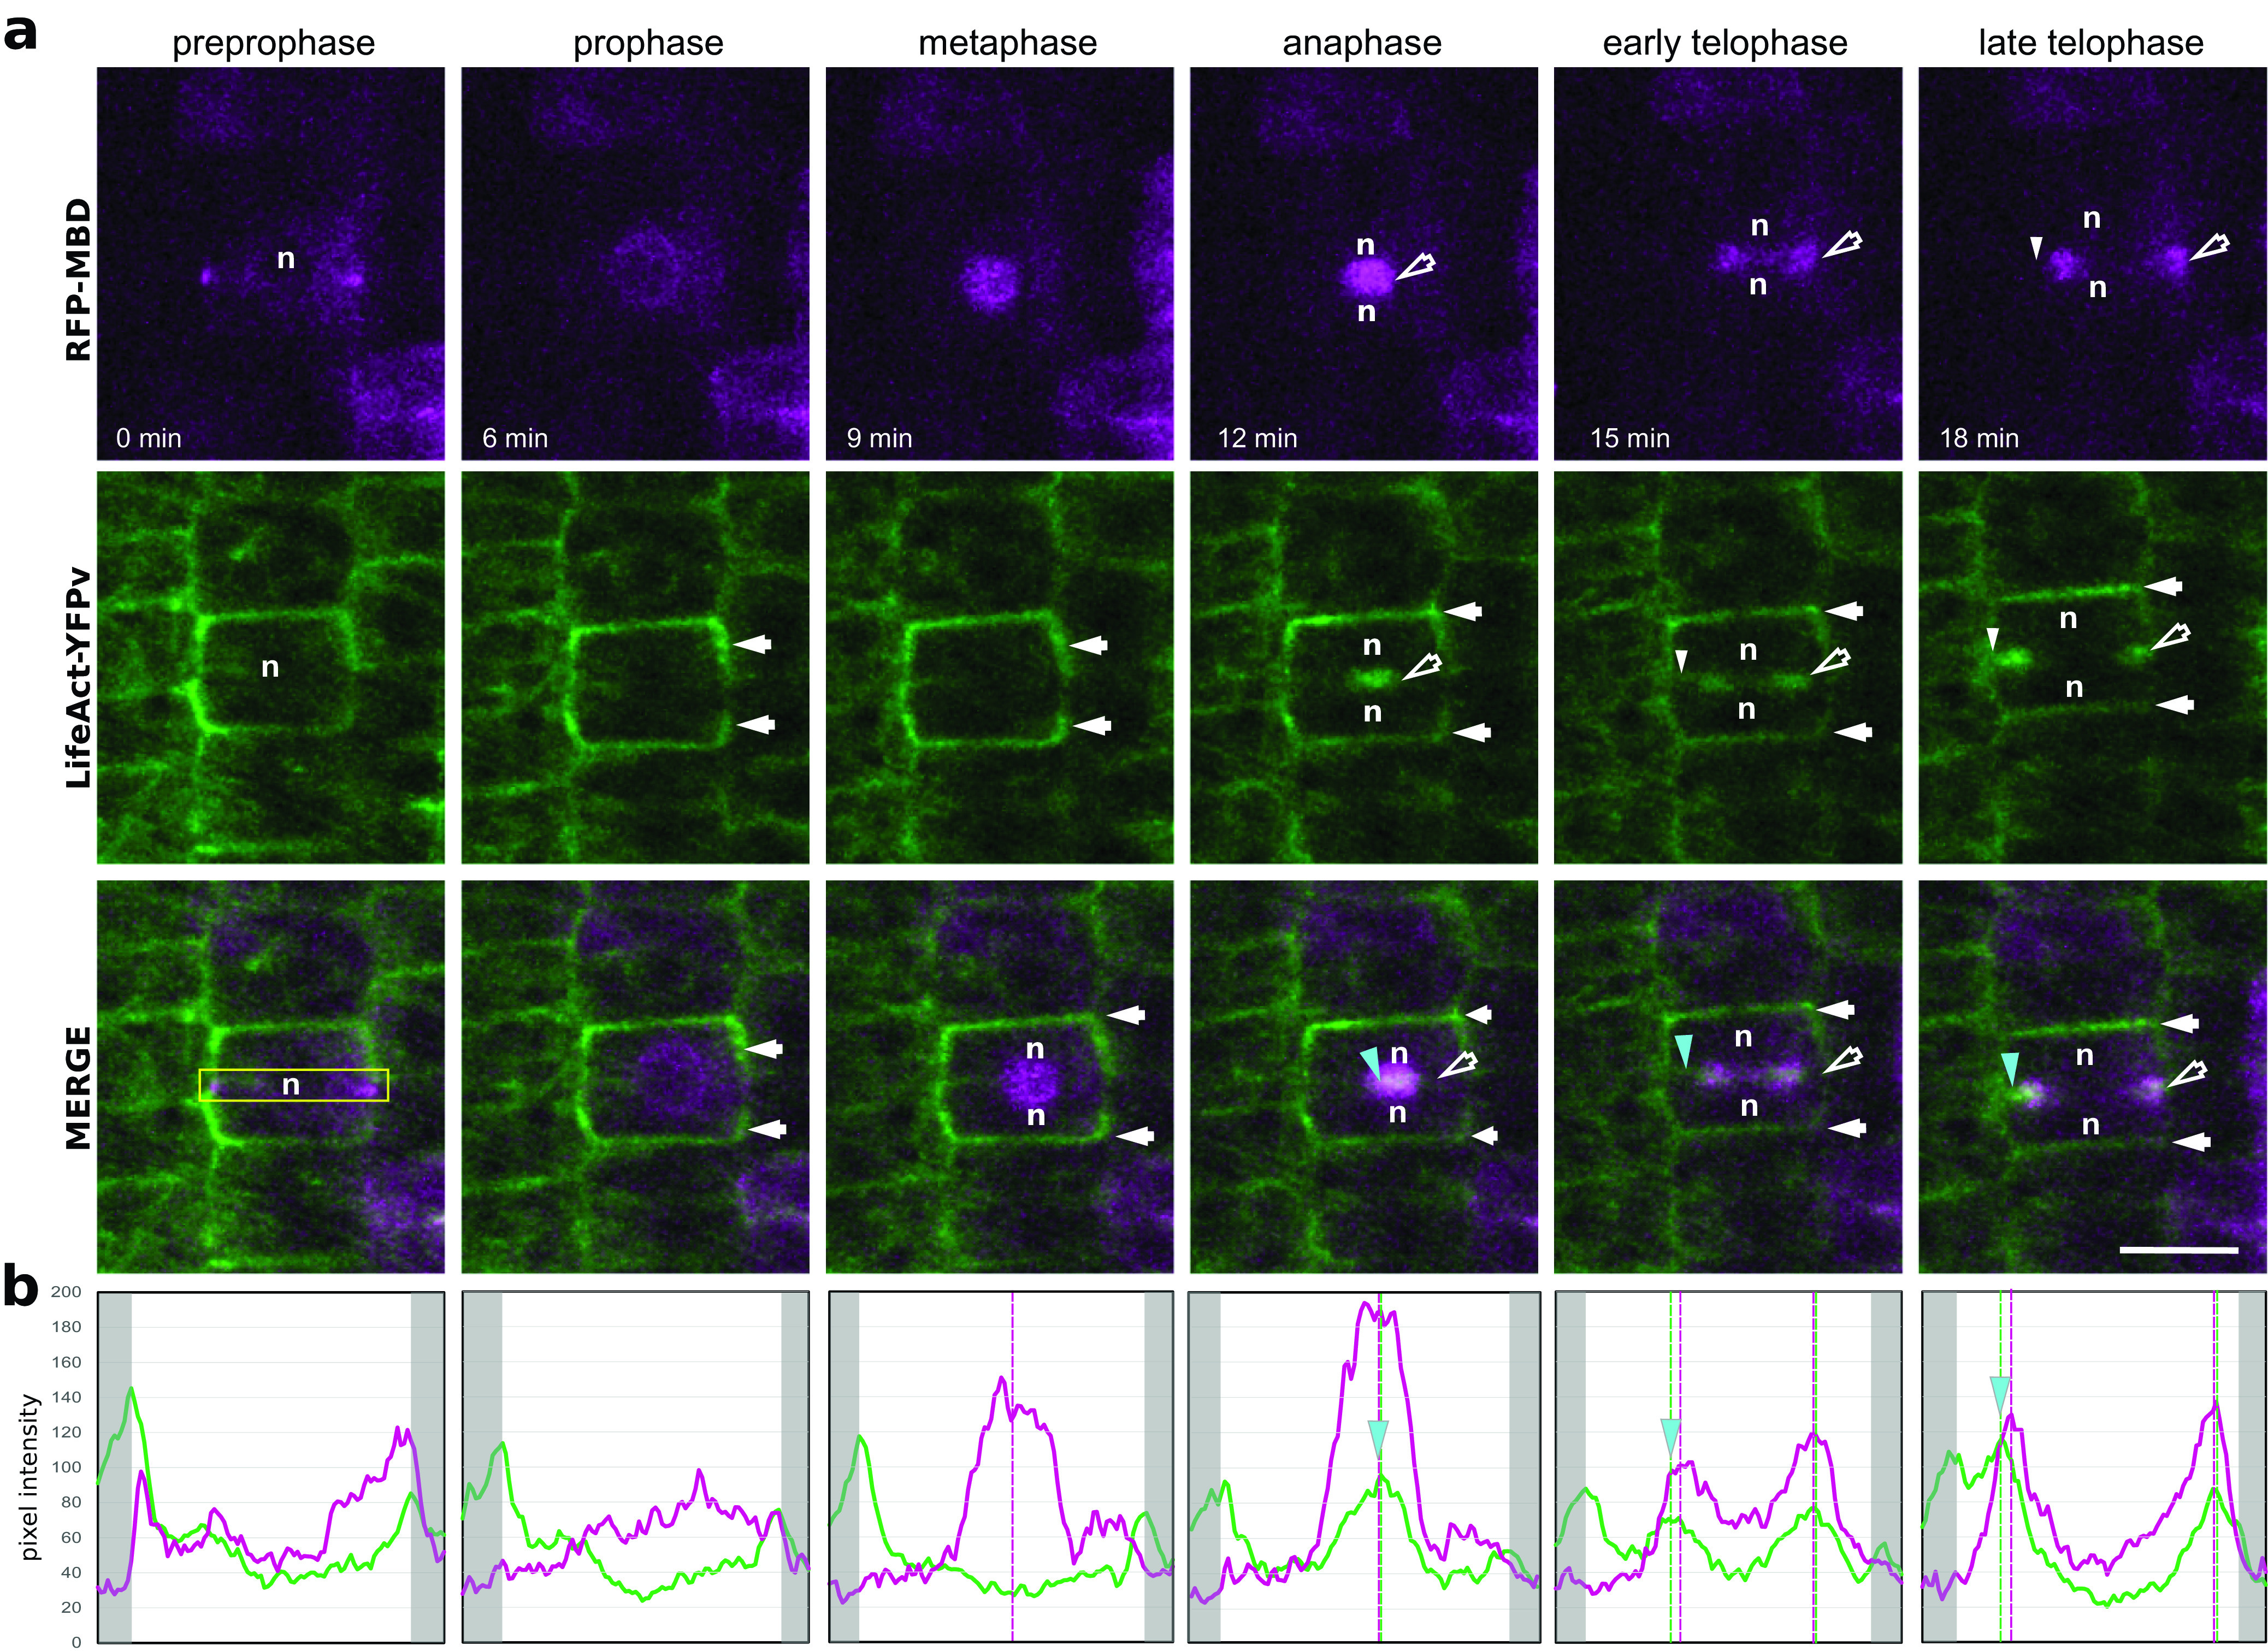
Cell division is a tightly regulated mechanism, notably in tissues where malfunctions can lead to tumour formation or developmental defects. This is particularly true in land plants, where cells cannot relocate and therefore cytokinesis determines tissue topology. In plants, cell division is executed in radically different manners than in animals, with the appearance of new structures and the disappearance of ancestral mechanisms. Whilst F-actin and microtubules closely co-exist, recent studies mainly focused on the involvement of microtubules in this key process. Here, we used a root tracking system to image the spatio-temporal dynamics of both F-actin reporters and cell division markers in dividing cells embedded in their tissues. In addition to the F-actin accumulation at the phragmoplast, we observed and quantified a dynamic apico-basal enrichment of F-actin from the prophase/metaphase transition until the end of the cytokinesis.
Keywords: Arabidopsis; cell division; cytoskeleton; live cell imaging; root-tracking.
© The Author(s) 2022.
Conflict of interest statement
The authors declare none.
Figures
Similar articles
-
Actin Filament Disruption Alters Phragmoplast Microtubule Dynamics during the Initial Phase of Plant Cytokinesis.Plant Cell Physiol. 2020 Mar 1;61(3):445-456. doi: 10.1093/pcp/pcaa003. Plant Cell Physiol. 2020. PMID: 32030404
-
The role of the cytoskeleton and associated proteins in determination of the plant cell division plane.Plant J. 2013 Jul;75(2):258-69. doi: 10.1111/tpj.12177. Epub 2013 Apr 19. Plant J. 2013. PMID: 23496276 Review.
-
Actin organization during the cell cycle in meristematic plant cells. Actin is present in the cytokinetic phragmoplast.Exp Cell Res. 1985 Jan;156(1):231-8. doi: 10.1016/0014-4827(85)90277-0. Exp Cell Res. 1985. PMID: 3965290
-
The cytoplast concept in dividing plant cells: cytoplasmic domains and the evolution of spatially organized cell.Am J Bot. 1999 Feb;86(2):153-72. Am J Bot. 1999. PMID: 21680355
-
Analysis of Phragmoplast Kinetics During Plant Cytokinesis.Methods Mol Biol. 2017;1662:137-150. doi: 10.1007/978-1-4939-7262-3_12. Methods Mol Biol. 2017. PMID: 28861824 Review.
Cited by
-
Imaging the living plant cell: From probes to quantification.Plant Cell. 2022 Jan 20;34(1):247-272. doi: 10.1093/plcell/koab237. Plant Cell. 2022. PMID: 34586412 Free PMC article. Review.
-
The ER-PM interaction is essential for cytokinesis and recruits the actin cytoskeleton through the SCAR/WAVE complex.Proc Natl Acad Sci U S A. 2025 Feb 11;122(6):e2416927122. doi: 10.1073/pnas.2416927122. Epub 2025 Feb 6. Proc Natl Acad Sci U S A. 2025. PMID: 39913210 Free PMC article.
-
Stabilization of F-Actin Cytoskeleton by Paclitaxel Improves the Blastocyst Developmental Competence through P38 MAPK Activity in Porcine Embryos.Biomedicines. 2022 Aug 2;10(8):1867. doi: 10.3390/biomedicines10081867. Biomedicines. 2022. PMID: 36009414 Free PMC article.
References
-
- Aparicio-Fabre, R. , Guillen, G. , Estrada, G. , Olivares-Grajales, J. , Gurrola, G. , & Sanchez, F. (2006). Profilin tyrosine phosphorylation in poly-L-proline-binding regions inhibits binding to phosphoinositide 3-kinase in Phaseolus vulgaris. The Plant Journal: For Cell and Molecular Biology, 47, 491–500. 10.1111/j.1365-313X.2006.02787.x - DOI - PubMed
-
- Buschmann, H. , Green, P. , Sambade, A. , Doonan, J. , & Lloyd, C. (2011). Cytoskeletal dynamics in interphase, mitosis and cytokinesis analysed through agrobacterium‐mediated transient transformation of tobacco BY‐2 cells. New Phytologist, 190, 258–267. - PubMed
-
- Caillaud, M. C. (2022). Methods to Visualize the Actin Cytoskeleton During Plant Cell Division. In Plant Cell Division (pp. 1–16). Humana, New York, NY. - PubMed
-
- Cho, S. O. , & Wick, S. M. (1991). Actin in the developing stomatal complex of winter rye: A comparison of actin antibodies and Rh‐phalloidin labeling of control and CB‐treated tissues. Cell Motility and the Cytoskeleton, 19, 25–36.
LinkOut - more resources
Full Text Sources