. 2022 Dec 23:3:e31.
doi: 10.1017/qpb.2022.20. eCollection 2022.

Correlated mechanochemical maps of Arabidopsis thaliana primary cell walls using atomic force microscope infrared spectroscopy

Affiliations

Correlated mechanochemical maps of Arabidopsis thaliana primary cell walls using atomic force microscope infrared spectroscopy

Natasha Bilkey et al. Quant Plant Biol. .

Abstract

Spatial heterogeneity in composition and organisation of the primary cell wall affects the mechanics of cellular morphogenesis. However, directly correlating cell wall composition, organisation and mechanics has been challenging. To overcome this barrier, we applied atomic force microscopy coupled with infrared (AFM-IR) spectroscopy to generate spatially correlated maps of chemical and mechanical properties for paraformaldehyde-fixed, intact Arabidopsis thaliana epidermal cell walls. AFM-IR spectra were deconvoluted by non-negative matrix factorisation (NMF) into a linear combination of IR spectral factors representing sets of chemical groups comprising different cell wall components. This approach enables quantification of chemical composition from IR spectral signatures and visualisation of chemical heterogeneity at nanometer resolution. Cross-correlation analysis of the spatial distribution of NMFs and mechanical properties suggests that the carbohydrate composition of cell wall junctions correlates with increased local stiffness. Together, our work establishes new methodology to use AFM-IR for the mechanochemical analysis of intact plant primary cell walls.

Keywords: atomic force microscopy; infrared spectroscopy; mechanochemical properties; plant cell wall.


Conflict of interest statement

The authors declare no conflicts of interest.

Figures

None
Graphical abstract
Fig. 1.
Fig. 1.
AFM-IR imaging of an epidermal cell wall in a PFA-fixed A. thaliana stem sample. (a) Image of sample region from the AFM camera. AFM cantilever tip is outlined in yellow. (b,c) Contact resonance mode AFM height image and phase shift map of the large scan region (25 × 25 μm2) showing epidermal cells. Positive shifts in phase indicate increasing sample stiffness. Black box represents where AFM-IR measurements (30 × 30 spectral array) were collected. Scale bar = 5 μm. (d) Phase shift map of the small scan region (3 × 3 μm2) where AFM-IR measurements were collected. White dashed line is outlining a region of increased stiffness at the junction between two epidermal cells. (e,f) Zoomed-in images of two regions of varying phase shift along cell–cell junction, indicated in (d). Scale bar = 500 nm. (g) Height map was obtained of a 3 × 3 μm2 region where AFM-IR data were collected.
Fig. 2.
Fig. 2.
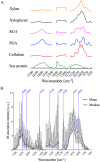
AFM-IR data of PFA-fixed A. thaliana stem epidermal cell wall show similar absorption patterns to FTIR spectra of cell wall standards. (a) Normalised FTIR spectra of cellulose, soy protein, PGA, RG-I, xylan and xyloglucan. FTIR absorption between 1,300–1,171 and 1,503–1,411 cm−1 was removed for comparison with AFM-IR data. (b) A box plot of the AFM-IR spectra collected on the epidermal cell wall sample surface by binning 30 formula image 30 pixels into 15 formula image 15 pixels and by binning spectral wavenumbers 8 formula image . The red and blue lines represent the mean and median AFM-IR spectra, respectively. There was no AFM-IR absorption between 1503–1411 and 1300–1171 cm−1.
Fig. 3.
Fig. 3.
IR wavenumber maps at (a) 1,075 cm−1, (b) 1,525 cm−1 and (c) 1,660 cm−1. The black dashed outline represents the cell–cell junction highlighted in Figure 1d. a.u. = arbitrary units.
Fig. 4.
Fig. 4.
NMF factor spectra represent carbohydrate-rich and protein-like regions in the epidermal cell wall. (a) NMF factor spectra plot for the 3-factor NMF solution. Peaks in each NMF factor spectrum are labelled with vertical lines. There was no AFM-IR absorption between 1,503–1,411 cm−1 and 1,300–1,171 cm−1. (b) Distribution map of Factor 1 representing its concentration (absolute value) in each pixel, with stacked bar plots displaying the ratio of NMF scores of Factors 1, 2 and 3 binned across 6 formula image 6 pixels (one box of the grid). Black dashed outline represents the cell–cell junction highlighted in Figure 1d.
Fig. 5.
Fig. 5.
Higher relative presence of NMF Factor 1 positively correlates with cell wall stiffness. (a) NMF distribution difference between Factor 1 score and sum of Factors 2 and 3 scores. (b). Correlation between phase shift and the NMF distribution difference between Factor 1 score and sum of Factors 2 and 3 scores as seen in Figure 4a for each pixel. Black dashed outline represents cell–cell junction highlighted in Figure 1d.

Similar articles

Cited by

References

    1. Agarwal, U. P. (2006). Raman imaging to investigate ultrastructure and composition of plant cell walls: Distribution of lignin and cellulose in black spruce wood (Picea mariana). Planta, 224, 1141. 10.1007/s00425-006-0295-z - DOI - PubMed
    1. Albenne, C. , Canut, H. , & Jamet, E. (2013). Plant cell wall proteomics: The leadership of Arabidopsis thaliana. Frontiers in Plant Science, 4, 111. 10.3389/fpls.2013.00111 - DOI - PMC - PubMed
    1. Amos, R. A. , & Mohnen, D. (2019). Critical review of plant cell wall matrix polysaccharide glycosyltransferase activities verified by heterologous protein expression. Frontiers in Plant Science, 10, 915. 10.3389/fpls.2019.00915 - DOI - PMC - PubMed
    1. Anderson, C. T. , Carroll, A. , Akhmetova, L. , & Somerville, C. (2010). Real-time imaging of cellulose reorientation during cell wall expansion in Arabidopsis roots. Plant Physiology, 152, 787–796. 10.1104/pp.109.150128 - DOI - PMC - PubMed
    1. Anderson, C. T. , & Wallace, I. S. (2012). Illuminating the wall: Using click chemistry to image pectins in Arabidopsis cell walls. Plant Signaling & Behavior, 7, 661–663. 10.4161/psb.19939 - DOI - PMC - PubMed

LinkOut - more resources