. 2022 Sep 26:3:e19.
doi: 10.1017/qpb.2022.14. eCollection 2022.

MethylScore, a pipeline for accurate and context-aware identification of differentially methylated regions from population-scale plant whole-genome bisulfite sequencing data

Affiliations

MethylScore, a pipeline for accurate and context-aware identification of differentially methylated regions from population-scale plant whole-genome bisulfite sequencing data

Patrick Hüther et al. Quant Plant Biol. .

Abstract

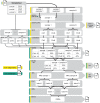
Whole-genome bisulfite sequencing (WGBS) is the standard method for profiling DNA methylation at single-nucleotide resolution. Different tools have been developed to extract differentially methylated regions (DMRs), often built upon assumptions from mammalian data. Here, we present MethylScore, a pipeline to analyse WGBS data and to account for the substantially more complex and variable nature of plant DNA methylation. MethylScore uses an unsupervised machine learning approach to segment the genome by classification into states of high and low methylation. It processes data from genomic alignments to DMR output and is designed to be usable by novice and expert users alike. We show how MethylScore can identify DMRs from hundreds of samples and how its data-driven approach can stratify associated samples without prior information. We identify DMRs in the A. thaliana 1,001 Genomes dataset to unveil known and unknown genotype-epigenotype associations .

Keywords: DNA methylation; Differential methylation; Differentially methylated regions; Epigenome; Whole-genome bisulfite sequencing; machine learning.


Conflict of interest statement

The authors declare the following competing interests: J.H. is currently an employee of Computomics GmbH. S.J.S. is currently the CEO of and holds shares in Computomics GmbH. D.W. hold shares in Computomics GmbH. A.N. is currently an employee of ecSEQ Bioinformatics GmbH. D.L. is currently the CEO of and holds shares in ecSEQ Bioinformatics GmbH.

Figures
None
Graphical abstract
Fig. 1.
Fig. 1.
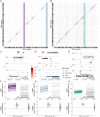
Methylation within DMRs assigns samples into groups according to genotype. Heatmaps and principal component analyses of mean methylation rates in 9,487 CG- (a,d), 1,282 CHG- (b,e) and 741 CHH- (c,f) context-specific DMRs identified by MethylScore from WGBS data from flowers of A. thaliana Col-0 wild-type, respective et1-1 and et2-3 single mutants, and et1-1 et2-3 double mutants. Original data from Tedeschi et al. (2019) (ENA accession PRJEB12413).
Fig. 2.
Fig. 2.
Unsupervised DMR calling from WGBS data of DNA methylation pathway mutants. Heatmaps and PCAs of mean methylation rates in 59,153 CG- (a,d), 63,385 CHG- (b,e) and 440 CHH- (c,f) context-specific DMRs identified by MethylScore from WGBS sequencing data of DNA methylation pathway mutants. The dataset included ddm1 and cmt3 single mutants, tcx5/6 double mutants, as well as tcx5/6 ddm1 and tcx5/6 cmt3 triple mutants. DNA had been sampled from leaves and shoot apical meristem (SAM). Original data from Ning et al. (2020); GEO accession GSE137754.
Fig. 3.
Fig. 3.
MethylScore population clustering partially reflects epigenetic origin of regenerated plant lineages. (a) Heatmaps show methylation rate averages in regions identified as differentially methylated in CG, CHG or CHH methylation contexts (from left to right). The dataset includes leaf and root tissue from Col-0 control plants as well as from generation 1 (G1) and generation 2 (G2) progeny of somatic regenerants from root origin (RO) and leaf origin (LO) somatic embryos, and leaf tissue from F1 and F2 backcrosses of RO and LO regenerants to Col-0. (b) PCAs for each methylation context using the same data are shown in (a). Original data from Wibowo et al. (2018), ENA accession PRJEB26932.
Fig. 4.
Fig. 4.
Population structure analysis of natural A. thaliana accessions based on DMRs identified by the population-scale clustering approach of MethylScore. PCA shows group formation in CG (a), CHG (b) and CHH (c) methylation contexts. Colours indicate admixture groups (left column) and seasonality with regard to the lowest temperature in the coldest month (right column). Data were retrieved via geographic coordinates of collection sites for each accession from the worldclim.org bio6 dataset (Fick & Hijmans, 2017). Original WGBS published in Kawakatsu et al. (2016).
Fig. 5.
Fig. 5.
Genome wide association (GWA) signals recurrently emerge from differential methylation found across the A. thaliana 1,001 Methylomes panel (Kawakatsu et al., 2016). GWA analyses on region-level methylation rate averages reveal recurrent signals in CHG (a) and CHH (b) methylation contexts. For each DMR, only top ranked SNPs that pass the Bonferroni corrected significance threshold at α = 0.05 are included, based on the number of SNP markers available across all 646 A. thaliana accessions used in the study (1,813,837 SNPs with minor allele frequency >5%, p < 2.8×10⁻⁸). (c–e) Genomic loci of recurrent trans-acting SNPs highlighted in (a) and (b). (f–h) Effect sizes of SNPs highlighted in (a) and (b) on methylation rates in regions underlying the SNP association are shown as slopegraphs and bootstrap estimates for carriers of the alternative (ALT) and reference (REF) alleles, respectively. In each plot, an equally sized set of randomly selected DMRs (in gray) is included for comparison.

References

    1. 1001 Genomes Consortium. (2016). 1,135 genomes reveal the global pattern of polymorphism in Arabidopsis thaliana. Cell, 166, 481–491. - PMC - PubMed
    1. Akalin, A. , Kormaksson, M. , Li, S. , Garrett-Bakelman, F. E. , Figueroa, M. E. , Melnick, A. , & Mason, C. E. (2012). methylKit: A comprehensive R package for the analysis of genome-wide DNA methylation profiles. Genome Biology, 13, R87. - PMC - PubMed
    1. Becker, C. , Hagmann, J. , Müller, J. , Koenig, D. , Stegle, O. , Borgwardt, K. , & Weigel, D. (2011). Spontaneous epigenetic variation in the Arabidopsis thaliana methylome. Nature, 480, 245–249. - PubMed
    1. Bhardwaj, V. , Heyne, S. , Sikora, K. , Rabbani, L. , Rauer, M. , Kilpert, F. , Richter, A. S. , Ryan, D. P. , & Manke, T. (2019). snakePipes: Facilitating flexible, scalable and integrative epigenomic analysis. Bioinformatics, 35, 4757–4759. - PMC - PubMed
    1. Cervera, M. T. , Ruiz-García, L. , & Martínez-Zapater, J. M. (2002). Analysis of DNA methylation in Arabidopsis thaliana based on methylation-sensitive AFLP markers. Molecular Genetics and Genomics, 268, 543–552. - PubMed

LinkOut - more resources