Review
. 2022 Dec 9:3:e28.
doi: 10.1017/qpb.2022.25. eCollection 2022.

Using quantitative methods to understand leaf epidermal development

Affiliations
Review

Using quantitative methods to understand leaf epidermal development

Chi Kuan et al. Quant Plant Biol. .

Abstract

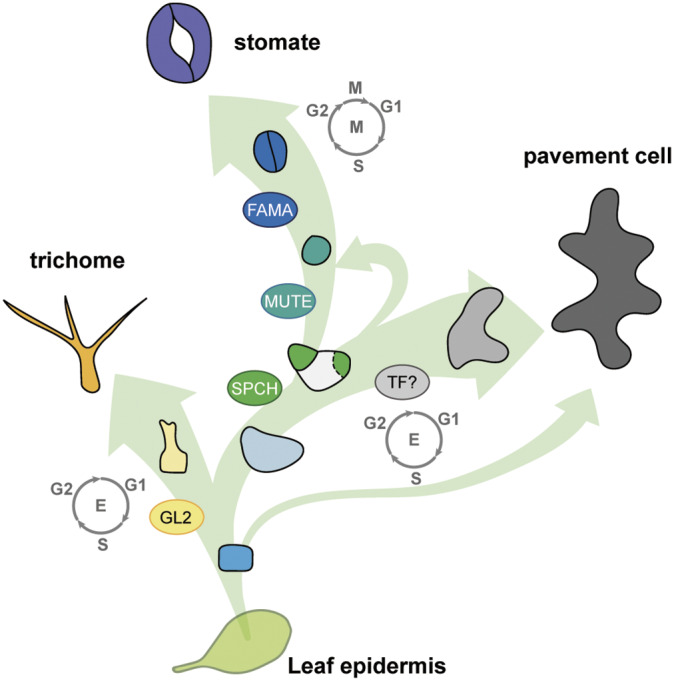
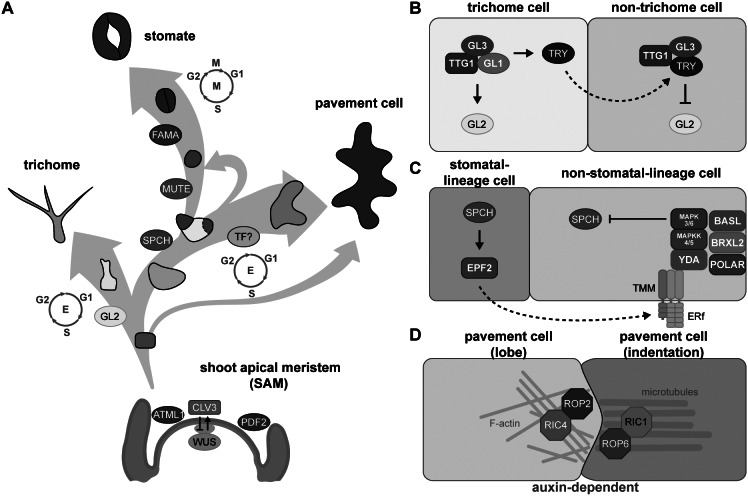
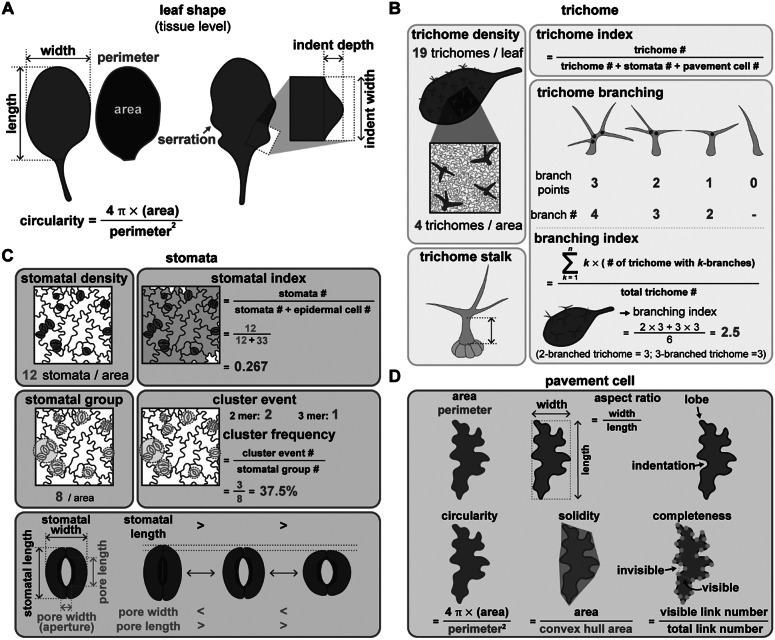
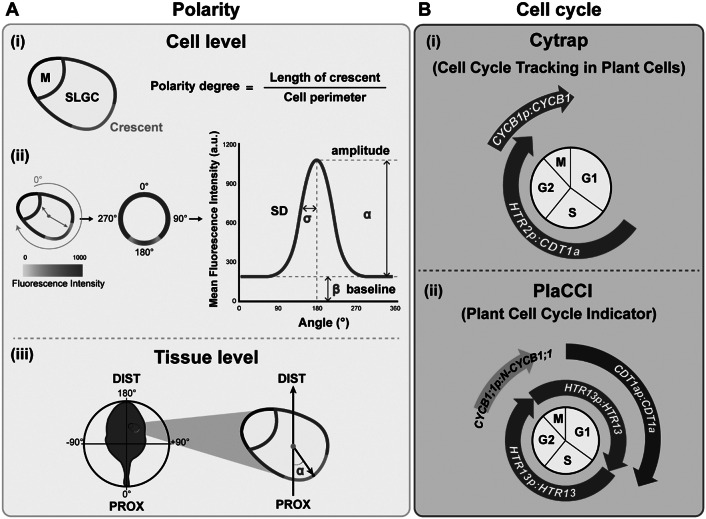
As the interface between plants and the environment, the leaf epidermis provides the first layer of protection against drought, ultraviolet light, and pathogen attack. This cell layer comprises highly coordinated and specialised cells such as stomata, pavement cells and trichomes. While much has been learned from the genetic dissection of stomatal, trichome and pavement cell formation, emerging methods in quantitative measurements that monitor cellular or tissue dynamics will allow us to further investigate cell state transitions and fate determination in leaf epidermal development. In this review, we introduce the formation of epidermal cell types in Arabidopsis and provide examples of quantitative tools to describe phenotypes in leaf research. We further focus on cellular factors involved in triggering cell fates and their quantitative measurements in mechanistic studies and biological patterning. A comprehensive understanding of how a functional leaf epidermis develops will advance the breeding of crops with improved stress tolerance.

Keywords: SLGC; cell state; leaf epidermal development; quantitative methods; stomata.


Conflict of interest statement

The authors declare none.

Figures

None
Graphical abstract
Fig. 1.
Fig. 1.
Key factors involved in fate determination and leaf epidermal patterning during development. (A) Three trajectories describe the three distinct cell types of the leaf epidermis. The development and size of the shoot apical meristem (SAM) is controlled by the CLAVATA3 (CLV3)-WUSCHEL (WUS)-mediated negative feedback loop. The transcription factor (TF) genes ARABIDOPSIS THALIANA MERISTEM LAYER1 (ATML1) and PROTODERMAL FACTOR2 (PDF2) are expressed in the outermost layer (L1, blue) in the SAM to establish epidermal cell identity. Cells in the L1 layer called protoderms give rise to trichome-initiating cells (yellow), meristemoid mother cells (light blue), and pavement cells (grey). During trichome development, the major TF, GLABRA2 (GL2), drives cells to become polyploid trichome cells; the differentiation state is maintained by endoreduplication. To form a stomate, the master TF, SPEECHLESS (SPCH), initiates asymmetric cell division in a meristemoid mother cell to generate a small meristemoid (green) and a stomatal lineage ground cell (SLGC, white). MUTE then replaces SPCH and commits the cell to becoming a guard mother cell. Subsequently, FAMA in the guard mother cell drives symmetric cell division, resulting in a pair of guard cells. An SLGC can either undergo differentiation to become a pavement cell or divide asymmetrically again to produce another stomate (labelled by a dashed line). To date, no cell-type-specific driving factors have been associated with pavement cell formation. However, pavement cell maturation is often coupled with endoreduplication. (B) The cell–cell communication between trichome and non-trichrome cells relies on TRIPTYCHON (TRY). Before trichome initiation, GL1, GL3, and TRANSPARENT TESTA GLABRA1 (TTG1) form a stable MBW complex to activate GL2 transcription. GL2 accumulation promotes trichome cell fate. Besides GL2, the MBW complex also activates TRY expression in trichome cells. TRY tends to move to the neighbouring non-trichome cell to replace GL1 and disrupt the formation of the MBW complex, thus repressing GL2 and inhibiting the trichome cell fate. (C) Stomatal patterning follows the one-cell-spacing rule, meaning that two stomata never directly contact each other, and this signalling is mediated through peptide-mediated inhibitory signals and polarity establishment during stomatal development. SPCH drives the accumulation of a signalling peptide, EPIDERMAL PATTERNING FACTOR2 (EPF2), in meristemoids. The secreted peptides then bind to members of the receptor-like kinase ERECTA family and the receptor-like protein TMM on the surface of neighbouring cells. The binding triggers a MAPK cascade that phosphorylates and inhibits SPCH activity, thus preventing stomatal fate in these neighbouring cells. The interplay of chemical transduction and the polarity complex consisting of BASL, BREVIS RADIX-LIKE2 (BRXL2), and POLAR is required for asymmetric cell division and serves as a scaffold for recruiting and exerting inhibitory signalling in non-stomatal lineage cells. (D) Pavement cell formation is controlled biochemically by auxin. The high auxin concentration at the lobe initiation site induces the asymmetric accumulation of RHO-RELATED PROTEIN FROM PLANTS (ROP)-ROP-INTERACTIVE CRIB MOTIF-CONTAINING PROTEIN (RIC) in the two pavement cells. For the lobing cell (left), the recruitment of ROP2 and RIC4 helps the formation of actin filaments (F-actin) and further results in the protrusion of the cell. For the indented cell (right), ROP6 and RIC1 stabilise microtubule organisation under parallel direction and further pull the cell, forming an indentation.
Fig. 2.
Fig. 2.
Quantitative methods to describe leaf morphology and the different types of epidermal cells. (A) Leaf shape can be described by its length, width, and the length/width ratio. Circularity calculated by (4 formula image ×leaf area)/(square perimeter) indicates that the leaf shape is approximately round (circularity = 1) or contains serrations (circularity closer to 0). If serrations are visible on a leaf, the indent length and width can be used to describe the extent of serration. (B) Trichome phenotypes can be measured by the number of trichomes on a leaf and trichome morphology. Trichome density can be scored over an entire leaf or a given area. Trichome index is the number of trichomes divided by the number of total epidermal cells including trichome, stomatal, and pavement cells over a given area. The trichome stalk, the branching number, and the branching points can be used to represent trichome shape. The trichome branching index represents the average number of branches in a trichome population. (C) Stomatal phenotypes can be described by stomatal number, pattern, and dynamics. Stomatal density represents the number of stomata over a given area. The stomatal index is defined as the number of stomata divided by the total number of epidermal cells. Stomatal groups are the number of stomatal islands in a given area. Adjacent stomata are defined as one group. A cluster event represents the number of islands with adjacent stomata. Cluster frequency represents the error rate of forming stomatal clusters. The movements of stomata can be described by stomatal length and width. Pore length and width excluding guard cells may also be used. During stomatal opening, the stomatal and pore lengths decrease, while the pore width increases. (D) Pavement cell phenotypes can be described according to their shape including the parameters of area, perimeter, length and width. The aspect ratio calculates the ratio between cell length and width. The jigsaw-puzzle shape can be described by the number of lobes and indentations, which can be expressed as circularity, solidity, and completeness. Circularity is calculated as (4 formula image ×cell area)/(square perimeter). Solidity is the ratio between cell area and convex hull area. Completeness is the ratio between visible and total possible links. A visible link represents the link between two nodes without crossing over the cell outline. An invisible link is defined as a link between two nodes that crosses over the cell outline. All three parameters have maxima equal to 1. They decrease when the cell takes on the shape of a jigsaw-puzzle piece.
Fig. 3.
Fig. 3.
Quantitative tools for measuring polarity and the cell cycle. (A) Polarity measurements. (i) The polarity degree is calculated by the crescent length (green) relative to the cell perimeter (green+pink). M: meristemoid. SLGC, stomatal lineage ground cell. (ii) Workflow for Polarity Measurement (POME), a Fiji-based semi-automated pipeline for polarity quantification: First, a line of 0° to 180° angle is defined by the centroid to the centre of polar protein mass. Second, the cell outline is reconstructed and visualised by quantification of the fluorescence intensity. Third, standard deviation (SD, formula image ), amplitude ( formula image ), and baseline intensity ( formula image ) derived from the fluorescence intensity through Gaussian fitting quantify the degree of polarisation in the plasma membrane, with higher SD values representing higher polarity levels. (iii) Tissue-wide polarity orientation can be indicated by the angle (α) between the leaf midrib and the connection between the cell centroid (orange dot) and the midpoint of the polarity crescent. (B) Cell cycle measurements. (i) Cytrap (Cell cycle tracking in plant cells) line. The dual-colour cell cycle reporter line uses HTR2pro:CDT1a-RFP and CYCB1pro:CYCB1-GFP to indicate S/G2 and G2/M, respectively. (ii) PlaCCI (Plant Cell Cycle Indicator) line. The three-colour cell cycle reporter line adopted CDT1apro:CDT1a-CFP, CYCB1:1pro:CYCB1;1-YFP, and HTR13pro:HTR13-mCherry to indicate G1, G2/M, and the entire cell cycle, respectively.

References

    1. Abe, M. , Katsumata, H. , Komeda, Y. , & Takahashi, T. (2003). Regulation of shoot epidermal cell differentiation by a pair of homeodomain proteins in Arabidopsis. Development (Cambridge, England), 130, 635–643. - PubMed
    1. Abe, T. , Thitamadee, S. , & Hashimoto, T. (2004). Microtubule defects and cell morphogenesis in the lefty1lefty2 tubulin mutant of Arabidopsis thaliana. Plant and Cell Physiology, 45, 211–220. - PubMed
    1. Allen, H. R. , & Ptashnyk, M. (2020). Mathematical modelling of auxin transport in plant tissues: Flux meets signalling and growth. Bulletin of Mathematical Biology, 82, 17. - PMC - PubMed
    1. Altartouri, B. , Bidhendi, A. J. , Tani, T. , Suzuki, J. , Conrad, C. , Chebli, Y. , Liu, N. , Karunakaran, C. , Scarcelli, G. , & Geitmann, A. (2019). Pectin chemistry and cellulose crystallinity govern pavement cell morphogenesis in a multi-step mechanism. Plant Physiology, 181, 127–141. - PMC - PubMed
    1. Asaoka, M. , Ooe, M. , Gunji, S. , Milani, P. , Runel, G. , Horiguchi, G. , Hamant, O. , Sawa, S. , Tsukaya, H. , & Ferjani, A. (2021). Stem integrity in Arabidopsis thaliana requires a load-bearing epidermis. Development (Cambridge, England), 148, dev198028. - PubMed

LinkOut - more resources