. 2023 Jun;43(6):958-970.
doi: 10.1161/ATVBAHA.122.318938. Epub 2023 Apr 20.

Magnetic Resonance Imaging of Mouse Cerebral Cavernomas Reveal Differential Lesion Progression and Variable Permeability to Gadolinium

Affiliations

Magnetic Resonance Imaging of Mouse Cerebral Cavernomas Reveal Differential Lesion Progression and Variable Permeability to Gadolinium

Delaney G Fisher et al. Arterioscler Thromb Vasc Biol. 2023 Jun.

Abstract

Background: Cerebral cavernous malformations, also known as cavernous angiomas, are blood vessel abnormalities comprised of clusters of grossly enlarged and hemorrhage-prone capillaries. The prevalence in the general population, including asymptomatic cases, is estimated to be 0.5%. Some patients develop severe symptoms, including seizures and focal neurological deficits, whereas others remain asymptomatic. The causes of this remarkable presentation heterogeneity within a primarily monogenic disease remain poorly understood.

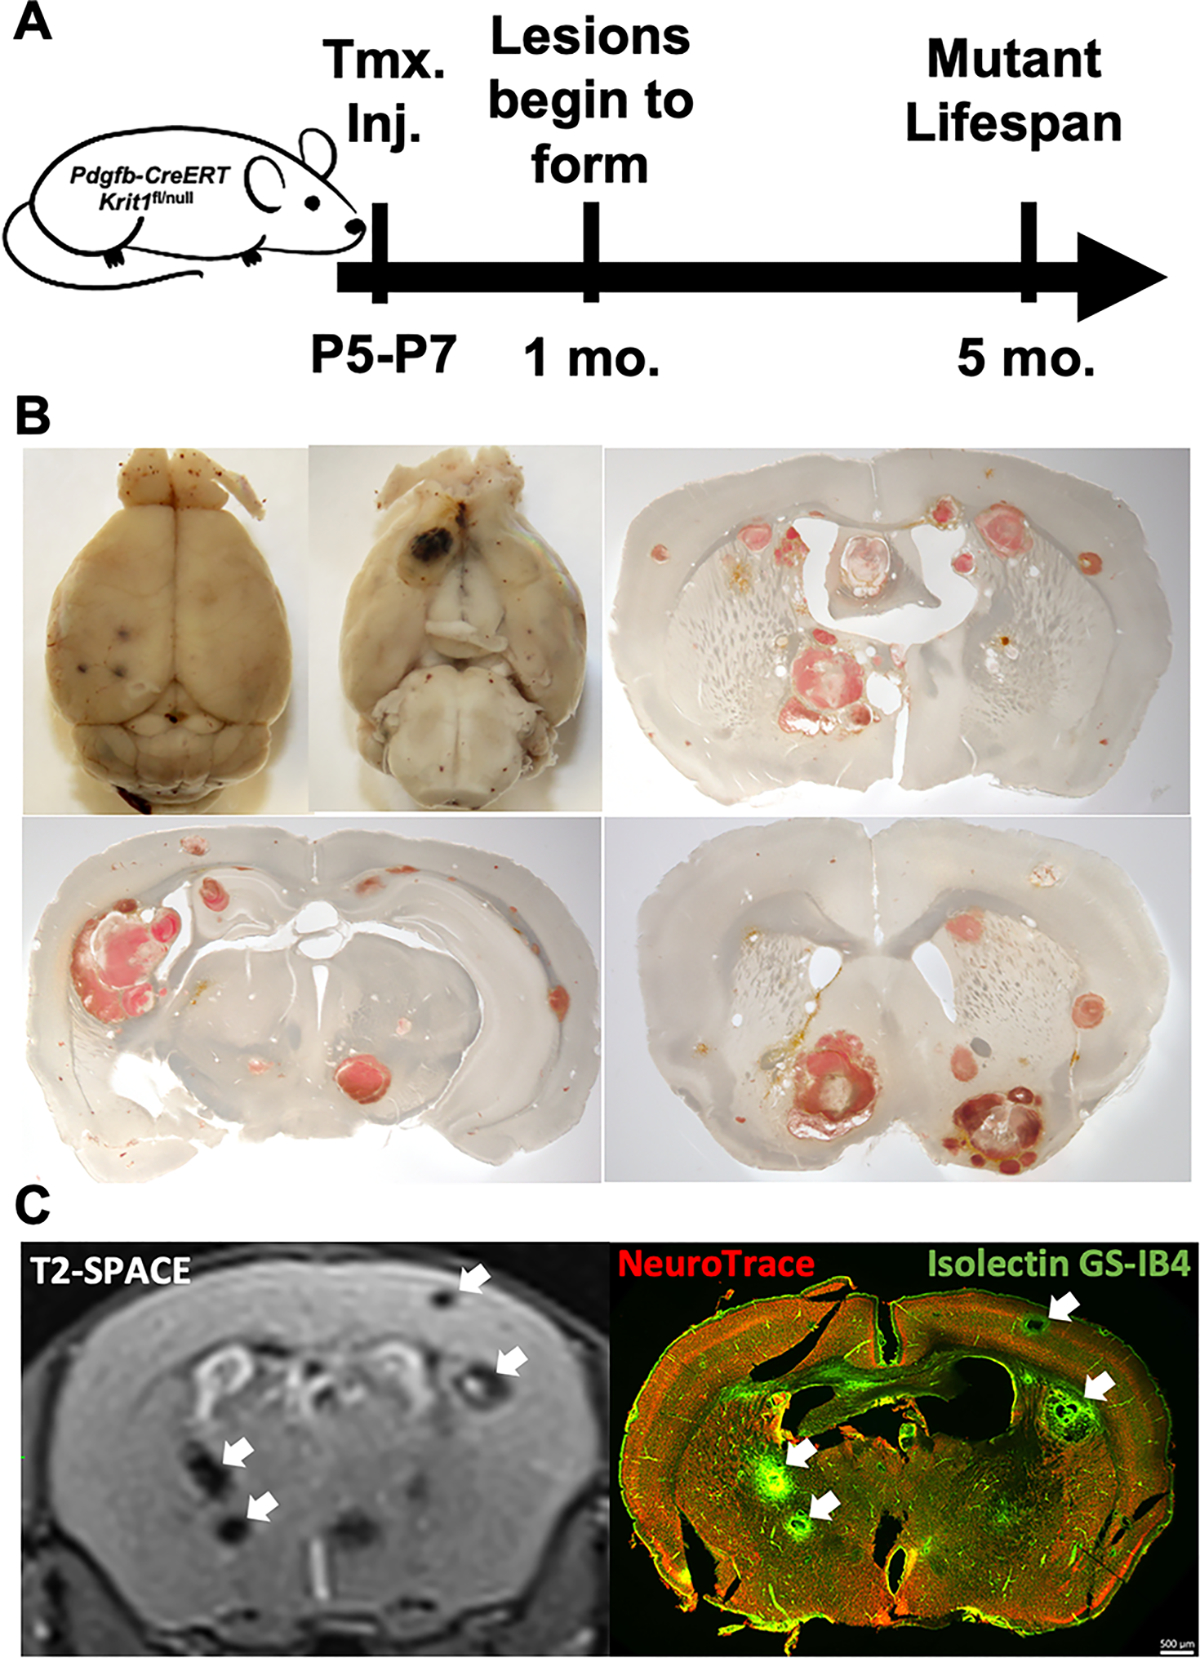
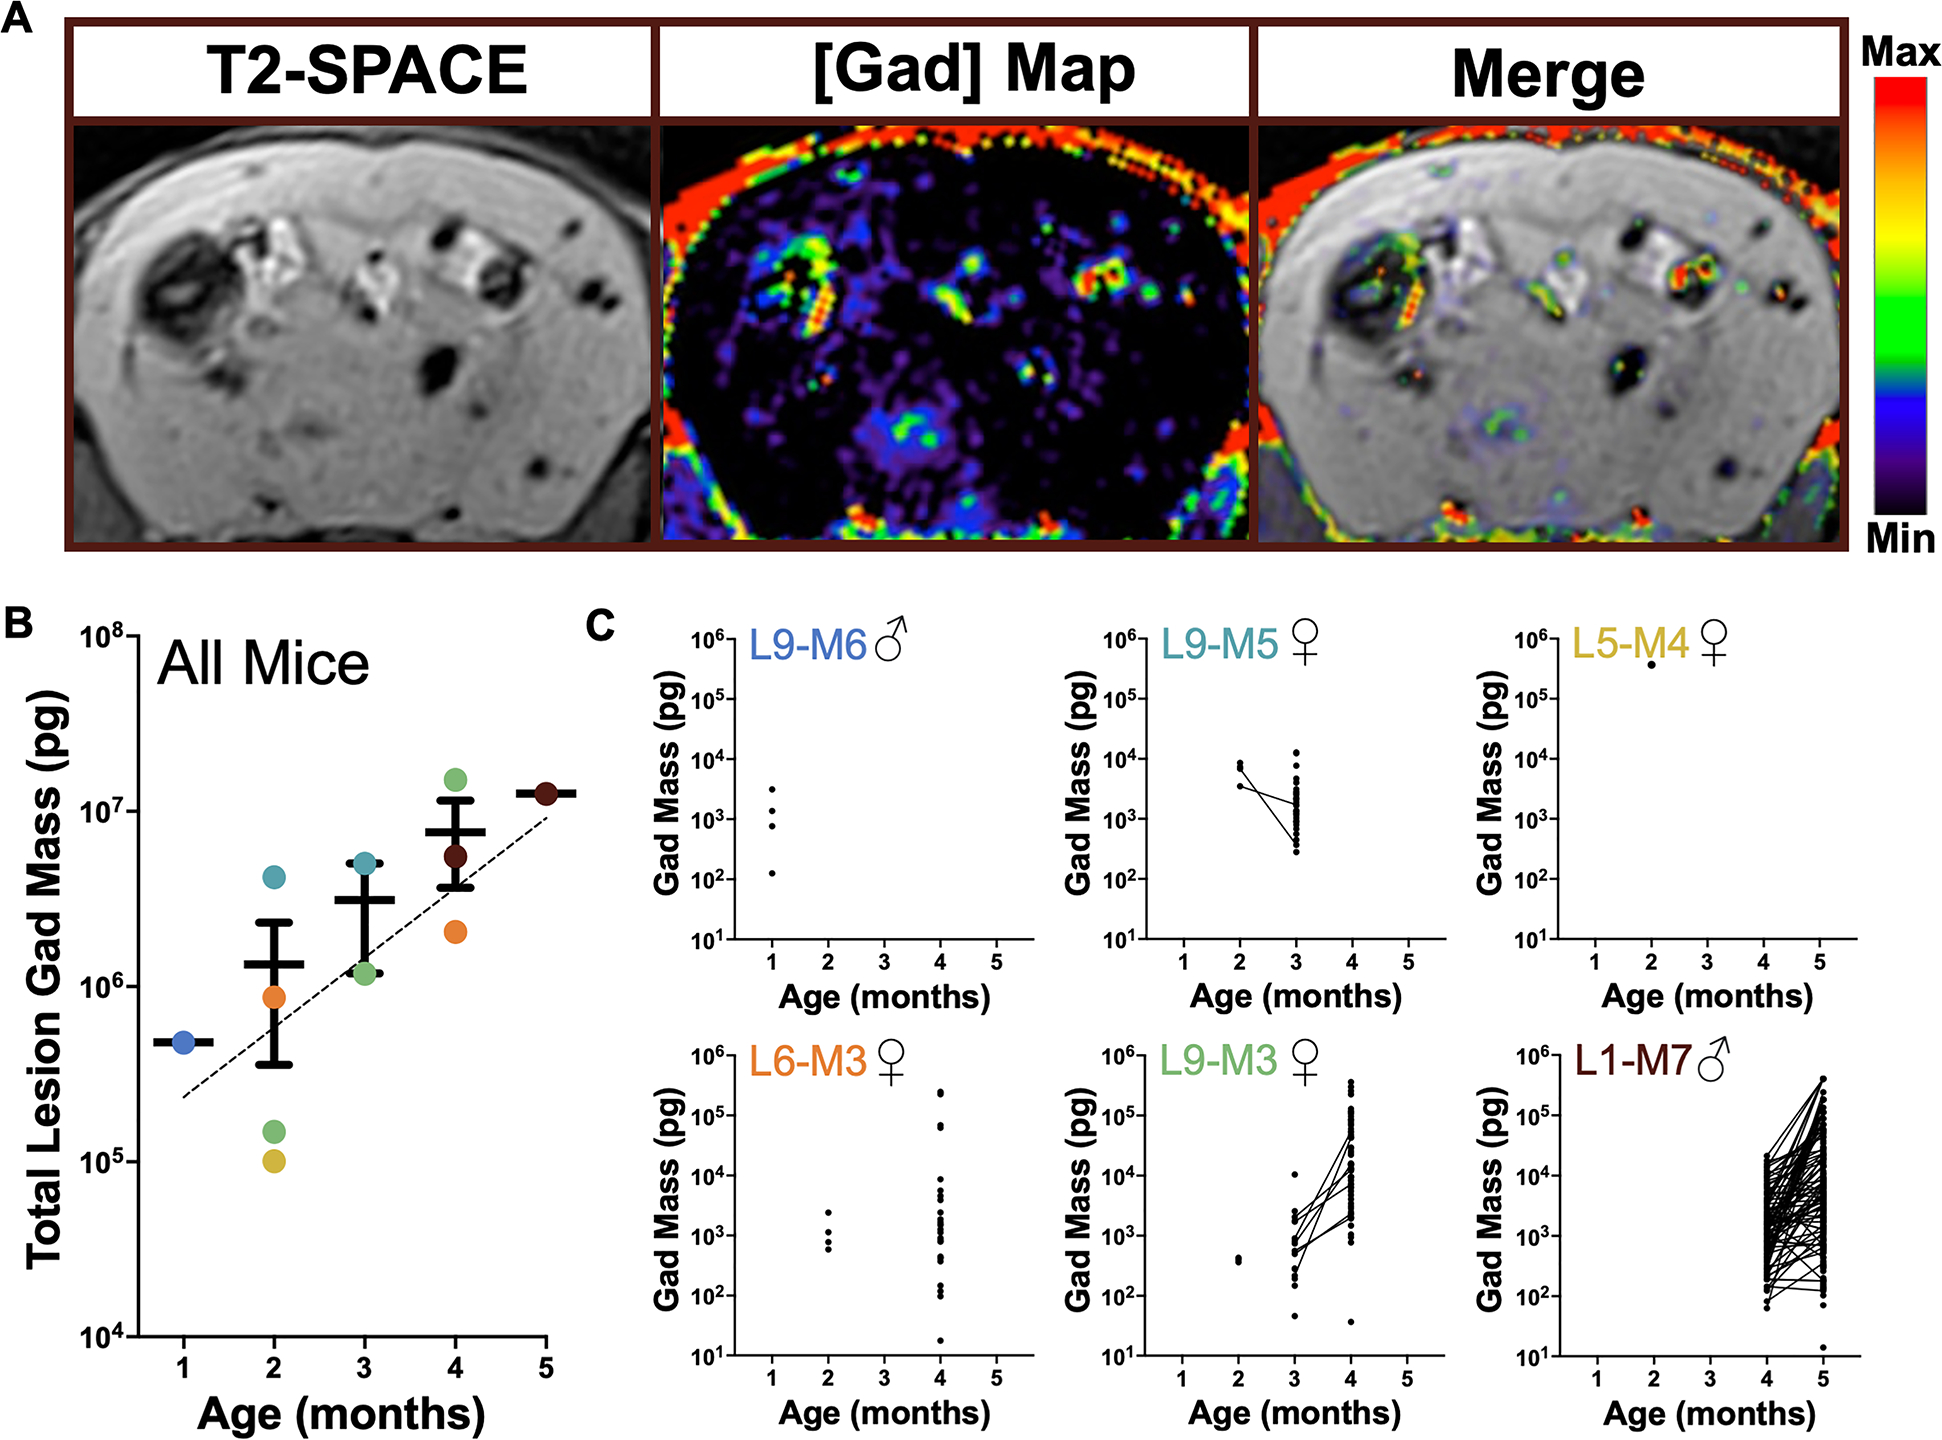
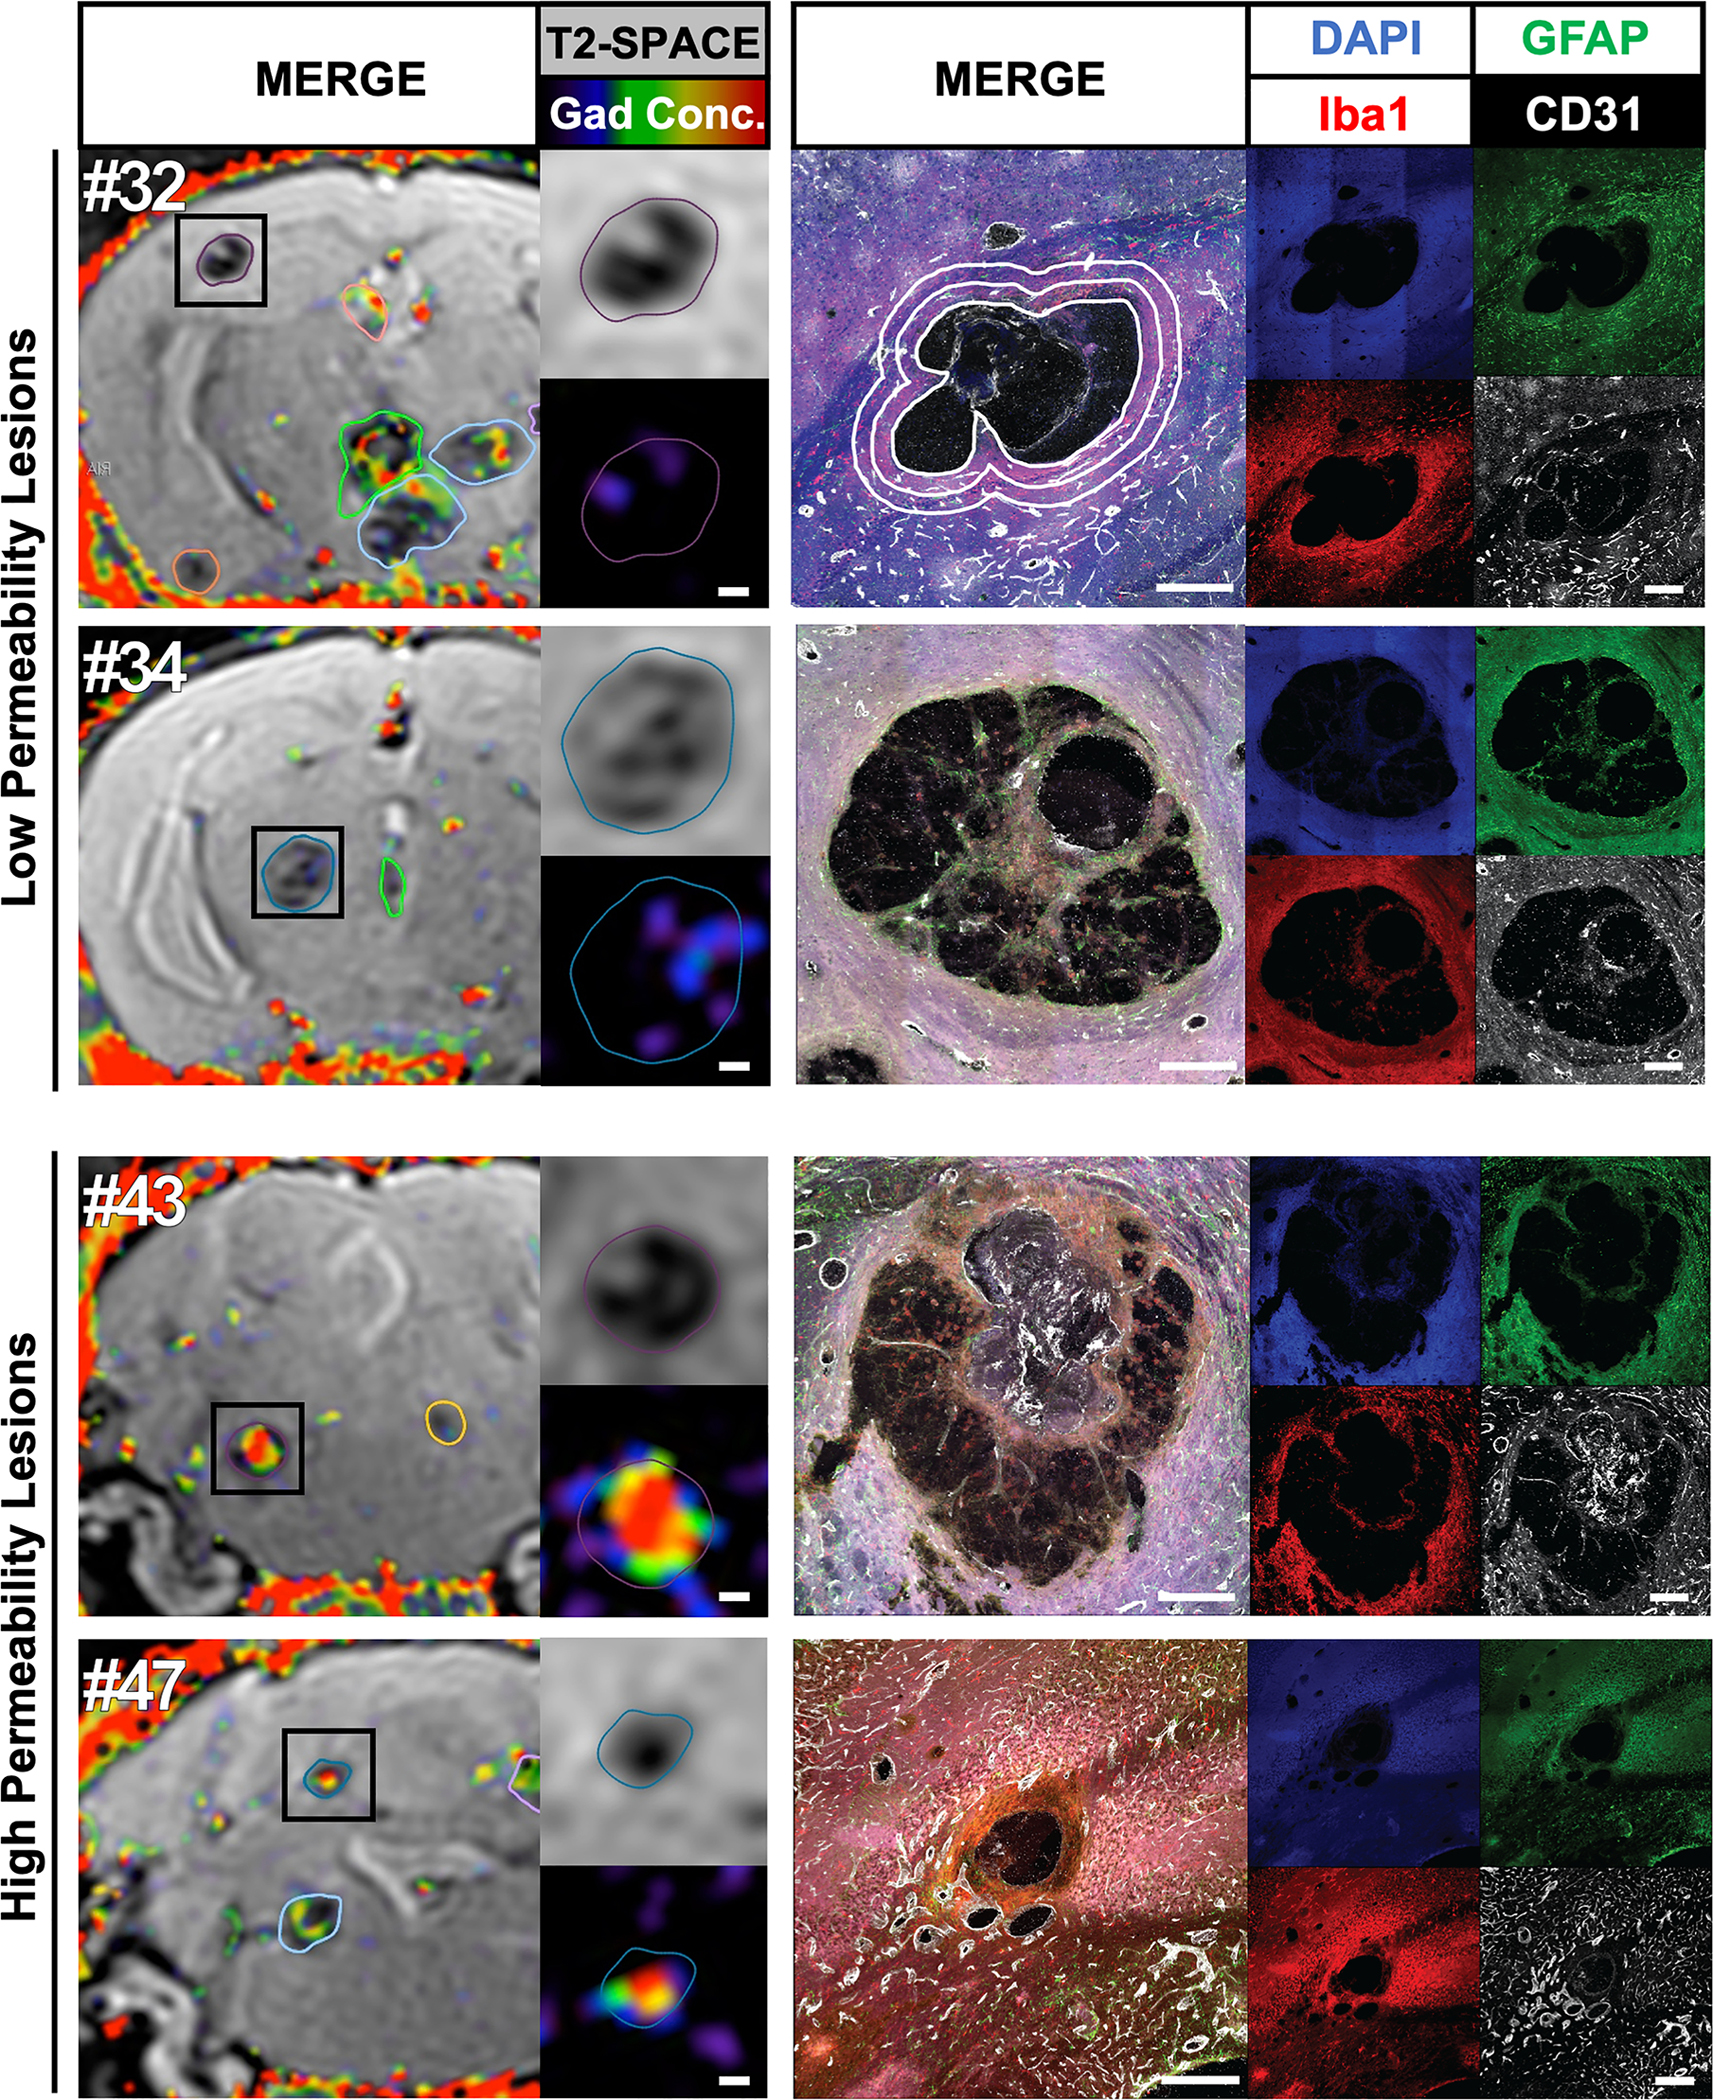
Methods: We established a chronic mouse model of cerebral cavernous malformations, induced by postnatal ablation of Krit1 with Pdgfb-CreERT2, and examined lesion progression in these mice with T2-weighted 7T magnetic resonance imaging (MRI). We also established a modified protocol for dynamic contrast-enhanced MRI and produced quantitative maps of gadolinium tracer gadobenate dimeglumine. After terminal imaging, brain slices were stained with antibodies against microglia, astrocytes, and endothelial cells.

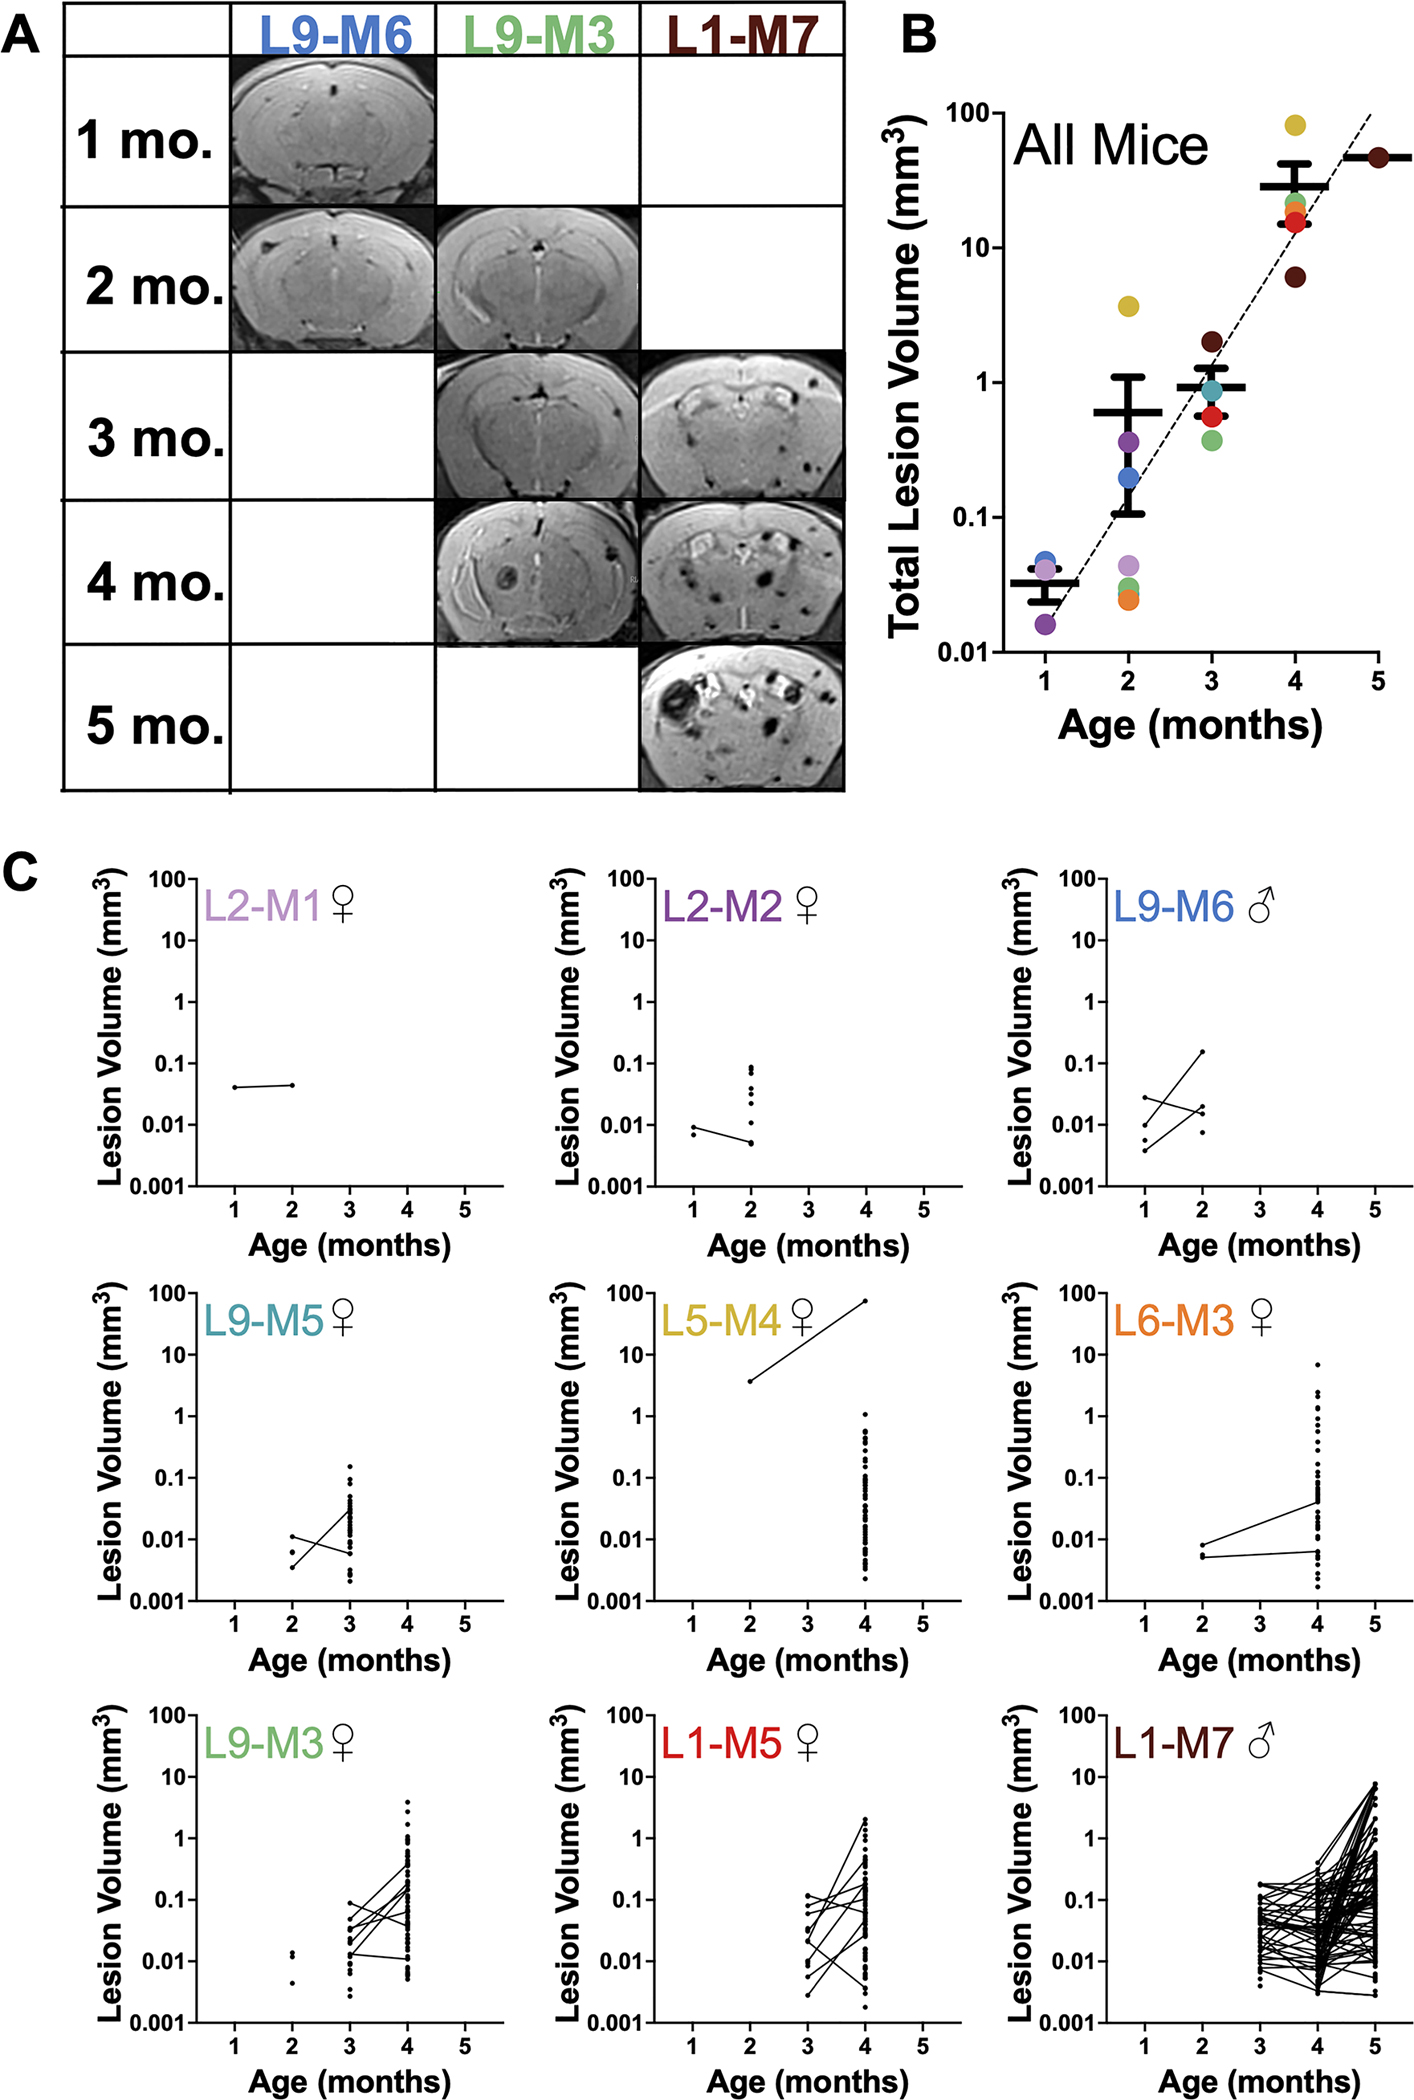
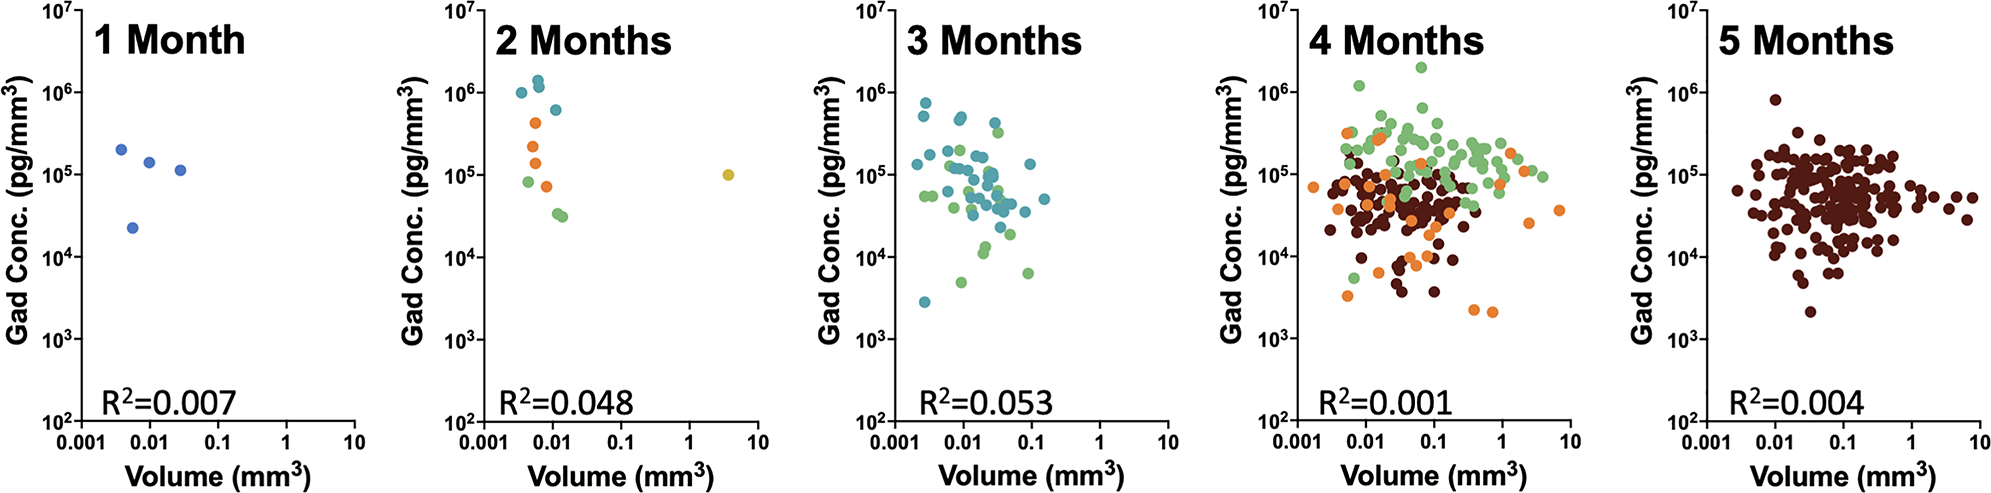
Results: These mice develop cerebral cavernous malformations lesions gradually over 4 to 5 months of age throughout the brain. Precise volumetric analysis of individual lesions revealed nonmonotonous behavior, with some lesions temporarily growing smaller. However, the cumulative lesional volume invariably increased over time and after about 2 months followed a power trend. Using dynamic contrast-enhanced MRI, we produced quantitative maps of gadolinium in the lesions, indicating a high degree of heterogeneity in lesional permeability. MRI properties of the lesions were correlated with cellular markers for endothelial cells, astrocytes, and microglia. Multivariate comparisons of MRI properties of the lesions with cellular markers for endothelial and glial cells revealed that increased cell density surrounding lesions correlates with stability, whereas denser vasculature within and surrounding the lesions may correlate with high permeability.

Conclusions: Our results lay a foundation for better understanding individual lesion properties and provide a comprehensive preclinical platform for testing new drug and gene therapies for controlling cerebral cavernous malformations.

Keywords: astrocytes; endothelial cells; gadolinium; hemorrhage; magnetic resonance imaging.


Conflict of interest statement

Disclosures None.

Figures

Figure 1.
Figure 1.. Induction of Krit1 ablation at postnatal days 5–7 generates a chronic CCM murine model with gradual lesion development brain wide.
A, Timeline of chronic CCM model generation and disease phenotype. B, Macroscopic and brightfield images of lesion burden demonstrate that lesions form throughout the entire brain. C, Comparison of MRI (left) and fluorescence image (right) of the same CCM mouse brain section, demonstrating alignment of the corresponding lesions between the two imaging modalities. In the fluorescence image, lesions are stained with isolectin GS-IB4 (green) and neurons with NeuroTrace (red). Scale bar, 500 μm. White arrows denote lesions.
Figure 2.
Figure 2.. Volumetric analysis of lesions from longitudinal T2-SPACE MR images reveals dramatic increases in lesion burden with age and dynamic changes in size of individual lesions.
A, Representative T2-SPACE MR images from 3 mice in the cohort, illustrating formation of new lesions and dynamic changes in lesion size across time points. B, A semilogarithmic graph showing combined lesion volumes in each individual brain (n=9) as a function of age. Individual mice are represented with single-colored dots, corresponding with graph title colors in panel C. The trend line indicates the slope of the correlation (0.976±0.011 SEM, p<0.001) calculated with random coefficient regression analysis (Table S1). The bars represent means±SEM. C, Semilogarithmic graphs of individual lesion volumes onto age for each mouse in the cohort. Lines connect lesions identified as corresponding lesions across imaging time points. Dots without connecting lines indicate de novo lesion formation or lesions that were only identified at a single time point. Graph titles indicate unique mouse ID where L# denotes litter number and M# denotes arbitrary mouse number within litter. Sex of mice is indicated with the symbol ♀ for females (n=7) and ♂ for males (n=2). Animated MRI sequences of L1-M7 are shown in Supplemental Videos S1–S3.
Figure 3.
Figure 3.. Lesion permeability analysis calculated from T1 contrast mapping reveals cumulative increase in gadolinium deposition with age.
A, Representative MR images of T2-SPACE, a corresponding gadolinium concentration plot generated with T1 contrast mapping, and a merged image, illustrating leakiness of individual lesions in terms of gadolinium deposition. In the gadolinium concentration map, hyperintense areas (red) indicate regions with higher gadolinium deposition. B, A semilogarithmic graph of combined lesional gadolinium mass in each brain (n=6) over age. Individual mice are represented as single-colored dots, corresponding with the color of graph titles in panel C. The trend line shows the slope of the correlation (0.398±0.089 SEM, p=0.004) calculated with random coefficient regression analysis (Table S2). The bars represent means±SEM. C, Semilogarithmic graphs of gadolinium deposition in individual lesions, as a function of age, for each individual mouse in the cohort. Lines connect lesions identified as matched lesion across the imaging time points. Dots without connecting lines indicate de novo lesion formation or lesions that were only identified at a single time point. Graph titles indicate unique mouse ID where L# denotes litter number and M# denotes arbitrary mouse number within litter. Sex of mice is indicated with the symbol ♀ for females (n=4) and ♂ for males (n=2). Animated MRI sequences of L1-M7 are shown in Supplemental Videos S1–S3.
Figure 4.
Figure 4.. Lesion permeability displays a high degree of heterogeneity.
Log-log graphs of gadolinium concentration as a function of lesion volume for all individual lesions at each imaging timepoint. Individual mice (n=6) are represented with single-colored dots, which correspond with color-coding in Figures 2 and 3. The coefficient of determination (R2) values indicate poor correlation between gadolinium concentration and volume for each time point, suggesting highly heterogenous permeability of lesions across age in the chronic Krit1 CCM model.
Figure 5.
Figure 5.. MRI and histochemical signatures of CCM lesions with low and high permeability in L9-M3 (n=1).
Two lesions with the lowest permeability (#32 in the subcortical corpus callosum, gadolinium concentration 41 ng/mm3; and #34 in the thalamus, gadolinium concentration 58.9 ng/mm3; Table S3) are shown on top. Two lesions with the highest permeability (#43 in the brainstem, gadolinium concentration 185.8 ng/mm3; and #47 in the cerebellum, gadolinium concentration 250.5 ng/mm3; see Table S3 for an overview of measurements) are shown at the bottom. MRI insets show T2-SPACE images and gadolinium concentration maps of each lesion in detail. Matching IHC images of each DAPI, GFAP, Iba1 and CD31 channels are shown on the right, next to the 4-channel overlay. Large, highly permeable lesions typically contain numerous CD31-positive endothelial cells. All scale bars are 200 μm. White lines drawn on the merged IHC image for lesion #32 exemplify the lesion border, 50 μm, and 100 μm perimeters used for correlation analysis. See Figure S7 for additional information.

References

    1. Al-Holou WN, O’Lynnger TM, Pandey AS, Gemmete JJ, Thompson BG, Muraszko KM, Garton HJ, Maher CO. Natural history and imaging prevalence of cavernous malformations in children and young adults. J Neurosurg Pediatr. 2012;9:198–205. doi: 10.3171/2011.11.PEDS11390 - DOI - PubMed
    1. Ene C, Kaul A, Kim L. Natural history of cerebral cavernous malformations. Handb Clin Neurol. 2017;143:227–232. doi: 10.1016/B978-0-444-63640-9.00021-7 - DOI - PubMed
    1. Vernooij MW, Ikram MA, Tanghe HL, Vincent AJ, Hofman A, Krestin GP, Niessen WJ, Breteler MM, van der Lugt A. Incidental findings on brain MRI in the general population. N Engl J Med. 2007;357:1821–1828. doi: 10.1056/NEJMoa070972 - DOI - PubMed
    1. Snellings DA, Hong CC, Ren AA, Lopez-Ramirez MA, Girard R, Srinath A, Marchuk DA, Ginsberg MH, Awad IA, Kahn ML. Cerebral Cavernous Malformation: From Mechanism to Therapy. Circ Res. 2021;129:195–215. doi: 10.1161/CIRCRESAHA.121.318174 - DOI - PMC - PubMed
    1. Chan AC, Drakos SG, Ruiz OE, Smith AC, Gibson CC, Ling J, Passi SF, Stratman AN, Sacharidou A, Revelo MP, et al. Mutations in 2 distinct genetic pathways result in cerebral cavernous malformations in mice. J Clin Invest. 2011;121:1871–1881. doi: 10.1172/JCI44393 - DOI - PMC - PubMed

Publication types

MeSH terms