. 2023 Jul;43(7):1134-1153.
doi: 10.1161/ATVBAHA.122.318448. Epub 2023 Apr 20.

Lineage-Specific Induced Pluripotent Stem Cell-Derived Smooth Muscle Cell Modeling Predicts Integrin Alpha-V Antagonism Reduces Aortic Root Aneurysm Formation in Marfan Syndrome Mice

Affiliations

Lineage-Specific Induced Pluripotent Stem Cell-Derived Smooth Muscle Cell Modeling Predicts Integrin Alpha-V Antagonism Reduces Aortic Root Aneurysm Formation in Marfan Syndrome Mice

Ken Nakamura et al. Arterioscler Thromb Vasc Biol. 2023 Jul.

Abstract

Background: The role of increased smooth muscle cell (SMC) integrin αv signaling in Marfan syndrome (MFS) aortic aneurysm remains unclear. Herein, we examine the mechanism and potential efficacy of integrin αv blockade as a therapeutic strategy to reduce aneurysm progression in MFS.

Methods: Induced pluripotent stem cells (iPSCs) were differentiated into aortic SMCs of the second heart field (SHF) and neural crest (NC) lineages, enabling in vitro modeling of MFS thoracic aortic aneurysms. The pathological role of integrin αv during aneurysm formation was confirmed by blockade of integrin αv with GLPG0187 in Fbn1C1039G/+ MFS mice.

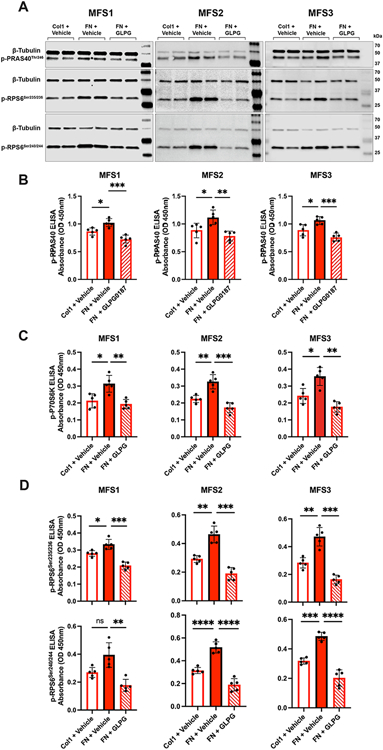
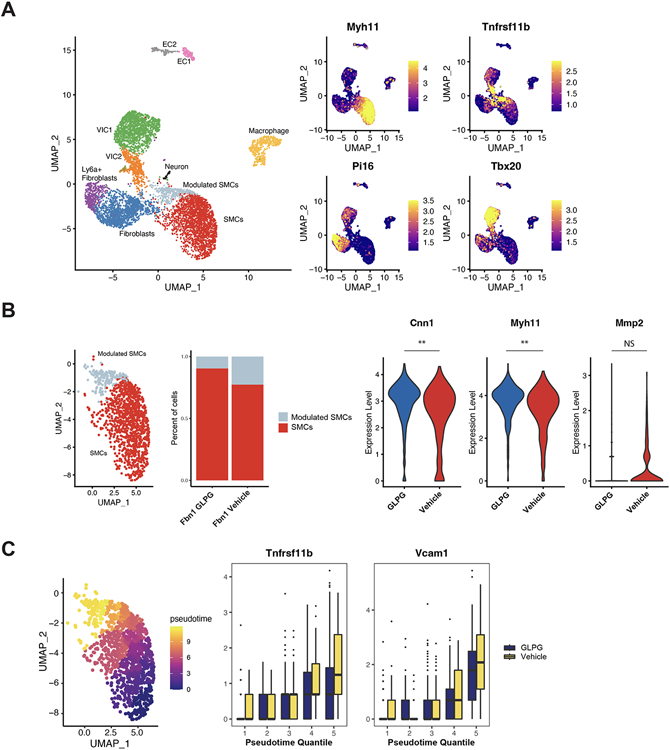
Results: iPSC-derived MFS SHF SMCs overexpress integrin αv relative to MFS NC and healthy control SHF cells. Furthermore, integrin αv downstream targets (FAK [focal adhesion kinase]/AktThr308/mTORC1 [mechanistic target of rapamycin complex 1]) were activated, especially in MFS SHF. Treatment of MFS SHF SMCs with GLPG0187 reduced p-FAK/p-AktThr308/mTORC1 activity back to control SHF levels. Functionally, MFS SHF SMCs had increased proliferation and migration compared to MFS NC SMCs and control SMCs, which normalized with GLPG0187 treatment. In the Fbn1C1039G/+ MFS mouse model, integrin αv, p-AktThr308, and downstream targets of mTORC1 proteins were elevated in the aortic root/ascending segment compared to littermate wild-type control. Mice treated with GLPG0187 (age 6-14 weeks) had reduced aneurysm growth, elastin fragmentation, and reduction of the FAK/AktThr308/mTORC1 pathway. GLPG0187 treatment reduced the amount and severity of SMC modulation assessed by single-cell RNA sequencing.

Conclusions: The integrin αv-FAK-AktThr308 signaling pathway is activated in iPSC SMCs from MFS patients, specifically from the SHF lineage. Mechanistically, this signaling pathway promotes SMC proliferation and migration in vitro. As biological proof of concept, GLPG0187 treatment slowed aneurysm growth and p-AktThr308 signaling in Fbn1C1039G/+ mice. Integrin αv blockade via GLPG0187 may be a promising therapeutic approach to inhibit MFS aneurysmal growth.

Keywords: Marfan syndrome; aortic aneurysm; extracellular matrix; phenotype; proteomic; transcriptome; vascular remodeling.


Conflict of interest statement

Disclosures None.

Figures

Figure 1.
Figure 1.. Integrin αv, p-FAK, and p-AktThr308 protein levels in MFS iPSC SMCs.
A, Western blot analysis for integrin αv expression in iPSC SMCs illustrates increased expression in MFS SHF SMCs compared to control after treatment with TGF-β (2ng/ml) for 24h in low serum SMC medium (n=3 biological replicates). B, Immunofluorescence images of iPSC SMCs: integrin αv (green) and nuclei stained with Hoechst reagent (blue) (x20 magnification, scale bar = 50μm). C, p-FAK and E, p-AktThr308 western blot analysis of iPSC SMCs show increased expression in MFS SHF SMCs compared to control (n=3 biological replicates). D, p-FAK and F, p-AktThr308 (n=3 biological replicates) measured by ELISA. Groups tested by ELISA were compared by two-way ANOVA. Significance is assigned based on the P-value (*P < 0.05, **P < 0.01, ***P < 0.001, ****P < 0.0001).
Figure 2.
Figure 2.. Effect of GLPG0187 on iPSC SMC FAK and AktThr308 phosphorylation.
MFS SHF and NC SMCs were treated with GLPG0187 (10nM) or vehicle control for 24h in low serum SMC medium. Protein expression of A, p-FAK, and C, p-AktThr308 was determined by western blot analysis (n=3 biological replicates). Representative blots are shown. B, D, Results were confirmed with quantitative ELISA (n=3 biological replicates). Two-way ANOVA was performed to examine the effect of GLPG0187 treatment. P-value (*P < 0.05, **P < 0.01, ***P < 0.001, ****P < 0.0001).
Figure 3.
Figure 3.. The p-FAK and p-Akt protein levels in iPSC SMCs following GLPG0187 treatment.
A, Immunofluorescence images of iPSC SHF and NC SMCs stained with Hoechst reagent (blue) and p-FAK antibody (green) (scale bar = 25μm) or B, p-AktThr308 antibody (green) (scale bar = 50μm) following GLPG0187 (10nM) or vehicle control. All images are representative of 4 independent experiments. C, Immunofluorescent staining was quantified as stained area/nuclei (n=4 technical replicates, at least 100 cells counted). D, Integrin αv activation, by growing cells on FN coated plates, increased cellular proliferation compared to Col1 coated plates. GLPG treatment reduced the level of proliferation. Left: Bright field (scale bar = 100 μm); Right: Fluorescent staining of iPSC SMCs: nuclei stained with Hoechst reagent (blue) and actin filaments with Phalloidin (red) (scale bar = 50μm) E, Representative western blot illustrates increased p-FAK and p-AktThr308 protein expression in MFS SHF vs. MFS NC SMCs when grown on FN-coated plates compared to Col1 coated plates (n=3 technical replicates per group).
Figure 4.
Figure 4.. MFS iPSC SMC proliferation and migration.
A, SHF and NC SMC proliferation determined with BrdU assay following GLPG0187 (10nM) or vehicle control treatment. Data expressed as mean ± SD (n=5-6 experimental replicates). Two-way ANOVA performed to examine the effect of GLPG0187 treatment. (**P < 0.01, ****P<0.0001). B, Immunofluorescence microscopy of iPSC SMCs (control (CTR) vs. MFS). DNA counterstain with Hoechst reagent (blue) and Ki-67 antibody (red) following vehicle control or GLPG0187 (10nM) treatment. Graph shows percent Ki-67 positive cells (n=4 technical replicates, scale bar = 100μm). Two-way ANOVA utilized. P-value (*P < 0.05, ****P < 0.0001). C, SMC migration measured by scratch assay (MFS SHF vs. CTR SHF SMCs). SMCs treated with vehicle control or GLPG0187 (10nM) for 24h (scale bar = 500 μm). Quantification reported as percentage cell-occupied area in scratch at 12 and 24h relative to the cell-occupied area at 0h (n=3 per group). D, MFS SHF iPSC SMCs plated on Col1- or FN-coated plates. Immunofluorescence microscopy of Ki-67 performed on SMCs treated with vehicle control or GLPG0187 (10nM) for 24h (scale bar = 100μm). E, SMC proliferation determined by BrdU assay after growing on Col1- or FN-coated plates. SMCs treated with vehicle control or GLPG0187. Data expressed as mean ± SD (n=3 biological each with 6-12 technical replicates). Groups were compared via one-way ANOVA. P-value (*P < 0.05, **P < 0.01, ****P < 0.0001).
Figure 5.
Figure 5.. MFS SHF SMC FAK/Akt signaling activates mTORC1 pathway.
A, MFS SHF SMCs plated on Col1- or FN-coated plates and treated with vehicle control or GLPG0187 for 24h. Protein expression by western blot for p-PRAS40Thr246, p-RPS6Ser235/236, and p-RPS6Ser240/244 following RGD activation by FN. Representative western blot analysis (n=3 biological each with 6 technical replicates) with β-tubulin as internal control. B, p-PRAS40Thr246 (n=3 biological each with 5 technical replicates), C, p-P70S6K (n=3 biological each with 5 technical replicates), D, p-RPS6Ser235/236 (n=3 biological each with 5 technical replicates) and p-RPS6Ser240/244 (n=3 biological each with 5 technical replicates) quantified by ELISA for MFS SHF SMCs plated on Col1- or FN-coated plates treated with vehicle control or GLPG0187 for 24h. One-way ANOVA performed to examine effect of GLPG0187 treatment. P-value (*P < 0.05, **P < 0.01, ***P < 0.001, ****P < 0.0001).
Figure 6.
Figure 6.
A, p-P70S6K ELISA for MFS SHF SMCs activated with FN-coated plates after treatment with vehicle control or LY2584702 (1 μM). B, Immunofluorescence microscopy of Ki-67-stained iPSC MFS SHF SMCs. DNA counterstain with Hoechst reagent (blue) and Ki-67 antibody (red) following treatment with either vehicle control or LY2584702 (1μM). Ki-67 and BrdU quantification shown in graph. Data represented as the mean ± SD (n=3 biological each with 12 technical replicates, scale bar = 50 μm). Welch’s t-test used for comparison between vehicle control vs. LY2584702 treated. P-value (*P < 0.05, **P < 0.01, ***P < 0.001, ****P < 0.0001). C, Migration assay performed on iPSC MFS SHF SMCs treated with either vehicle control or LY2584702 (1μM) (scale bar = 500 μm). Percentage of cell-occupied area in scratch at 12 and 24h was showed relative to the cell-occupied area at 0h. Graph was plotted with the average value of % closure (n=3 technical replicates). D, MFS SHF iPSC SMCs plated on Col1- or FN-coated cell culture plates and treated with LY2584702. p-RPS6Ser235/236 and p-RPS6Ser240/244 protein expression detected with western blot (n=3 biological each with 4 technical replicates) and ELISA (n=3 biological each with 5 technical replicates). Welch’s t-test was performed to examine the effect of LY2584702 treatment. P-value (*P < 0.05, **P < 0.01, ***P < 0.001, ****P < 0.0001) E, Loss-of-function studies performed using siRNA against scramble control siRNA, integrin αv siRNA, or untreated iPSC MFS SHF SMCs (n=2, biological replicates). Immunofluorescence staining for integrin αv (green) shows decreased expression in integrin αv siRNA-treated SMCs. Western blot reveals decreased p-FAK, p-PRAS40Thr246, p-RPS6Ser235/236, and p-RPS6Ser240/244.
Figure 7.
Figure 7.. Integrin αv upregulated in Fbn1C1039G/+ murine aortic root.
A, Western blot for integrin αv and p-AktThr308 in Fbn1C1039G/+ and wild type (WT) littermate control aortic root/ascending specimens at ages 6 (n=5, per group) and 14 (n=5, per group) weeks. B, Immunofluorescent staining for integrin αv in thoracic aorta (root and ascending) longitudinal sections. Integrin αv is enhanced in Fbn1C1039G/+ (right) compared to WT (left) aortic root specimens (scale bar = 500 μm). Magnification (20x) of the aortic root segments demonstrates Fbn1C1039G/+ integrin αv staining is localized within the medial layer (scale bar = 100 μm). C, Single cell RNAseq of 16-week SHF-lineage traced mice. Total dataset comprising all major aortic cell types (upper left). SMC (red) and modulated SMC (modSMC) (grey) clusters are similar between tdT-negative (NC) and SHF derived cells (lower left). Integrin αv (Itgav) gene expression is significantly increased in Fbn1C1039G/+ vs. WT SMCs (p=2.50x10⁻¹³). There is no difference in Itgav gene expression when comparing total SHF- vs. tdT neg (NC) lineage SMCs (p=1). When subtyped into SMC vs. modSMC, Itgav is enhanced in modSMCs in both tdT neg (NC) and SHF SMCs (p=7.36x10⁻²⁶)
Figure 8.
Figure 8.. Integrin αv receptor blockade attenuates aortic root aneurysm growth in Fbn1C1039G/+ mice, in vivo.
A, Aortic root diameter (mm) and growth rate (mm/8wks)in WT and Fbn1C1039G/+ mice treated with either vehicle control or GLPG0187 (100mg/kg) measured with transthoracic echocardiography at ages 6 through 14 weeks (n=13, per group). Results presented as mean ± SD. * represents significant difference between MFS GLPG and MFS Vehicle. † represents significant difference between MFS Vehicle and WT Vehicle. B, Elastin lamina breaks was evaluated with elastin Van Gieson staining (EVG) in aortic root from Fbn1C1039G/+ mice treated with vehicle control or GLPG0187 (100mg/kg) or vehicle control at age 14 weeks (n=6, per group, scale bar = 50μm). C, Western blotting for p-AktThr308, p-RPS6Ser235/236 and p-RPS6Ser240/244 in aortic root/ascending aortic specimens from WT and Fbn1C1039G/+ mice treated with vehicle control or GLPG0187 (100mg/kg) at age 14 weeks. D, P-AktThr308 (n=6, per group), p-PRAS40 (n=3, per group), p-RPS6Ser235/236 (n=3, per group), and p-RPS6Ser240/244 (n=3, per group) expression were measured by ELISA. Welch’s t-test was performed to examine the effect of GLPG0187 treatment. P-value (*P < 0.05, **P < 0.01, ***P < 0.001, ****P < 0.0001).
Figure 9.
Figure 9.. scRNAseq in GLPG-treated Fbn1C1039G/+ mice reveals reduced SMC phenotype modulation (modSMC)
A, Total dataset comprising all major aortic cell types in Fbn1C1039G/+ GLPG- and vehicle control-treated root/ascending aortic segments (left). Validated markers for major cell types (SMCs:Myh11; modSMCs:Tnfrsf11b; fibroblasts: Pi16; and valve interstitial cells: Tbx20) (right). B, SMC subsets consisting of SMCs and modulated SMCs (modSMCs). GLPG-treatment reduced the overall percentage of SMC phenotype modulation by over 50%. GLPG-treatment increased SMC contractility (Cnn1 and Myh11) and reduced proteolytic matrix metalloproteinase 2 (Mmp2) gene expression. C, Pseudotemporal scoring reflects SMC phenotype progression from quiescent SMCs to phenotype modulated SMCs. GLPG-treatment reduced modSMC markers including, Tnfrsf11b (osteoprotegerin) and Vcam1 (vascular cell adhesion molecule 1) at later pseudotime quantiles.
Figure 10.
Figure 10.. Proposed pathologic mechanism of lineage-specific integrin αv-Akt-mTORC1-RPS6 signaling during MFS aortic root aneurysm formation.
Integrin αv signaling is enhanced in MFS aortic root SHF compared to adjacent NC SMCs. The mTOR protein complex 1 (mTORC1) is composed of mTOR, PRAS40, Raptor, mLST8, and deptor. Following integrin αv activation, Akt-dependent phosphorylation deactivates PRAS40, an inhibitory component of the mTORC1 complex. mTORC1 subsequently activates RPS6, an essential component of the 40S ribosomal subunit, ultimately increasing protein synthesis and cell growth. Enhanced SMC phenotype modulation, proliferation and migration participate in aneurysm development.

Comment in

  • Altered Integrin Signaling in Thoracic Aortopathy.
    Humphrey JD, Schwartz MA. Humphrey JD, et al. Arterioscler Thromb Vasc Biol. 2023 Jul;43(7):1154-1156. doi: 10.1161/ATVBAHA.123.319404. Epub 2023 May 11. Arterioscler Thromb Vasc Biol. 2023. PMID: 37165879 No abstract available.

Similar articles

Cited by

References

    1. Dietz HC, Cutting CR, Pyeritz RE, Maslen CL, Sakai LY, Corson GM, Puffenberger EG, Hamosh A, Nanthakumar EJ, Curristin SM, Stetten G, Meyers DA, Francomano CA. Marfan syndrome caused by a recurrent de novo missense mutation in the fibrillin gene. Nature. 1991;352(6333):337–339. doi:10.1038/352337a0 - DOI - PubMed
    1. Judge DP, Dietz HC. Marfan’s syndrome. Lancet. 2005;366(9501):1965–1976. doi:10.1016/S0140-6736(05)67789-6 - DOI - PMC - PubMed
    1. Saeyeldin A, Zafar MA, Velasquez CA, Ip K, Gryaznov A, Brownstein AJ, Li Y, Rizzo JA, Erben Y, Ziganshin BA, Elefteriades JA. Natural history of aortic root aneurysms in Marfan syndrome. Ann Cardiothorac Surg. 2017;6(6):625–632. doi:10.21037/acs.2017.11.10 - DOI - PMC - PubMed
    1. Pyeritz RE. Etiology and pathogenesis of the Marfan syndrome: current understanding. Ann Cardiothorac Surg. 2017;6(6):595–598. doi:10.21037/acs.2017.10.04 - DOI - PMC - PubMed
    1. Milewicz DM, Dietz HC, Miller DC. Treatment of Aortic Disease in Patients With Marfan Syndrome. Circulation. 2005;111(11). doi:10.1161/01.CIR.0000155243.70456.F4 - DOI - PubMed

Publication types

MeSH terms