

Using quantitative magnetic resonance imaging to track cerebral alterations in multiple sclerosis brain: A longitudinal study
- PMID: 37078406
- PMCID: PMC10176005
- DOI: 10.1002/brb3.2923
Using quantitative magnetic resonance imaging to track cerebral alterations in multiple sclerosis brain: A longitudinal study
Abstract
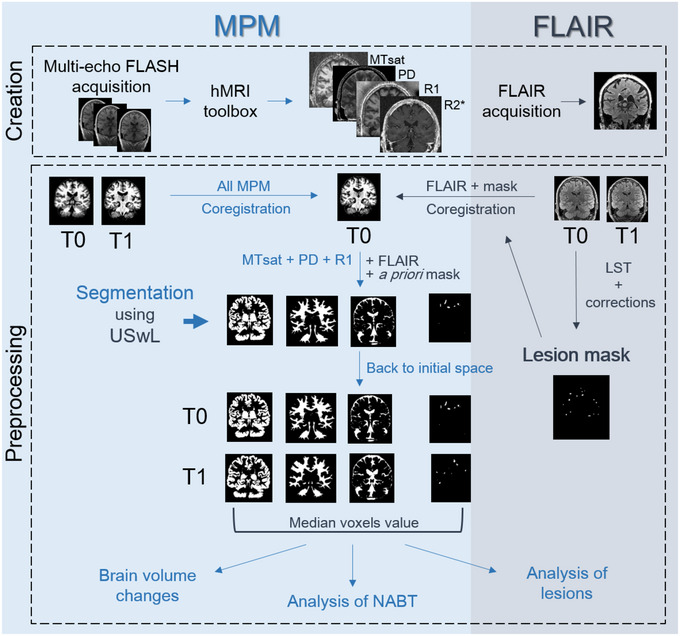
Introduction: Quantitative MRI quantifies tissue microstructural properties and supports the characterization of cerebral tissue damages. With an MPM protocol, 4 parameter maps are constructed: MTsat, PD, R1 and R2*, reflecting tissue physical properties associated with iron and myelin contents. Thus, qMRI is a good candidate for in vivo monitoring of cerebral damage and repair mechanisms related to MS. Here, we used qMRI to investigate the longitudinal microstructural changes in MS brain.
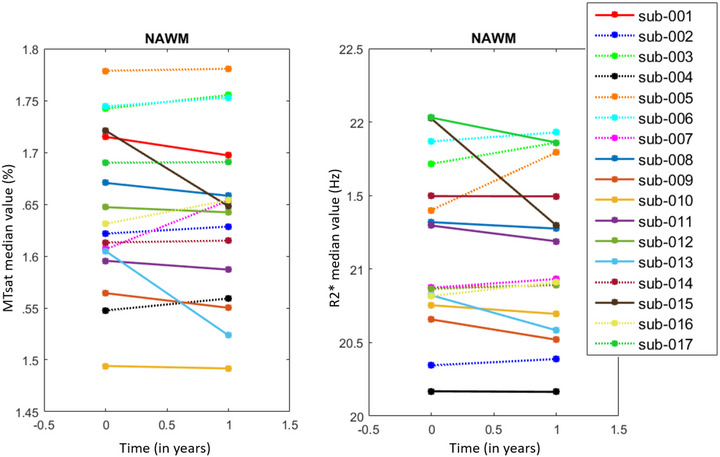
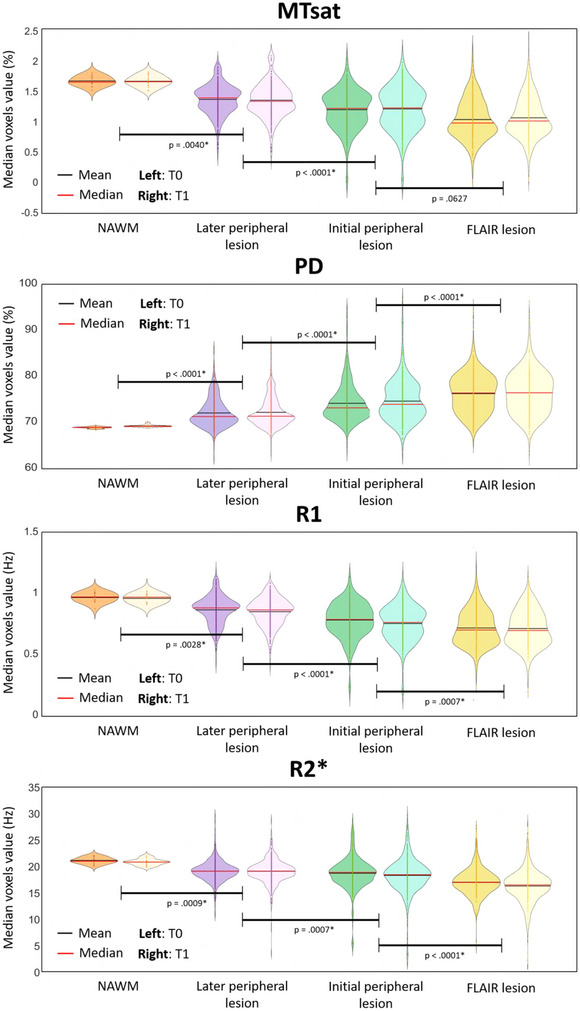
Methods: Seventeen MS patients (age 25-65, 11 RRMS) were scanned on a 3T MRI, in two sessions separated with a median of 30 months, and the parameters evolution was evaluated within several tissue classes: NAWM, NACGM and NADGM, as well as focal WM lesions. An individual annual rate of change for each qMRI parameter was computed, and its correlation to clinical status was evaluated. For WM plaques, three areas were defined, and a GLMM tested the effect of area, time points, and their interaction on each median qMRI parameter value.
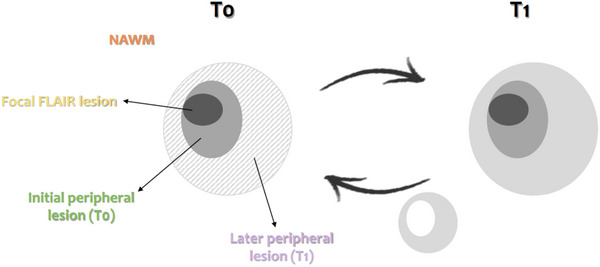
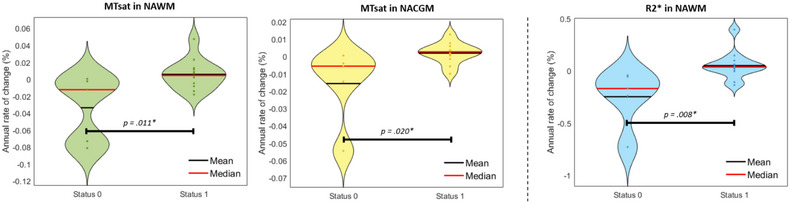
Results: Patients with a better clinical evolution, that is, clinically stable or improving state, showed positive annual rate of change in MTsat and R2* within NAWM and NACGM, suggesting repair mechanisms in terms of increased myelin content and/or axonal density as well as edema/inflammation resorption. When examining WM lesions, qMRI parameters within surrounding NAWM showed microstructural modifications, even before any focal lesion is visible on conventional FLAIR MRI.
Conclusion: The results illustrate the benefit of multiple qMRI data in monitoring subtle changes within normal appearing brain tissues and plaque dynamics in relation with tissue repair or disease progression.
Keywords: longitudinal analysis; multiple sclerosis; quantitative MRI; relaxometry.
© 2023 The Authors. Brain and Behavior published by Wiley Periodicals LLC.
Figures
References
-
- Anderson, M. J. (2001). Permutation tests for univariate or multivariate analysis of variance and regression. Canadian Journal of Fisheries and Aquatic Sciences, 58(3), 626–639. 10.1139/f01-004 - DOI
-
- Andica, C. , Hagiwara, A. , Kamagata, K. , Yokoyama, K. , Shimoji, K. , Saito, A. , Takenaka, Y. , Nakazawa, M. , Hori, M. , Cohen‐Adad, J. , Takemura, M. Y. , Hattori, N. , & Aoki, S. (2019). Gray matter alterations in early and late relapsing‐remitting multiple sclerosis evaluated with synthetic quantitative magnetic resonance imaging. Scientific Reports, 9(1), 8147. 10.1038/s41598-019-44615-3 - DOI - PMC - PubMed
Publication types
MeSH terms
LinkOut - more resources
Full Text Sources
Medical
